[Technical Indicators] - Crypto Academy / S4W2- Homework Post for @reminiscence01

Hello Crypto Academy Family,
In this assignment today, I want to write about Technical Indicator according to my understanding based on the following questions below:
a) In your own words, explain Technical indicators and why it is a good technical analysis tool.
b) Are technical indicators good for cryptocurrency analysis? Explain your answer.
c) Illustrate how to add indicators on the chart and also how to configure them. (Screenshot needed).a) Explain the different categories of Technical indicators and give an example of each category. Also, show the indicators used as an example on your chart. (Screenshot needed).
b) Briefly explain the reason why indicators are not advisable to be used as a standalone tool for technical analysis.
c) Explain how an investor can increase the success rate of a technical indicator signal.
Technical Indicator is a mathematical paradigm which is gotten from past data and it is used by investors and traders to make a good prediction on the price trend of cryptocurrencies and it also aids them to make a better decision before trading or investing.
A series of data points from past price, volumes, and open interest data are derived from using a mathematical formula. For analysis sake, Price chart comparison is made with it's corresponding technical Indicator graph. Technical Indicator also captures the psychology of investors to ably predict future trends of price activities.
Technical Indicators as a tool of technical analysis helps traders to make investments in cryptocurrency. However, technical Indicator serves as a signaling tool that provides information for traders when used with other technical analysis tools. Technical Indicators are applied in technical analysis to predict price movements.
(b) Yes, Technical Indicators are good for Cryptocurrency analysis because it helps traders to determine when to enter into a trade and when to exit a trade for profit making i.e. to know market Entry and exit points.
(c) How to Add and Configure Indicator in Binance
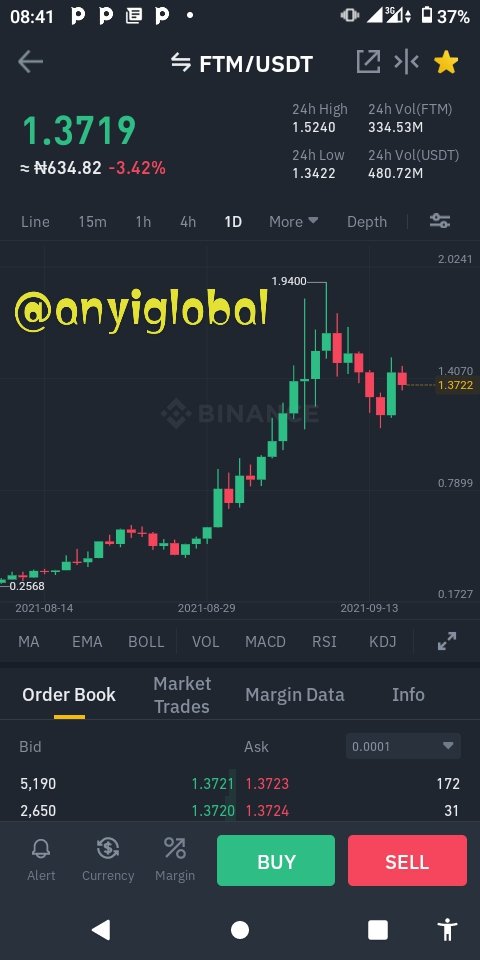
Open your Binance on your device. In this content, am using the Binance mobile App. Click on "market" tab at the bottom of the page! when the page opens, choose any coin pairs of your choice, but for the sake of this assignment am using FTM/USDT pairs. After choosing the coin pairs, click on the signal symbol as shown in the screenshot below:
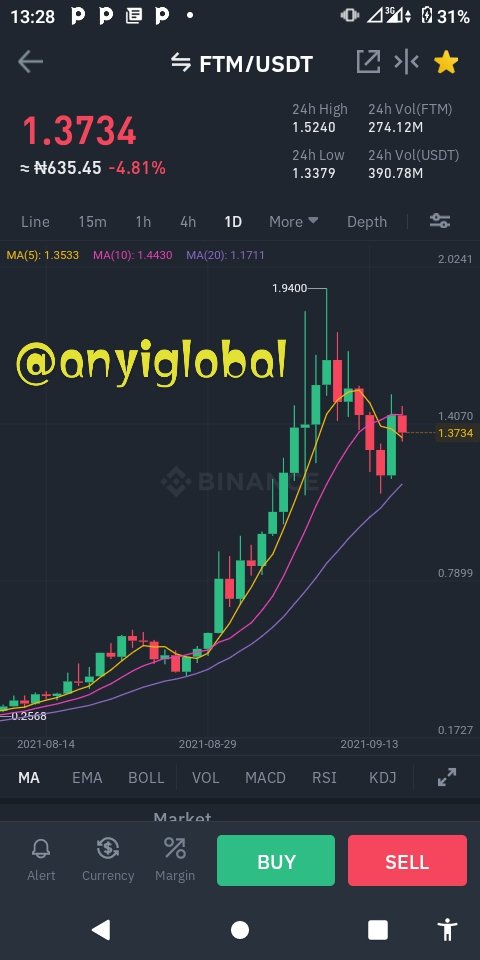
Add Indicator
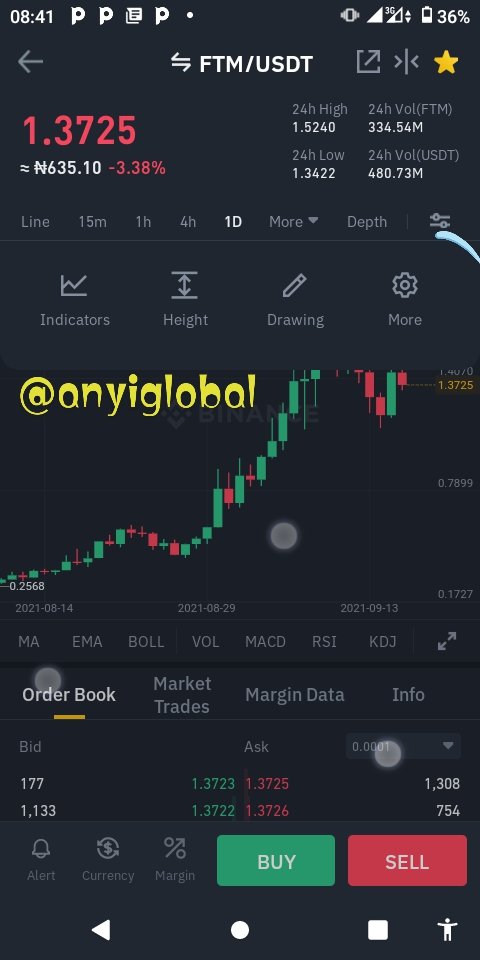
From the screenshot above, click on indicator to choose an indicator of your choice. After clicking the button, the list of Indicators available will appear. As in the screenshot shown below:
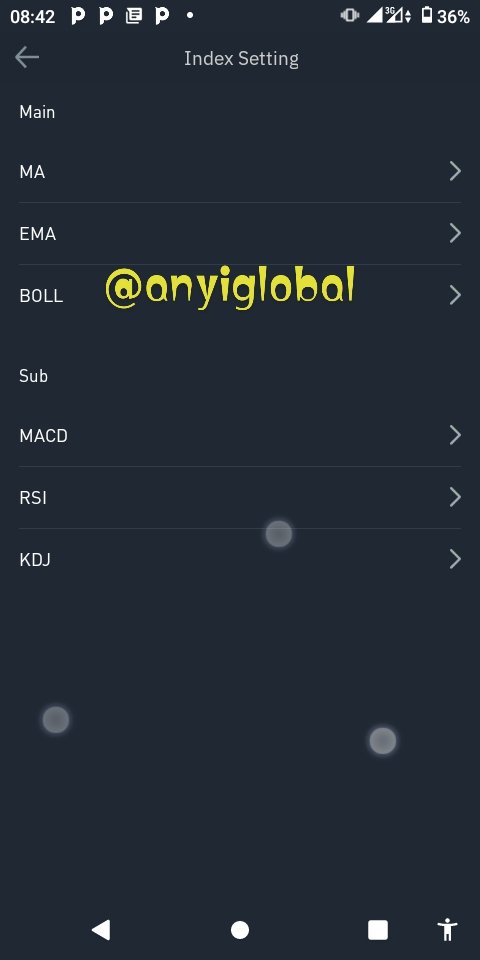
The available Indicators include;
- MA
- EMA
- BOLL
- MACD
- RSI
- KDJ
Click on anyone of your choice and click on "Confirm" as shown in the screenshot below:
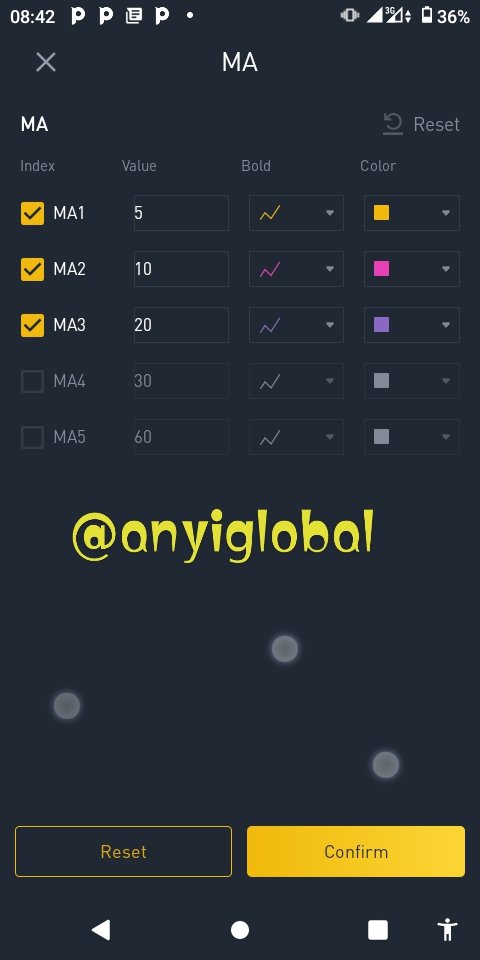
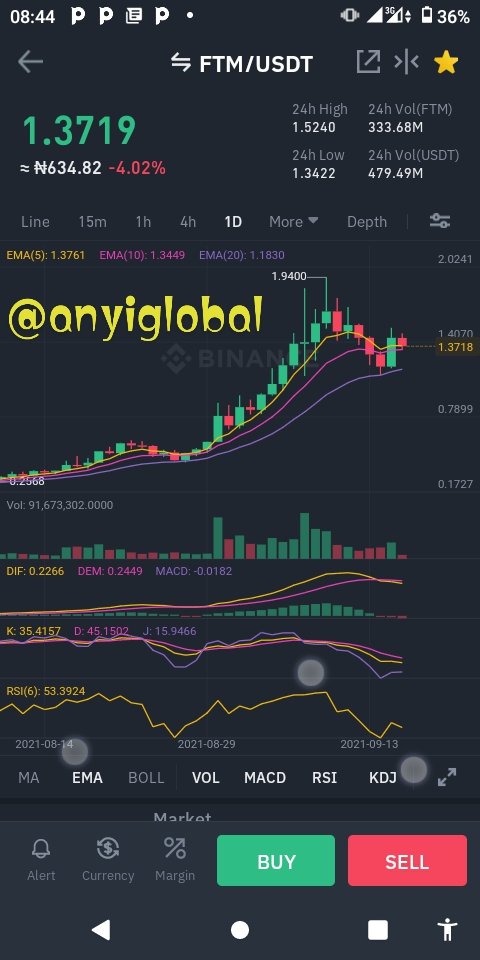
From the screenshot above, you can configure the Indicator by changing the colour, the Boldness, and the Value.
The Screenshot shown below is the output of the Indicator chosen above:
You can Further Activate other sub Indicators such as MACD, RSI, and KDJ as shown below:
CATEGORIES OF TECHNICAL INDICATORS AND THEIR EXAMPLES
There are several categories of technical Indicator that traders can use to make decisions on the market. These categories include; Trend-based Indicators, Momentum-based Indicators, Volatility-based Indicators. I will explain these with their examples below.
Moving Average Indicator: FTM/USDT pair
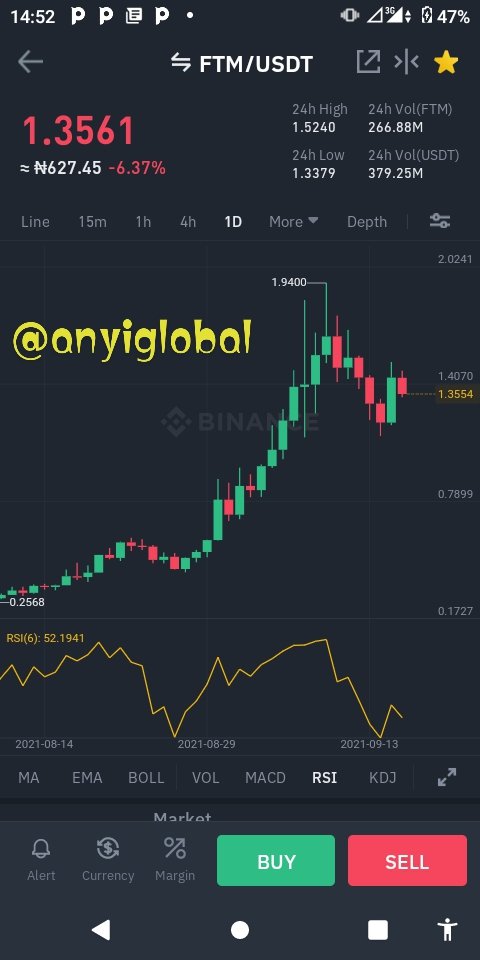
RSI indicator: FTM/USDT
Due to volatility of cryptocurrencies, the price of assets swing up and down. A trader has to take advantage of the price swing down by using the Volatility Indicators to measure the price swings. Traders can analyze price changes using Volatility Indicators so as to make profit.
Para Venture If Volatility does not occur in a market, there's a possibility of not having a profitable trading because the price doesn't change. Examples of this includes:
- Bollinger Bands
- Average Directional Movement
- Average True range (ATR)
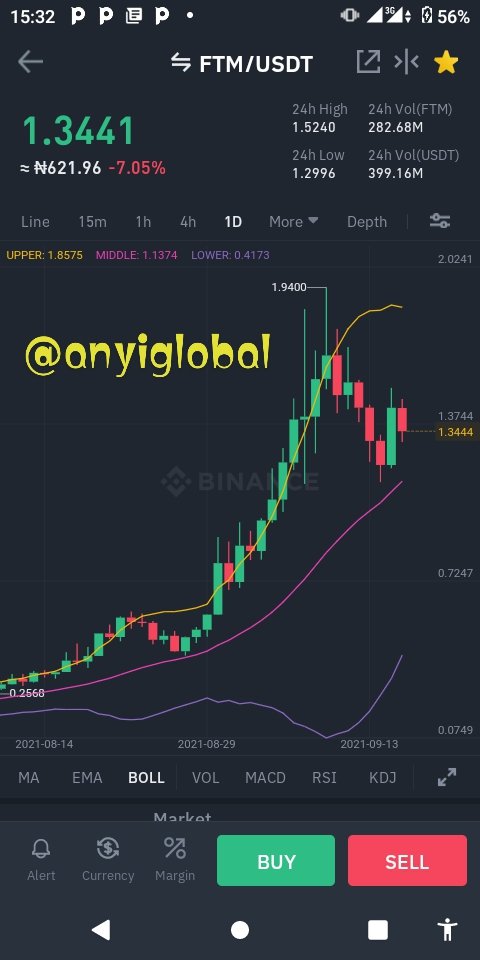
Bollinger Bands indicator: FTM/USDT
(b) Reason why Technical Indicators cannot be used as a standalone tool for technical analysis
Technical Indicators cannot be used as a standalone tool for technical analysis because on several occasions two Indicators will shot contradictory Information. The signals of Indicators is not 100% sure. It can bear false signals or lag behind the current market price. So it is not advisable to use it as a standalone tool for technical analysis, rather It can be used as confirmation tool for other technical analysis tools.
(c) How an investor can increase the success rate of a technical Indicator An investor can increase the success rate of a Technical Indicator by doing the following: - Using it to understand the market condition, hence make good predictions of their trade.
Make good management of their trade
Make good signal confirmation!
Thanks and God bless you!!
Cc: @reminiscence01