STEEMIT CRYPTO ACADEMY: WEEK 15 HOMEWORK POST FOR PROFESSOR @yohan2on - SWING TRADING.
Hello crypto academians, here is my homework post for profesor @yohan2on.
SWING TRADING
This is a type of trading where a cryptotrader holds a particular cryptocurrency pair for a longer period of time as compared to the day trading and then make some profits from the swings in the price of that cryptocurrency pair. This type of trading is not as hectic as the day trade when it comes to the activities involved, but what matters the most in this trading type is your strategies; your entry point and your exit point. The above mentioned are the factors that will decide wether you have a successful trading session at the end or lose your assets.
Any trader making use of this type of trading system will always have to hold the cryptocurrency for days, weeks or every months depending strictly on the choice of the trader.

A CRYPTO ASSET PAIR - BTC/USDT
Cryptocurrency Trading is always done using pairs, this simply means that the trade will see you exchanging one currency among the pairs for the other.
The pair I will be using for my trading plan is the BTC/USDT pair. Pairing the BTC with USDT means that I will be exchanging the BTC for USDT which is equivalent to the Dollar. I prefer the BTC/USDT pair because it always have a high liquidity accros all exchange platforms. But nevertheless, there are many other cryptocurrency pairs like ENJ/USDT, ENJ/ETH and many others.
When making your swing Trading plan, it is very important for you to clearly analyse understand the cryptocurrency pair that you want to use. One of the things you need to checkout is the liquidity and volume of the cryptocurrency pair you want to use in the exchange platform you will be using. This is important because the volume of a cryptocurrency pair in a particular exchange may be a bit lower than what you saw in a different exchange and this will affect the liquidity of such pair in that Exchange platform. What makes this happen is always the number of people trading using that particular pair on that platform.
MY ENTRY AND EXIT STRATEGY
Firstly, my entry point is the time I enter for the trade or buy the cryptocurrency asset and start holding it while my exit point is the time where I sell the cryptocurrency asset to make profit. So one thing I bear in mind is that my entry point should be the point where the price of the cryptocurrency pair I want to buy, which I have chosen BTC/USDT is low or has reduced, then my exit point should be that point where the price of such pair must have increased to the extent that I will make a reasonable profit when selling the cryptocurrency asset.
Before proceeding to make my swing trading, I always like to do my technical analysis with the chart of that particular cryptocurrency pair. This is very important for every swing trader as you need to make use of various indicators available in the chart and try to figure out what should be your entry point and your exit point.
I also do a little fundamental analysis, but I am always focused more on technical analysis.
From the technical analysis, I use indicators like EMA, RSI, MACD and most especially the volume indicator to set my entry point and exit point.
MULTIPLE TIME FRAME ANALYSIS
When it comes to swing trading, then the multiple time frame analysis is the key to the decisions you will make concerning your swing trade. The multiple time frame analysis is a kind of technical analysis that also use the chart and some indicators just like the normal technical analysis that we know.
But this one is done with the chart of many different time frames in order to ascertain the best entry and exit points for a swing trade.
Before making decisions as a swing trader, you need to analyze the 4-hour, daily, weekly and monthly chart of the pair you want to trade with and then take note of the trends in the charts of these multiple time frame charts and then determine how you will perform your swing trade, this is what we call MULTIPLE TIME FRAME ANALYSIS.
MONTHLY CHART OF BTC/USDT
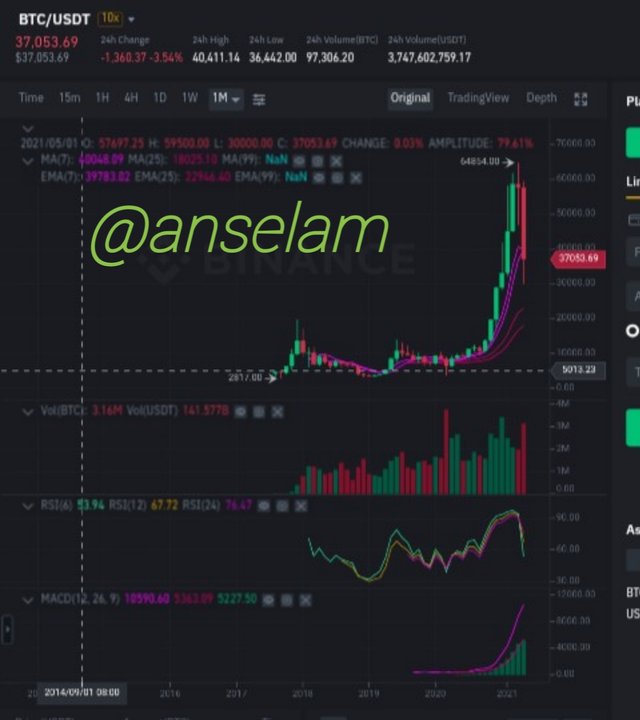
Taking a good look at the monthly chart o the BTC/USDT pair, it can be noted that the price of the asset was previously on an increase that saw it take an upward trend to $64834.00, but it has taken a recent downward fluctuation to $37053.69 which is a very massive downward movement.
The volume of the BTC is 3.16m while the volume of USDT is 141.577B.
WEEKLY CHART OF BTC/USDT
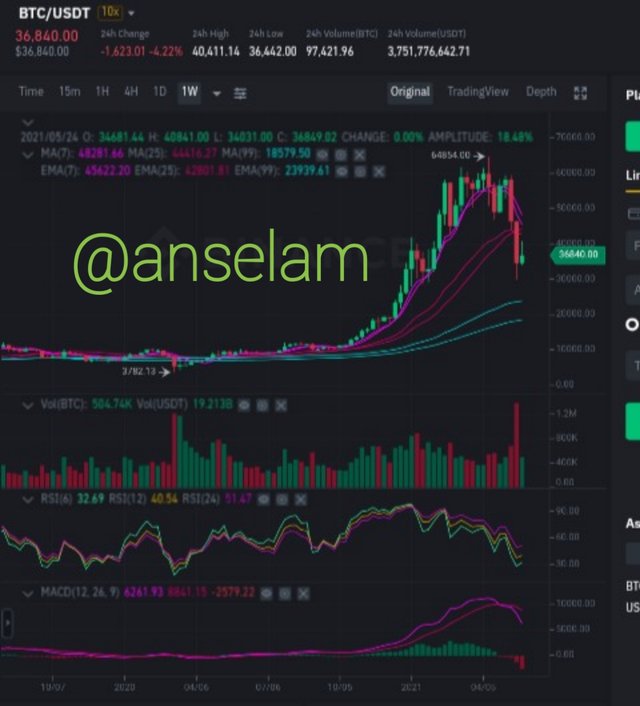
From this weekly chart of the BTC/USDT pair, it can be seen more clearly that the price of the pair has taken a little noticable uptrend which has taken the price to $36954.33 from a previous $36442.00. And from the volume indicator, it can be seen how the volume has been fluctuating very frequently, but it can be seen that there is still much interest in the market.
DAILY CHART OF BTC/USDT
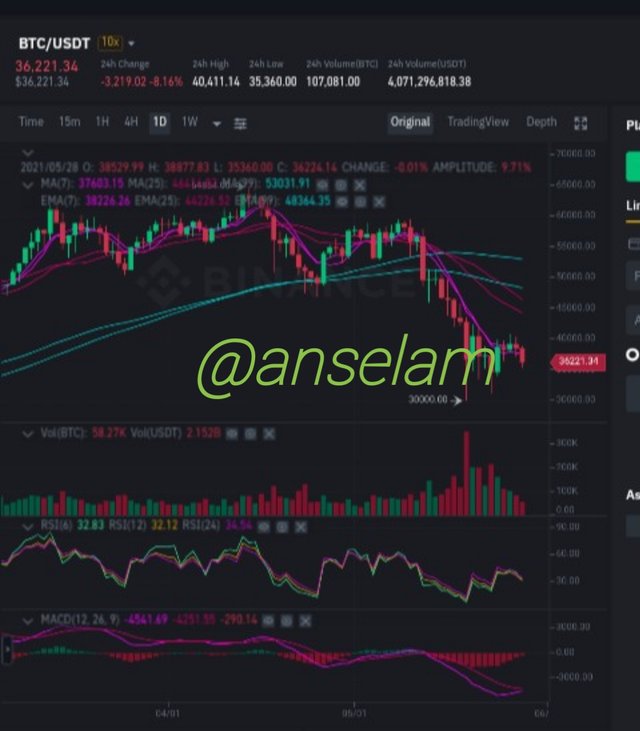
This daily chart is showing a little downward movement of the price of the asset to $36221.34 after it previous had a little upward trend as seen with the candlesticks.
It can also be observed that people have lost some little interest in the market and the demand for it is on reduction as seen in the volume indicator.
4-HOUR CHART OF BTC/USDT
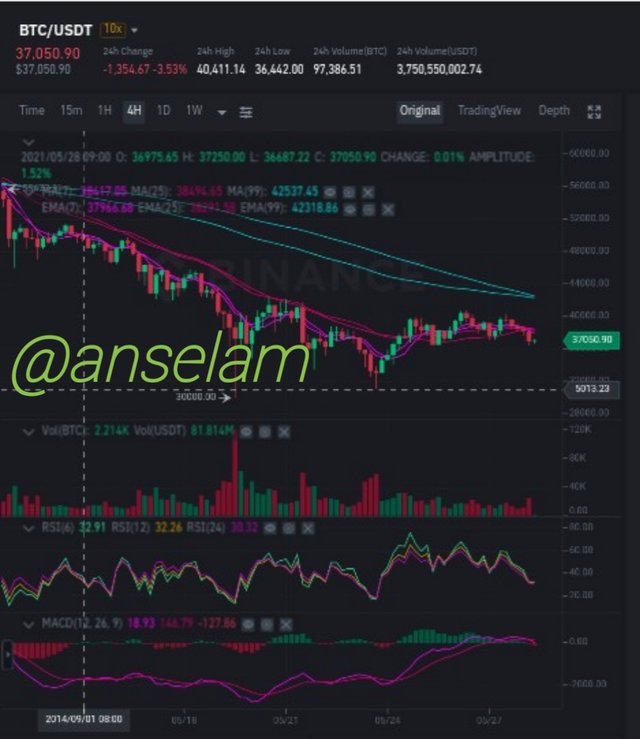
It can be seen in this particular chart that the volume of the asset is still relatively low, but the price has taken a little upsurge to $37050.90. The market is not picking up momentum right now and it could further make more downward trend, but the market is likely to get to the Support level soon at $35,000.00.
CANDLESTICK ANALYSIS
Taking a look at the monthly chart, the price of the BTC/USDT pair had some upward trend previously as represented by the medium-sized candlesticks colored green, but the price later had a downtrend to $37,000 approximately once it reached a Resistance of $64,000 approximately. The $37,000 mark is likely the Support point as the price could go up to a highest of $40,000 in the next month.
But looking at the weekly chart, the little green candlestick shows the small increase in the price after the recent backdrop. It looks like a bigger increase is coming in the next week after the price hit the support point of $36442.00.
From the daily chart, it can be seen that all the recent movements are represented by small candlesticks, showing that the rate of fluctuations has not been high, so in the next day, the change in price of the BTC/USDT might not be much, but another green candlestick might come in for a little increase in the price.
In the 4-hour chart, we can see a very little candlestick initiating at the end of the chart, so the price of the price is at the increase from $37050.90 upward.
TRADE MANAGEMENT
This is the that very crucial point or sector of the swing trading. The trade management is the final decisions made by the swing trader. This decisions are his stop loss, take profit, trailing stop loss and other related points.
Having considered all the analysis I have made on BTC/USDT pair, I will wait for the price to hit $30,000 before a enterfor the trade. I am expecting that to be the Support level so I will set my stop loss at $27500.00. My take profit will be kept at $40,000 while I will keep my trailing stop at $28000.
CONCLUSION
The swing trading type is less stressful and it could attract some beginners due to that reason, but it is good to note that you need to have the right entry point and exit point gotten from a very good technical analysis. If not, this trading type will end up being a nightmare for you if you enter the trade at the wrong time which will subsequently lead you to exiting at the wrong time too.
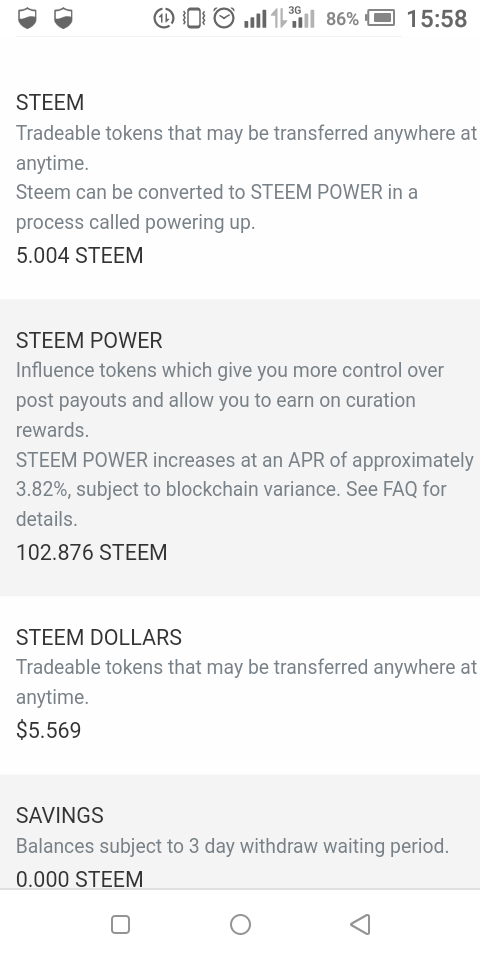
Unfortunately, your Steem power lies below the required minimum of 100SP
Hello professor @yohan2on, I have up to 100SP in my wallet. Thanks.
Hello professor @yohan2on I have up to 100SP in my wallet now, please review my post.
https://steemit.com/hive-108451/@anselam/steemit-crypto-academy-week-15-homework-post-for-professor-yohan2on-swing-trading