STEEMIT CRYPTO ACADEMY: SEASON 3 - WEEK-3 HOMEWORK POST FOR PROFESSOR @lenonmc21 - TOPIC: TRENDS.
TREND
This is a situation where the price of an asset is now going in one direction which shows that the traders of that asset are now making their investment in a similar part. We can also say that trend is when the price of the asset represented in the chart is going down continuously or going up continuously.
Trend is a very important tool in Technical analysis, its role in the chart is to show the predominant direction in the price of an asset at a particular time. Trends help investors to make a good trade if he/she is able to identify the trends.
Trendlines
These are lines drawn by traders on charts to connect series of prices; the maximums in the case of an upward trend or the highs in the case of a downtrend. This line shows the direction where the price of the asset is headed.
As mentioned earlier, the role of the trendline in a chart is to determine the direction of the price of the item. It shows the do of an underlying trend and there increasing the chances of an investor making a successful trade.
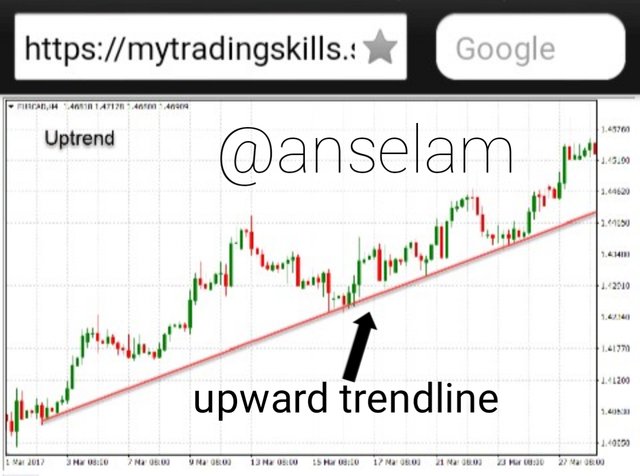
HOW TO DRAW AN UPTREND LINE
To draw an upward trend line, you need to identify the series of minimums and mark them out for easy identification, then you draw a straight line that join those marked points (minimums) together. Before you can draw an upward trend line, you need to identify at least two minimums so that you can connect them with a thin line to determine the trend.
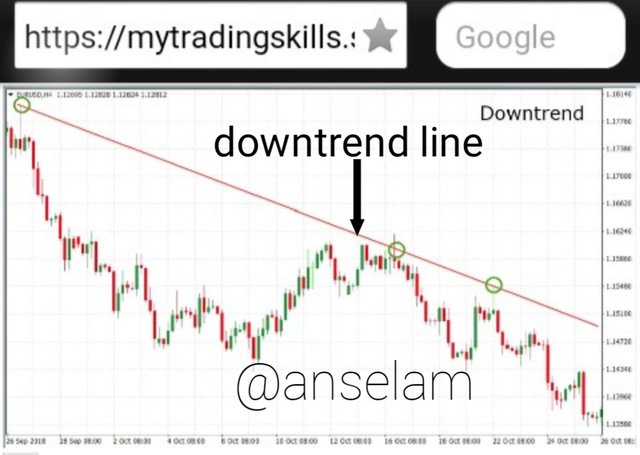
HOW TO DRAW A DOWNTREND LINE
In this particular case, the points that need to be connected are the highs, so you need to identify two or more highs on the chart and mark them out for easy identification as seen in the screenshot below. After marking out the high points carefully, you now connect them with a line.
SUPPORT AND RESISTANCE
SUPPORT
When the price of an asset or security drops, it is very likely that the traders will demand more for shares. When this happens, the downtrend is expected to stop and take a reverse, this is the point known as the Support and the line it forms is the support line.
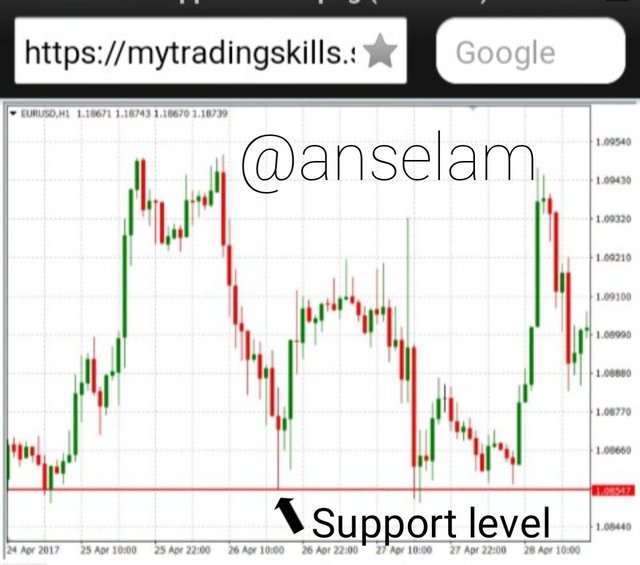
HOW TO IDENTIFY THE SUPPORT ZONE
Just like every other relevant features on a chart, we can identify the support zone by looking out for those points where the downtrend stops and then started moving upward again. We can also mark these points and draw a line to connect them, this line is called the support line.
Resistance
This is the some where the price of an asset does not increase any further after a continuous uptrend movement. The resistance zone is similar to the support zone or level, but the difference is that the resistance level shows the price-level at which the price of that asset could not go beyond.
As the name implies, the price of that asset is resisted at that level.
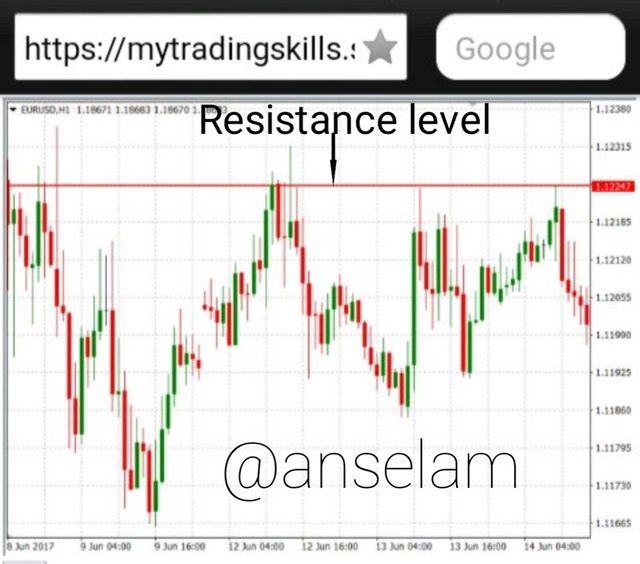
HOW TO IDENTIFY THE RESISTANCE ZONE
We can identify the resistance level or zone by looking for the high point which which the price of the asset could not break above. We can also draw a line to join these points when it is two or more, this line is known as the resistance line.
SIMPLE CHART PATTERNS
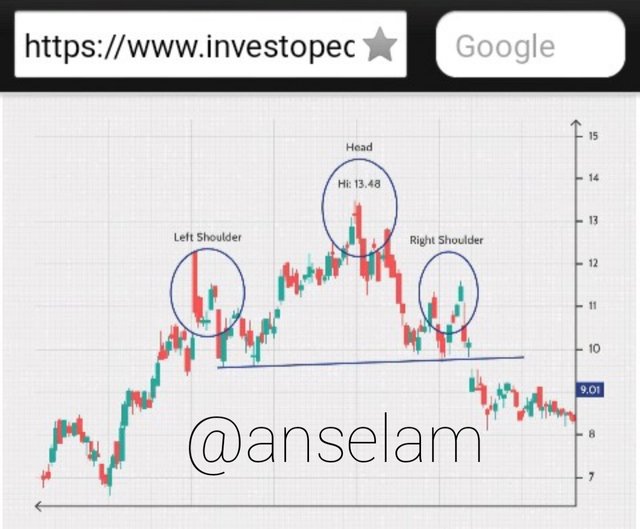
1 - HEAD AND SHOULDERS
In this chart pattern, there is a large peak, and then there are two other smaller peaks on either side of the chart. This chart pattern helps the traders to predict the reversal of a bullish-to-bearish trend.
It is typical for the first and third peaks which are on the sides to be smaller than the second peak which is in the middle.
But all the three peaks are always falling back to the same support level. When the third peak falls back to the support zone, it is very possible that it will bring about a downtrend that will be bearish.
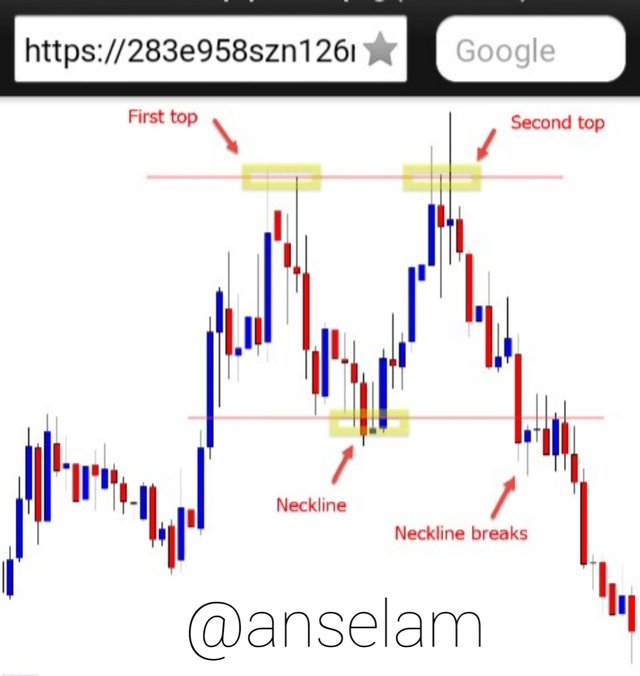
2 - DOUBLE TOP
In this chart pattern, the price of the asset will Witness a peak, it will later retrace back to a Support level, from here it will move upward once again, then lastly it will reverse to a direction that is opposite to that of the prevailing trend in a permanent manner.
Traders also use this chart pattern to show the reversal of trends.
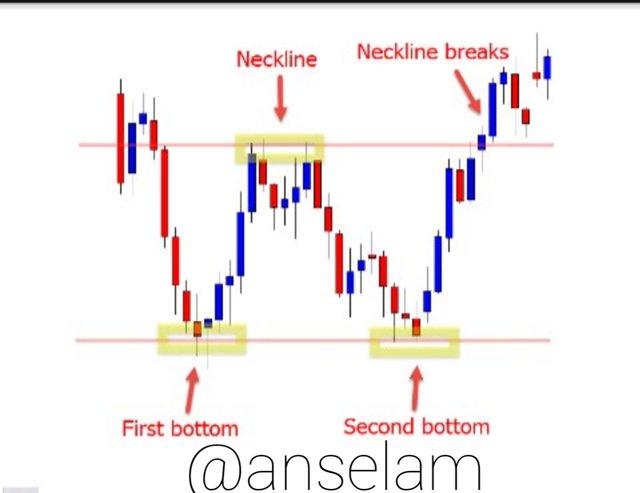
3 - DOUBLE BOTTOM
This is the chart pattern that occurs when a period of selling causes the price of an asset to drop bellow the support level, and then moves up to a resistance point before it takes another downtrend.
Later on when the market becomes more bullish, the trend will most likely take another reversal and proceed on an uptrend.