CRYPTO ACADEMY SEASON 3 - WEEK 2 HOMEWORK POST FOR PROFESSOR @reminiscence01 - TOPIC: THE JAPANESE CANDLESTICK CHART.
Hello great steemit family, I am happy to be a participant of the week 2 lectures by profesor @reminiscence01, here is my homework post.
1 - THE JAPANESE CANDLESTICK CHART
The Japanese candlestick chart is a tool used by traders to do a technical analysis of the movements of the price of an asset. This type of chart makes it clear for a trader to see the price of an asset at different times by the use of objects that look like candlesticks to represent the movement of the price of an asset.
This chart originated from a legendary Japanese rice trader known as Munehisa Homma, but this chart pattern has become very popular in modern day trading due to its efficiency in price forecasting.
HOW THE JAPANESE CANDLESTICK CHART WORKS
The Japanese candlestick chart provides accurate details of the previous and current trend of the price of the item being analysed.
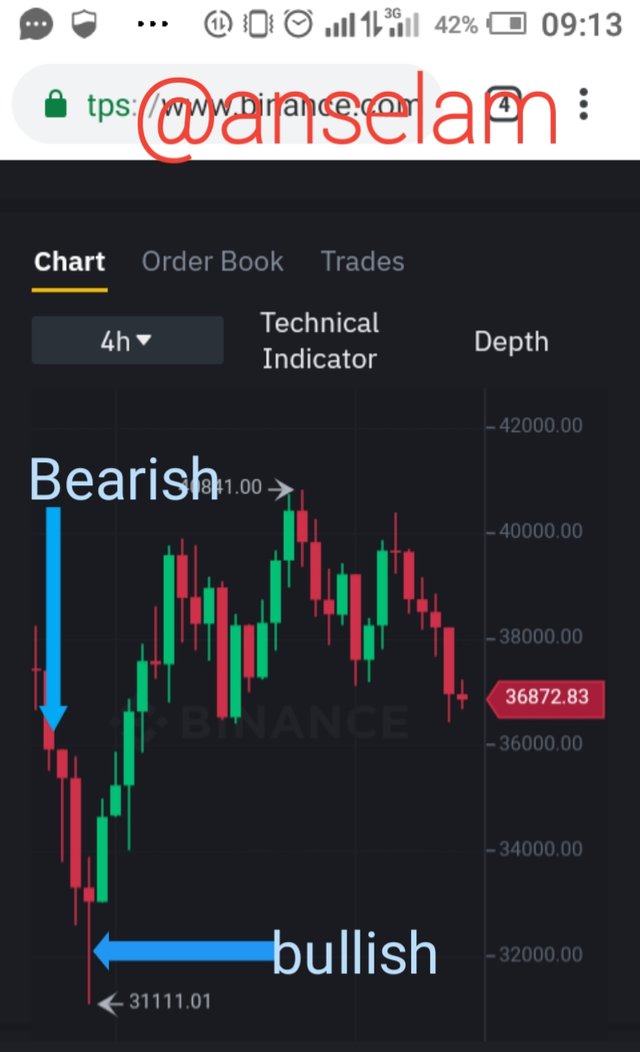
When the price of such asset is going down or decreasing, such movement is represented by red candlesticks. But when the price of that asset is on the rise or increasing, then it is represented by green candlesticks.
The height of the individual candlesticks used in this type of chart depends on the difference between the opening price of the asset and its closing price during a particular trading period. This accurate representation will now enable the analyst to know how a particular asset performed in the market during a particular trading session.
2 - TWO OTHER CHART TYPES
♣ THE LINE CHART
This type of chart uses a single line to represent the movement of the price of an asset. This line either moves up, downor sometimes may tend to remain horizontal depending on the price of that asset at a particular trading session. This is a very simple and basic chart type which is very simple for anybody to understand, but it seemingly only shows the closing price of an asset.
This is not the best type of chart for technical analysers who will definitely be needing more information than what is always provided by a line chart. But for people who just want to know the day-to-day changes in the price of an asset, then the line chart might be very suitable.
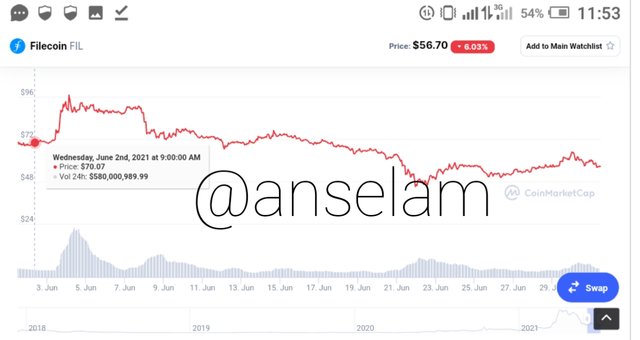
An example of a line chart is the line chart of the price of Filecoin seen in the screenshot above; whenever the price increases, the line makes an upward movement to the location of the new price, when the price drops, it will also go down to the point of the reduced price while it continues to make a horizontal movement to represent the timeframe.
♣ THE BAR CHART
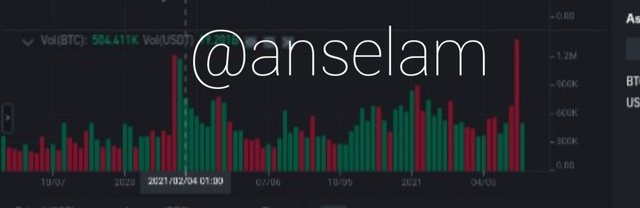
This is the type of chart in which multiple bars are used to represent the price movements of an asset during a trading session. Each bar used in a bar chart is always efficient in showing the opening price, closing price, low price and high price of the asset under analysis.
This type of chart is also effective in monitoring the volatility of an asset.
In this type Of chart, of the closing price of the asset is higher than the opening price, then the bar will be colored black or green. But if the closing price is below the opening price, the bar will be colored red.
The height of each bar depends on the difference in the opening price and closing price of the asset being analysed. A bar could be used to represent the price of the asset for a day in what is called a 1-day bar chart. It can also be used to represent the price of the asset for a week in what is called a weekly bar chart.
WHY THE JAPANESE CANDLESTICK CHART OS WIDELY USED
The Japanese candlestick chart has become very popular due to some of it's characteristics and advantages, here are some of the reasons it has been widely used by traders for technical analysis.
SIMPLE TO UNDERSTAND
Despite the fact that this Japanese candlestick is always very accurate, it is still very simple to understand. Even a person who does not much about the chart can easily use the candlesticks to spot the prices of an asset at a particular time.
Even a newbie can master the pattern of this type of chart because the pattern is very easy to memorize.
WIDE RANGE OF DETAILS
The Japanese candlestick chart is always providing much more details than many other chart patterns like the traditional bar chart and the line chart.
Just with the Japanese candlestick chart alone,you will get to see the opening price of an asset,the closing price,the low price and the high price.
BEST IN MAKING INVESTMENT PLANS
The Japanese candlestick chart gives you a better idea of when to enter your investment and also help you determine you exit point because the candlesticks are always reflecting what the buyers and sellers are doing in the market.
A PROVEN TECHNIQUE
The Japanese candlestick chart has been traced back to the oldern days rice trader known as Homma. He started using this technique since 1700 and up till now, the pattern is still retained because it has proven to be very effective in price monitoring.
Over the years, this technique has been proven to be the best chart pattern and this makes it to remain relevant globally.
THE BULLISH AND BEARISH CANDLESTICKS
THE BULLISH CANDLESTICK
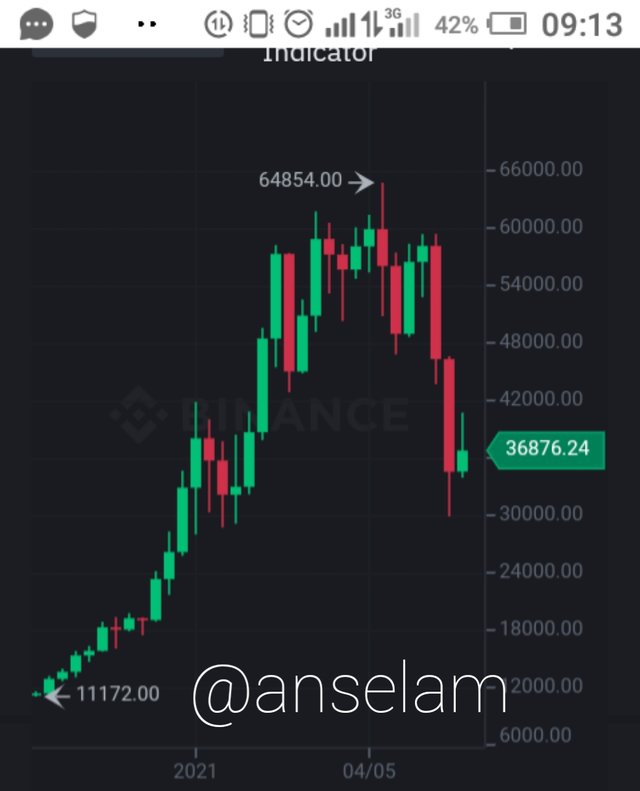
In the screenshot of a Japanese candlestick chart shown above, the bullish candelsticks are the ones colored green and they represent the trading sessions which the closing price of the asset was higher than the opening price.
BULLISH CANDLESTICK ANATOMY
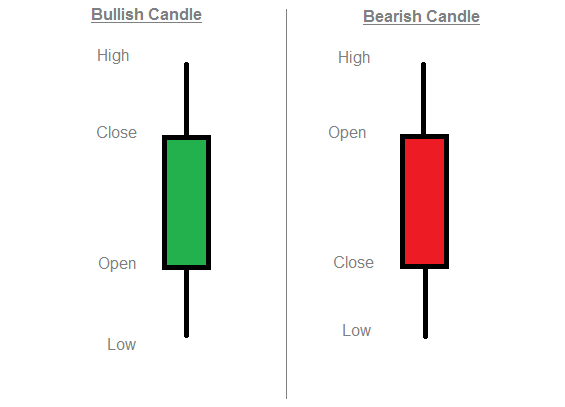
Open: This is always the lowest point of the body of the candle stick as shown in the picture above, it represents the price of the asset at the beginning of that particular trading session, be other a day or a week.
Close: This is the highest point in the body of the candle stick, it shows or indicate the price of the asset at the end of that particular trading session. This price is what determines whether the candle stick is bullish or bearish. For the bullish candelstick, the price must have been higher than the closing price.
High: This is the upper stick or line of the candle, it shows the highest price that the asset was valued during that trading session, this is important because the closing price might not always be the highest price of the asset during the period represented by that candlestick.
Low: This is the line below the body of candle. It does a job similar to that if the "High", but it shows the lowest price of that asset during that particular trading session.
THE BEARISH CANDLESTICK
The bearish candlesticks are colored red in the Japanese candlestick chart represented in the screenshot above. This type of candle is used to represent a trading session when the closing price of the asset during that trading session was lower than the opening price.
BEARISH CANDLESTICK ANATOMY
Open: In the bearish candlestick, the "open" is actually the upper end of the body of the candle, but it is still representing the price of the asset at the start of that trading session.
Close: This is the lower end of the bearish candlestick, it shows the price of the asset at the end of the trading session. For a bearish candlestick, this price is always lower than the opening price.
Low: This particular part of the stick is still doing the same work it does at the bullish candelstick, it shows the lowest price of the asset during that trading session. And it is still the line below the body of the candle.
High: This is still the line above the candle, just like what it did in the bullish candelstick, it still shows the highest price of the asset during that trading session.
CONCLUSION
The Japanese candlestick chart is the most popular technique used in visualising the price of a security over a period of time.
It does not take long before you memorize the pattern used in this type of chart and once you memorize them, you can effectively Forecast the price of an asset.
This is always very necessary before you proceed to enter your investment, analysing an the price of an asset will help you determine the entry point and exit point of your investment.