"[Trading Wedge Pattern] - Crypto Academy / S5W5 - Homework Post for @sachin08".

1.) Explain Wedge Pattern in your own word.
Now let's discuss about what is wedge, wedge is a nasty pattern and the wedge pattern is so good and intersting and this is very good for the traders in future and this pattern is used when the reversal in the market and it tell you when to enter and exit from the market.
Wedge pattern is a pattern which is commonly found in traded asset and it shows pause ongoing in the market trend and here we have a two pattern the first pattern is rising and another one is falling these are buy position or sell position and in this when the breakout traders is tends to take a sell position and the rising wedge is a bearish and in the other when the breakout traders tend to buy position and this is a bullish pattern.
Rising wedge is when the price is rise means when the line of the chart is touches the peak height and the falling wedge is the price price is going downwords means the line of the graph is going down and more information about the rising wedge and the falling wedge I upload a picture below you can more understand by the picture that what is rising wedge and falling wedge.
Rising Wedge
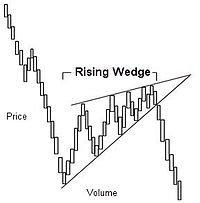
Falling Wedge
.png)
2.) Explain both types of Wedges and How to identify them in detail. (Screenshots required).
Here we have a two types of wedges first is rising wedge and the second is falling now let's know about these two wedges in detail.
Rising wedge
Let's talk about Rising wedge, rising wedge is a bearish pattern. In the common and simple words the meaning of rising is the line which rising upward and touches the peak but here the rising wedge is a technical indicator and in this the reversal pattern frequently seen in bear markets and it form after the merge of the price between both trendlines and you more understand by the screenshot which I uploaded below.
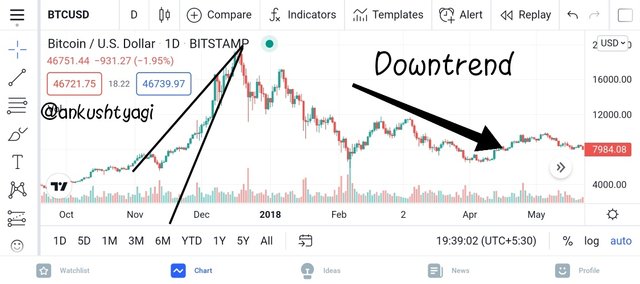
You see the Rising wedge chart pattern in the screenshot and you see in the chart there is two trendline and the line touches 2 to 3 points in the chart on the top and bottom respectively and meaning of this the line touches high and lows on the chart as you can see.
How to Identify Rising Wedge Pattern
• In the first step you have know about the rising wedge pattern in this you have to draw two trendline first at the top of the price and another one at the below of the price.
• Another step is in this the line must touch at 5 points 3 at the top and 2 below and in this the line touches more than 5 but not less then 5.
• In this the volume breakout can be heavy or light but it generally below the average.
Falling wedge
The second wedge is falling wedge and this is a bullish pattern and in the simple and common words the meaning of falling is the line is going below the chart but here the meaning of falling wedge it forms when the market chart is forms market lower lows and lower highs with a contracting range and the falling wedge pattern drawn at the 2 to 3 points and you more understand by the screenshot which I uploaded below.
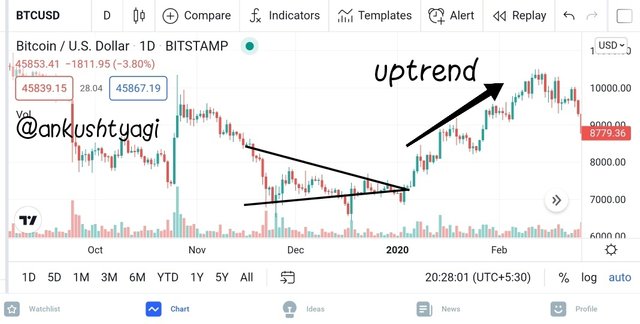
You see the Falling wedge chart pattern in the screenshot and you see there is two line touches the chart pattern at top and below respectively and meaning of this is the line touches high and low on the chart pattern respectively.
How to Identify Falling Wedge Pattern
• In the first step you have know about the rising wedge pattern in this you have to draw two trendline first at the top of the price and another one at the below of the price.
• Another step is in this the line must touch at 5 points 3 at the top and 2 below and in this the line touches more than 5 but not less then 5.
• In this the volume breakout can be heavy or light but it generally below the average.
3.)Do the breakout of these Wedge Patterns produce False Signals sometimes? If yes, then Explain how to filter out these False signals.
Here we talk about false signals, false signals is very dangerous for the traders. When you are trading and you thinking that the price is increasing and then you click for the trade and after the happening is the signals is false then these false signals is disastrous for the traders and these signals indicate entering or exiting in the market at the wrong time and the false signals also seen in other patterns not only in wedge pattern and the wedge pattern also produce false signals.
Now the thing is how to spot trend movement so for this problem Crypto traders make a indicators to spot the trend movement and these indicators help us to find signals that the market is going in loss or in profit and these is very good for all of us and according to me indicator is easy to use.
4.)Show full trade setup using this pattern for both types of Wedges.( Entry Point, Take Profit, Stop Loss, Breakout)
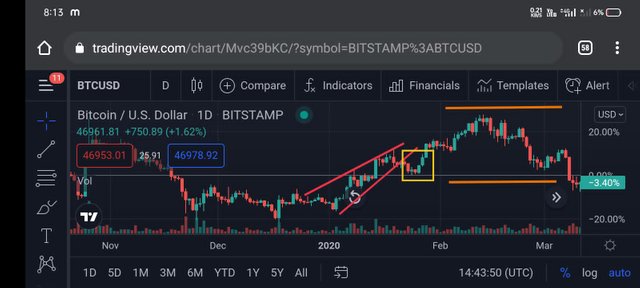
I will be showing two trade Setups here for both rising wedge and falling wedge.
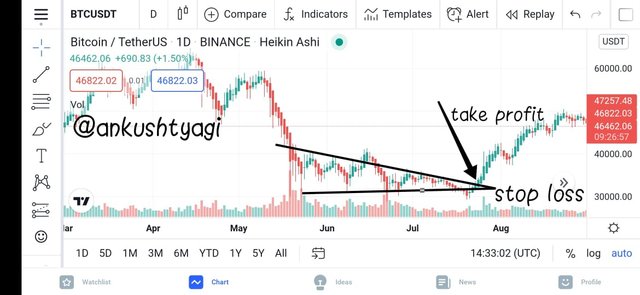
The above image is a trade setup for falling wedge. Here, We can see a falling wedge and ee can take me entry after this breakout and I have marked both take profit level and stop loss level here.
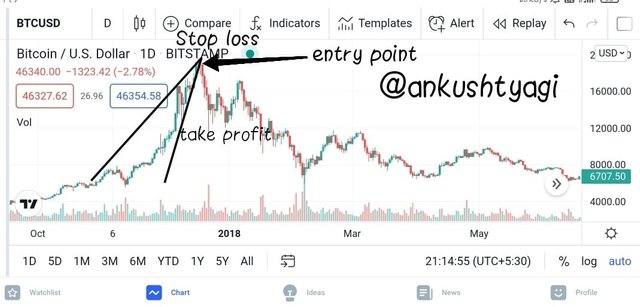
I have provided two trade setups of rising wedge. The above images is a trade setup for rising wedge. Here, We can see a rising wedge and ee can take me entry after this breakout and I have marked both take profit level and stop loss level here.
Conclusion
Thank you professor @sachin08 for this lecture. Today I learnt about wedge pattern and I am glad to answer these questions and I thank you to the professor @sachin08 for this beautiful lesson.