Reading special Bar combinations-Crypto Academy / S5W8 - Homework Post for @sachin08".

1.) Explain Price Bars in your own words. How to add these price bars on Chart with proper screenshots?
We all know that what is price bars, price bars is used by traders, traders use this tool to make prediction they use this to know how the price of an asset is go with in a period of time. The price bars have a information that it helps the traders to make better decision. Price bars is made up of two lines the vertical and the horizontal line.
And you see I mentioned two lines in the previous paragraph the first is vertical and the another one is horizontal and it is so important and we have to horizontal line and it is present on the price chart when taking one candlestick into consideration and these lines are open and close and the price bars is based on the colour.
As you see I motioned the colour the first colour is green and in this colour the open is left hand side on the vertical line close to the bottom of the line and in this we have the low and in the other side the close is opposite to the open means the close is at the right side and the vertical line close to the top of the line and in the we have the high.
Another colour we have red colour and in this colour the open is left hand side on the vertical line close to the top of the line and in this we have the hight and on the other side the close is opposite to the open the close is left hand side on the vertical line close to the bottom of the line and in this we have the low.
As I mentioned these open and close chart bars this helps traders to help them to make a good decision and be able to trade correctly and they always be in profit If they make good decisions and they always be in profit and this information helps traders that when to enter or exit.
How to add these price bars on Chart with proper screenshots?
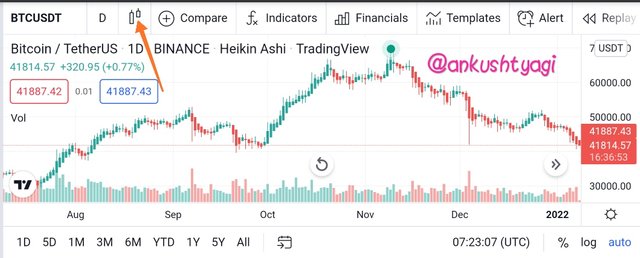
• First you need to click on the website that is mentioned website and after clicking on the link you directly go to the tradingview page.
• In the next step you click on the candlestick logo.
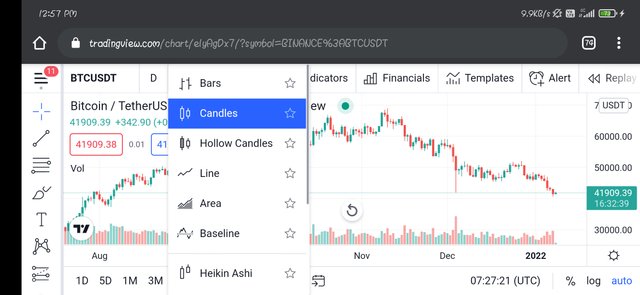
• After that so many options come front of you.
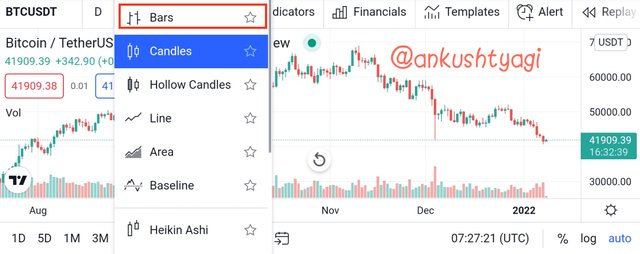
• After so many options coming front of you but you select a bar option.
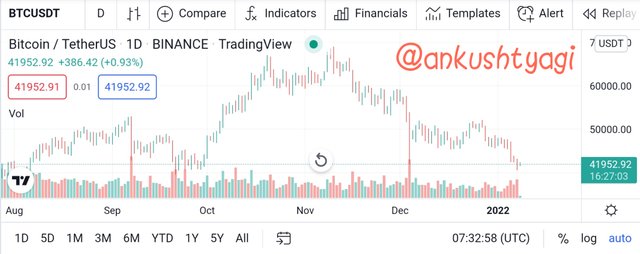
• After clicking on the bar option you see a chart how looking now.
• Open - This is the term that in this where the price is start.
• Close - This is a term in this where the price is end.
• Low - Low it is a bottom of the vertical line termed as low.
• High - High is the top of the vertical line is termed as high.
2.)Explain the Bar Combinations for Spending the Day inside for both conditions. (Screenshots required)
To identify the trend using price bars these case are similar where we use candlestick. If you want to perform well then you must have good knowledge about it now we identify uptrend and downtred.
Uptrend Identification
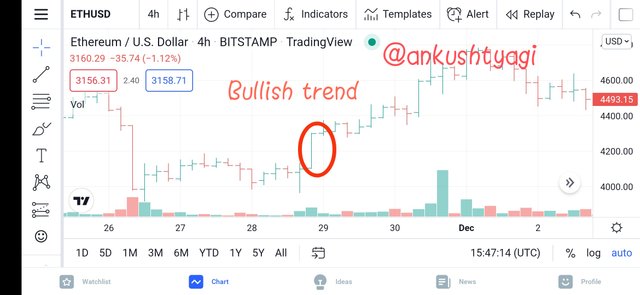
There are several identification of uptrend the first identification is it is a series of higher highs together with higher lows and meaning of this is the price of the next price is high than high and respectively for the low and then in the uptrend in the starting of the trend it make sure that the close point of the price bar and in this it is higher than the close point of the previous bar.
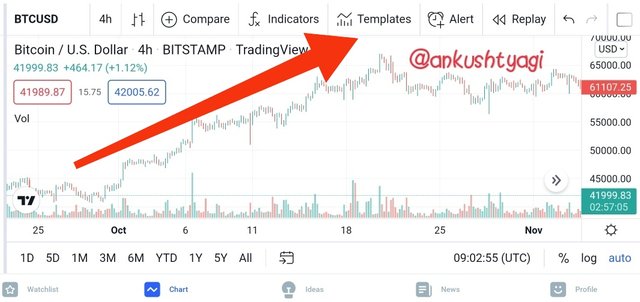
And from the screenshot you see a higher highs together with higher lows and you also see the colour of green and the green colour is an clear indication of an upward trend and this is a bullish trend. Traders buy assets at this point.
Downtrend Identification
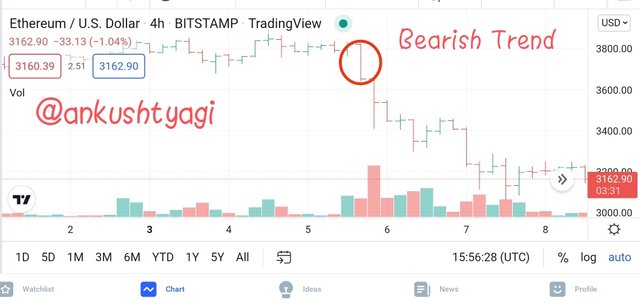
This is a indentification of downtrend In this the price bar this is a series of lower highs with lower lows and the rate of the price is higher high and higher low so then this is a situation of the downtrend.
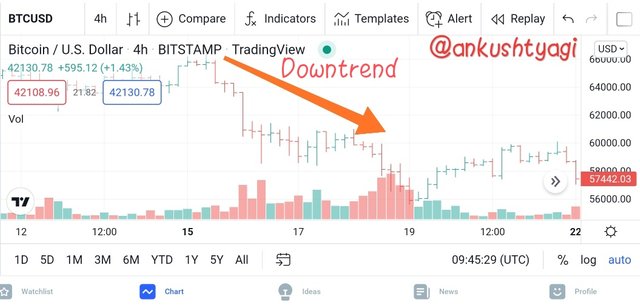
And from the screenshot you see a series a bar of the making a lower highs with the lower lows and here the colour is red and the red colour show a clear indication of the trend is downtrend and the this is a bearish trend and this is a point where traders sell their assets.
3.)Explain the Bar Combinations for Spending the Day inside for both conditions. (Screenshots required)
In this question their are two cases for spending the day inside.
• The high must have been higher than the previous days' high.
• The low must have been higher than the previous day's low.
This can be seen in both bullish or bearish trend.
Spending the day inside (Bullish Trend)
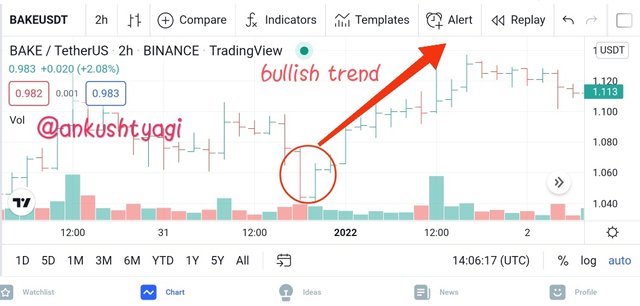
Spending the day inside bullish trend in this the open is close to the previous price bar and here in this the close is up but below the high of the price.
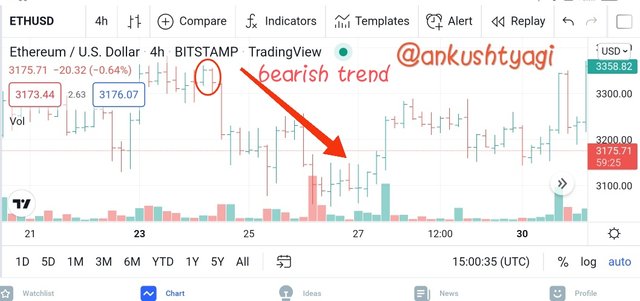
Spending the day inside (Bearish Trend)
4.)Explain the Bar Combinations for Getting outside for the Day for both conditions. (Screenshots required)
The bar combination for getting outside for the day and it is a Trend reversal and continuation signal and you have noticed that the open and close bar is coming outside the day and also the low and the high.
For Bullish
In this you see bullish trend and you also noticed that the it is open from the low and the close is at the high and in this the close is higher then the privious price bar of the previous high.
For Bearish
In this you see bearish trend and you also noticed that the it is open from the high and the close is at the low and in this the close is lower then the privious price bar of the previous low.
5.)Explain the Bar Combinations for Finding the close at the open for both conditions in each trend. (Screenshots required)
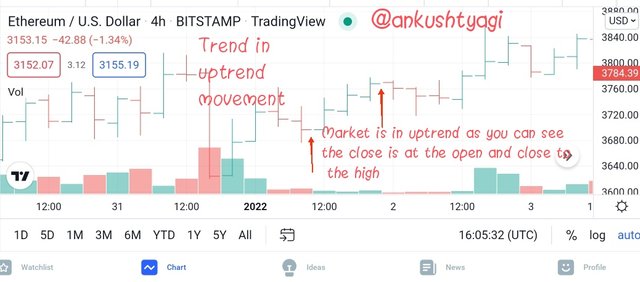
For Uptrend
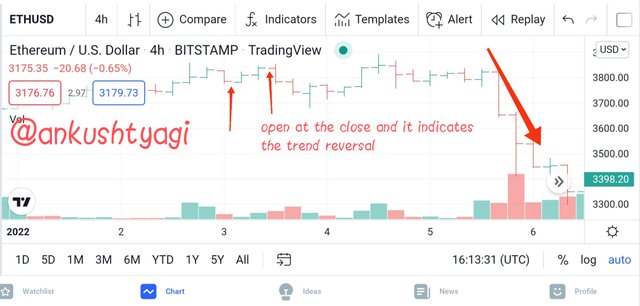
For Downtrend
Conclusion
Today I learnt about price bar I glad to answer these questions thank you professor @Sachin08 for this wonderful lesson.