Crypto Academy / S5W4 - Homework Post for @sachin08".

1.)EXPLAIN RECTANGLE PATTERN IN YOUR OWN WORD.
We know rectangle from our school days in maths and I know the maths is not easy I mean math is not easy for me but in this the meaning of rectangle is according to my understandings Rectangle pattern is a technical analysis it occurs when the price is moving between horizontal support.
In the simple and common words the rectangle pattern through ways on the chart first is top is termed as termed as rectangle top and the second is bottom is termed as rectangle bottom and with the help of these two things the traders is able to predict which trend take place the exit pattern from the chart pattern is called breakout.
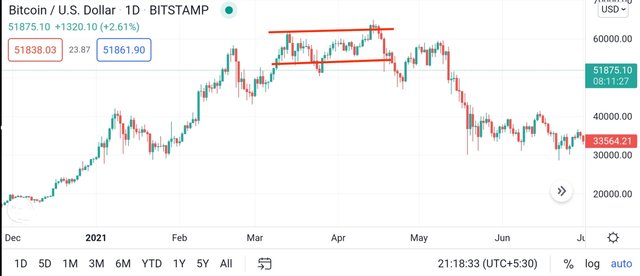
You see two things in the chart first is you see the top trendline is known as top rectangle and the another one is bottom trendline is known as bottom trendline and you see in the chart the red line it touches the graph two times on the top and in the bottom the line touches the graph 3 times and you see on the chart price on the trending downward.
2.) How to identify Rectangles. Explain with Screenshots.
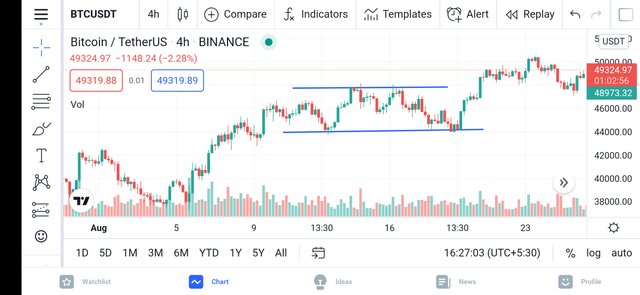
According to me this is a simple and easy pattern and it is a continuity pattern and it is a more excellenter to work from a previous trend Bull or bearish In this the price which is a powerful movement before generating the pattern and there are two horizontal lines and in this the price is bounce a flat support zone at the bottom side and at the top side is flat resistance.
You can more understand the rectangle pattern by these image which I uploaded below and these images helps you to understand and you see a rectangle pattern in uptrend and downtrend.
3.)Can we use indicators with this pattern to get accurate results? Explain with Screenshots.
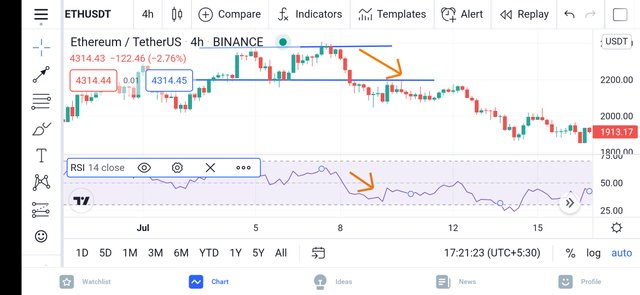
Yes offcourse you can use indicators but trading with one indicator is a bad idea according to me trading is well and here is need a flaw and here the area is not visible and this make trading fail but the indicators is not 100 percent correct I means in the all over the world there is nothing that is 100 percent and you better understand by the chart which is uploaded below here I use RSI indicator RSI Stands for Relative Strength index and this is a momentum indicator and it is used in the technical analysis and RSI is displayed as a oscillator meaning of this is a line in the graph that moves in the two extreme and RSI indicator have a reading from 0 to 100.
4.)EXPLAIN RECTANGLE TOPS AND RECTANGLE BOTTOMS IN YOUR OWN WORDS WITH SCREENSHOTS OF BOTH PATTERNS
In this the rectangle pattern is the chart is formed at the bottom of the chart and at the top of thechart and more about this I can answer below.
Rectangle Top
In the simple and common words the rectangle top is occure on the top of the chart and in this when the rectangle pattern is formed on the top of the chart then after a ranging market and then this shows traders that the market is a bearish and rectangle pattern is a continuation pattern and this forms as a trading range during a pause in the trend and the rectangle top is formed after the bullish movement in the price of an asset You can better understand by the image which I uploaded below.
Rectangle Bottom
It is bit of different from the rectangle top because rectangle top formed after a bullish movement and this after a bearish movement of price of an asset and in the simple and common words rectangle bottom formed below on the chart it is a simple and easy definition of rectangle bottom.
5.)Show full trade setup using this pattern for both trends. ( Entry Point, Take Profit, Stop Loss, Breakout)
In this question I will showing you my Entry Point, Take Profit, Stop Loss, Breakout below.
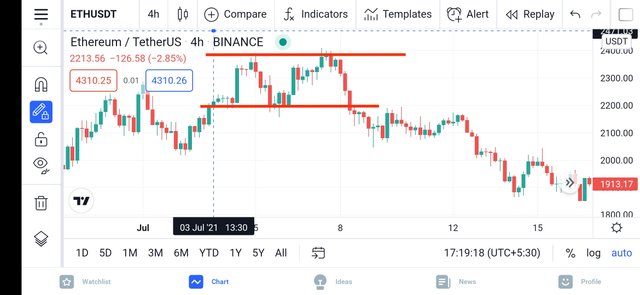
Rectangle Top

In the above chart above is ETHUSDT and the price is formed at the rectangle top chart and you see the price up and down and the resistance line and their you see the breakout at 2200.00 and after this the market trading down and take profit is at the middle of 2200.00 and 2100.00 and after this Stop loss is at the 2400.00.
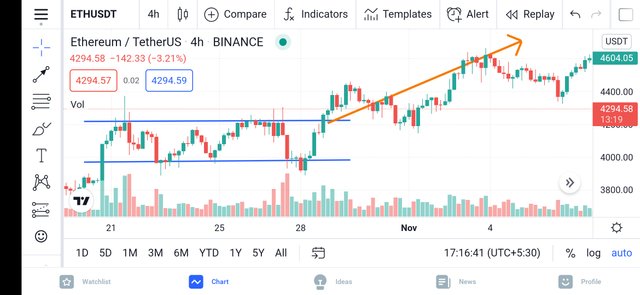
Rectangle Bottom
In the rectangle bottom here I can use a ETHUSDT and the price is formed at the rectangle bottom and this chart the take profit level is at the 4604.05 and this is the profit level and the stop loss is at the 4000.00 and this is the stop loss and the breakout is at the below of the 4294.58.
Conclusion
Today I learnt about rectangle pattern and rectangle top and rectangle bottom and I am glad to answer these questions and I thank you to the professor @sachin08 for this beautiful lesson.