Steemit Crypto Academy Season 3 Beginners' course – Homework for Week 2: Introduction to Charts for Professor @reminiscence01 by @aniksikder
HOMEWORK BEGINNER'S COURSE WEEK 2 (Introduction to Charts)
CRYPTO PROFESSOR: @reminiscence01
INTRODUCTION
Hello Professor sir @reminiscence01, thank you for this great and educative lecture. I am happy to see this well structured system and today in this post I will share with you my homework Season 3 beginners' course Week 2 - Introduction to Charts. I arrive with week 2 of the beginners course. I hope the next one is a comfortable read for you and thanks to teacher @reminiscence01 for class.
QUESTIONS
Explain the Japanese Candlestick Chart? (Chart screenshot required)
Describe any other two types of charts? (Screenshot required)
In your own words, explain why the Japanese Candlestick chart is mostly used by traders.
Describe a bullish candle and a bearish candle identifying its anatomy? (Screenshot is required)

Question 1- Explain the Japanese Candlestick Chart? (Chart screenshot required)
Source
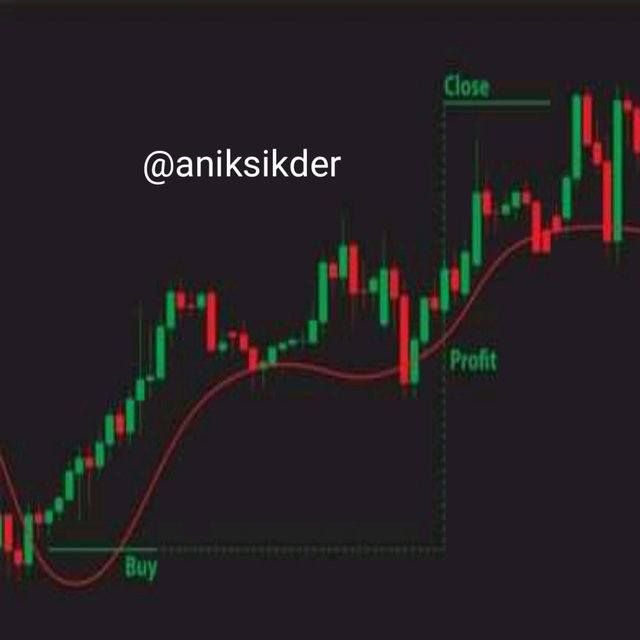
Japanese candlestick technical tools that can be used by various traders here to chart the price movements of securities and are easy to use by analyzing. So I believe it all the time. Japanese candles are made when the price of an asset opens and closes within a certain period of time. The shades of these candles then indicate the following. They appear when the value of a property is discounted or less than the opening or closing price. To better explain this: say a candle opens at a price higher than the closing price, we call it “bearish”. When the opposite happens, it is called "bullish". The exchange usually has more buyers during bearish building and bullish building. So if a starting price is higher than the closing price, a bearish candle is created on the chart.
Source
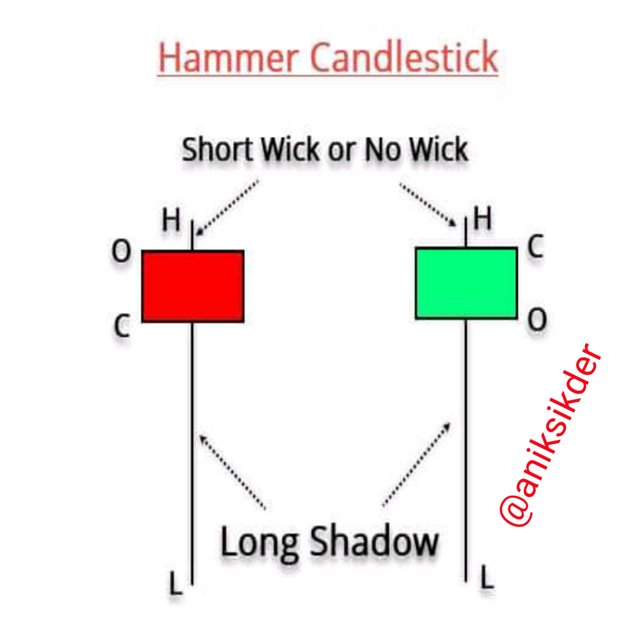
Keep in mind that there are candle models that show contrasts and sometimes they are defined or they just speak in a continuum of trends. This is really interesting, so let me show you how the "Hammer" model looks. Here you will see a short candlestick body and long downward shadows. The candle appeared at the support level and it informed us that the asset exchange has an upward reversal. All I usually do is break the handle to wait for the next candle to break.
Question 2- Describe any other two types of charts? (Screenshot required)
There are other two types of charts. Please see below.
- Flow chart
- Funnel chart
Flow chart
Source
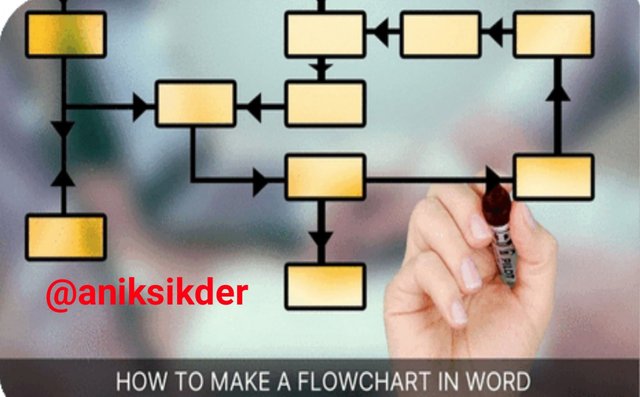
Flow chart help us decide on steps or reviews from start to finish and can get challenging to understand the various processes. Here you can see what process you can direct from start to finish and people use flowcharts in different difficult situations. Also if you have to use a flowchart you will not need a professional. You can make it like this without the help of others. A flowchart is a chart that gives life to a dead image. So know well how to create a flowchart and can include a legend to explain the meaning of each size.
Funnel chart
Source
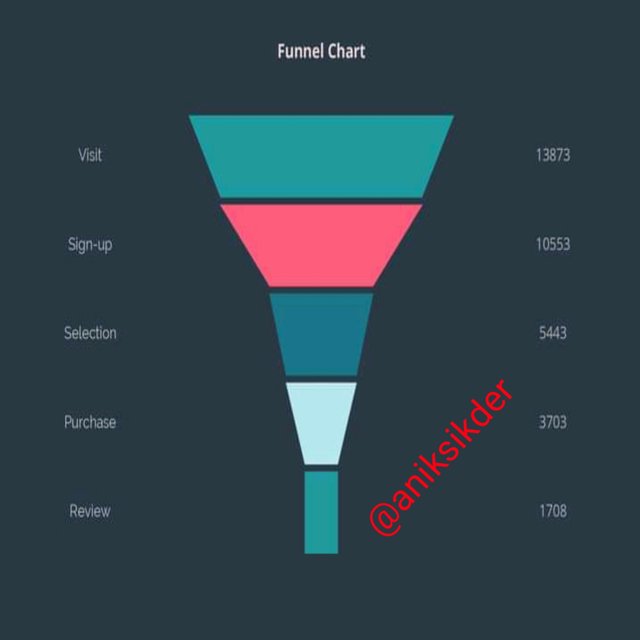
The funnel chart is where you progress through different levels. There are different widths at different tops and narrow in different ways. This chart makes it easy to show users for business or sales processes. Funnel charts are a very common use here because traders can cancel orders and display delivered so it can be used very easily. As we can see from this chart was in clicking on the promotion link. On the other hand, while the other was on the other side most users followed different ways to do it so that they are easier to use for different directions. Here we see as an example a special feature of Funnel Four is to portray responses in different ways related to product offerings.
Question 3- In your own words, explain why the Japanese Candlestick chart is mostly used by traders.
Here candle chart have become used among various trader because technical analysts are the most popular way here. Here if we look at each candle we can see the distance of each candle price. If we analyze technically then the popular way Japanese candlestick analysts focus on determining different heights. Japanese candlestick are very easy to explain for information and traders can easily predict the market. In today’s world a huge number of traders are displaying Japanese candlestick and this is what they have technically identified in different way.
The Japanese candlestick instructions are very simple because it is very easy to identify the candles that the user together and the traders choose this candle chart because they feel comfortable because there is no reason to be confused here. So the most used of the values in the future market is identified as technology. The most interesting thing is that traders can easily compare the past and present prices here so that they can easily see the market price and forecast picture with the help of these candles and technically traders always take advantage of Japanese candlestick.
Question 4- Describe a bullish candle and a bearish candle identifying its anatomy? (Screenshot is required)
There are other two types of candle. Please see below.
- Bullish Candle
- Bearish Candle
Bullish Candle
Here Screenshot link
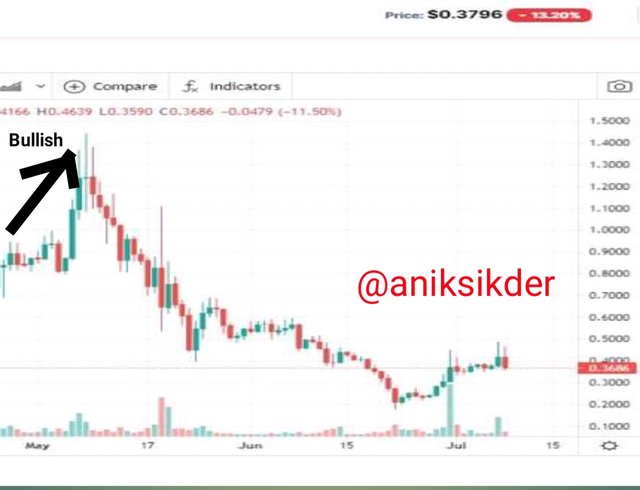
Bullish candle is a green candle that represent speed and variety. At present merchants can present it for pricing online. Bullish traders have a great deal of confidence in investors. Bullish easily informs candle traders what price are going to be updated in the market and makes it easy for them in various ways. Because after warning them, if they remove the price, they may increase the prices again in the future.
Source
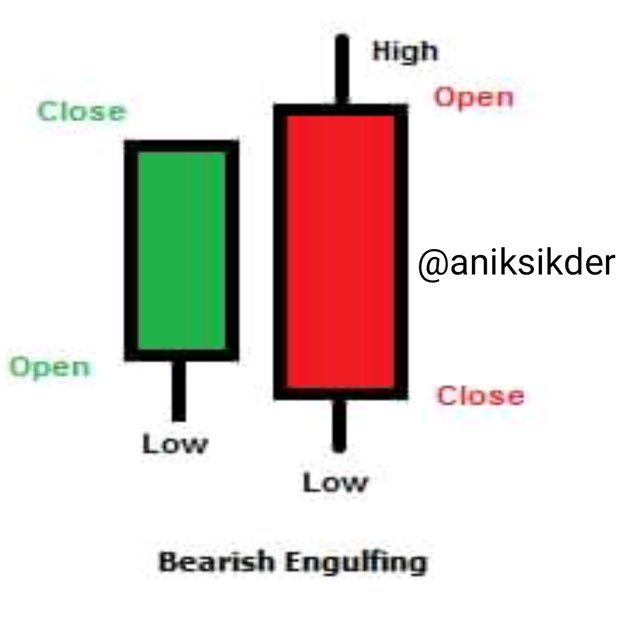
Bearish Candle
Here Screenshot link
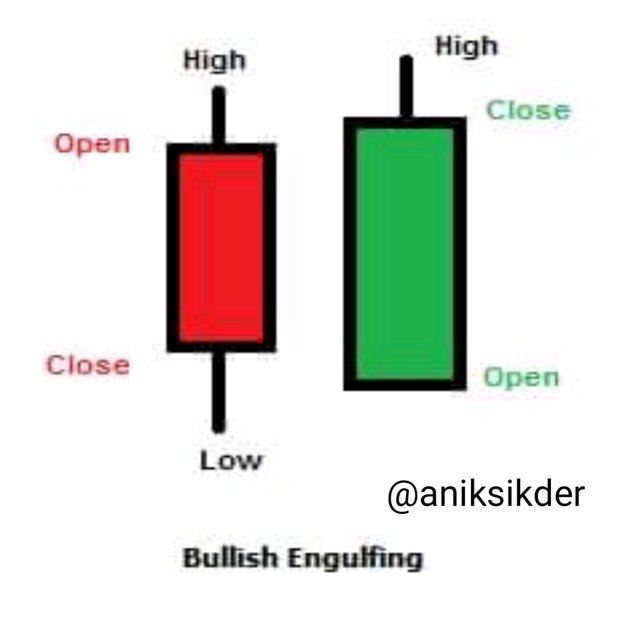
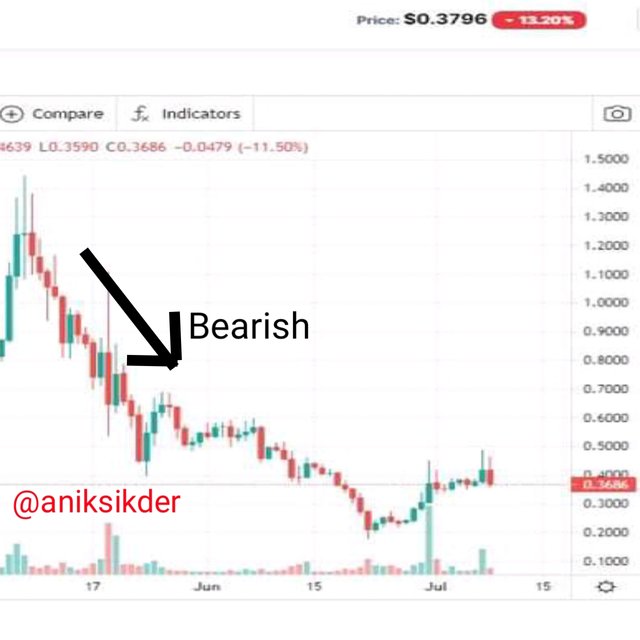
If we look through the bearish chart, we can see the price decline online at different times and here we also see the price decline of candles. Here we can easily see that when the editor drops the price and the online price fluctuates in different markets, it is seen that the traders who have cryptocurrency online fluctuate different prices then they can easily understand it and appear at the top in an uptrend. Here are the things that can be seen through the bearish chart. Open, Close, High, Low.
Source
CONCLUSION
This is the end of my Homework post for session 3 week 2. Thank you so much Professor @reminiscence01 for giving us this knowledge. I believe that all newcomers like me can achieve a lot by trying this post. These site are actually for traders who use cryptocurrency for various purposes and one of the most important aspects for them is business. Those who have traders here can easily understand the price fluctuation in the market and make it easy to chart through various means. There are a variety of charting tools out there that are the most used and they are able to communicate very easily and accurately. This chart is very useful for new traders to understand the speed at which the business is going and the price is fluctuating. This chart we can study as trading about which we will be much more confident.

Regards:
@reminiscence01
Written by
Hello @aniksikder , I’m glad you participated in the 2nd week of the Beginner’s class at the Steemit Crypto Academy. Your grades in this task are as follows:
Observation
This is not correct. When a candle closes at a price higher than the opening price, it is called bullish. Similarly, when a candle closes at a price lower than the open, it is called Bearish candle.
Recommendation / Feedback:
Please spend time to perform your homework task. There were so many confusions and ambiguity in your explanations. Thank you for submitting your homework task.
Thanks dear professor for your feedback. Inshaallah next class I will be more focused.
Here My Twitter Link