Steemit Crypto Academy | Season 3: Week 7 || How to create an account on TradingView, how to use indicators,tools, features of tradingview by @amritraj
Hey everyone Hope you all are good and doing well. Today I go through the lecture of @yousafharoonkhan about trading view. I found it really interesting and learned alot now i am sharing my assignment.

Question no 1:
Defining the TradingView site and how to register an account in tradingview? what are the different registration plan?(screenshot necessary)?
Answer no 1:
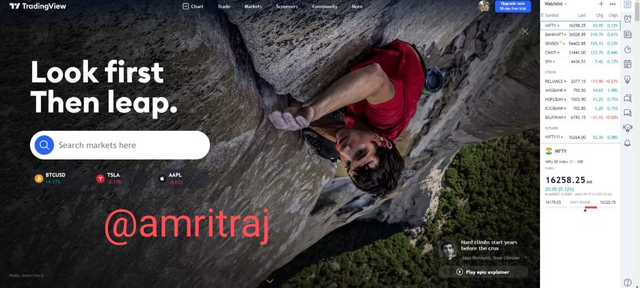
TradingView https://in.tradingview.com/ is a website on which we can track many charts of different cryptocurrencies, Forex and gold. Where you can easily access the price of many assests and can make a trade. By using different indicators and features of the app. It is a social network composed of 30 million traders and investors who use the world's best charts and analysis tools to discover global market opportunities. Use us to follow your favorite assets, find trading ideas, chat with others, discover trends, and trade directly on our charts.
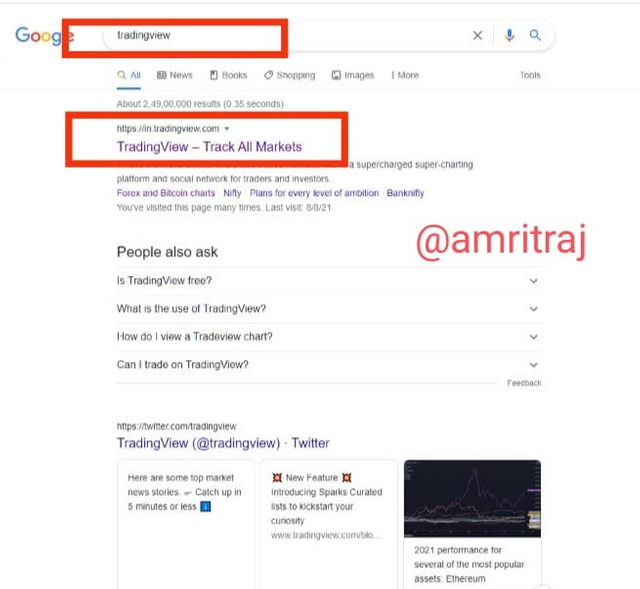
Step 1
Visit on https://in.tradingview.com/ Search on google tradingview and click on the first search result.
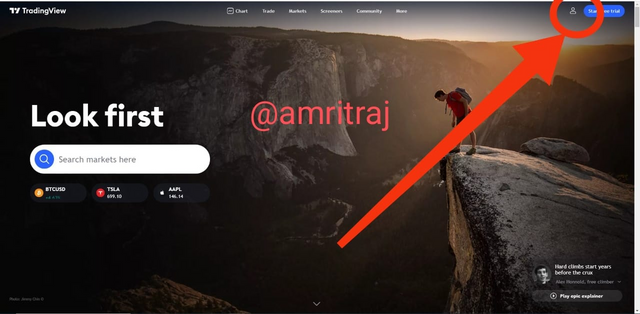
Step 2
Click on the profile icon on top corner of the screen for signup your account.
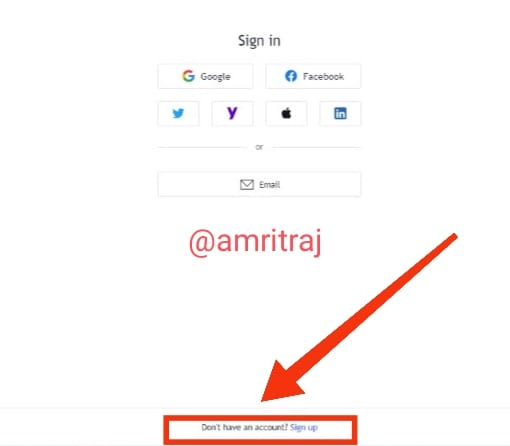
Step 3
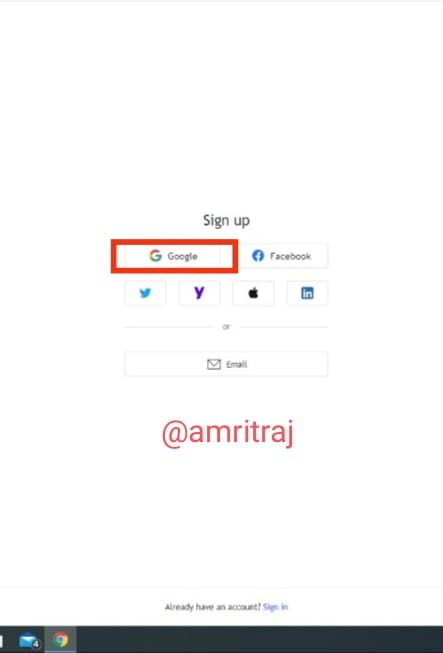
If you have your account then sign in and if you don't have then click on sign up and create new account.
Step 4
There are many ways to sign up from many ways but i am signing it up with google.
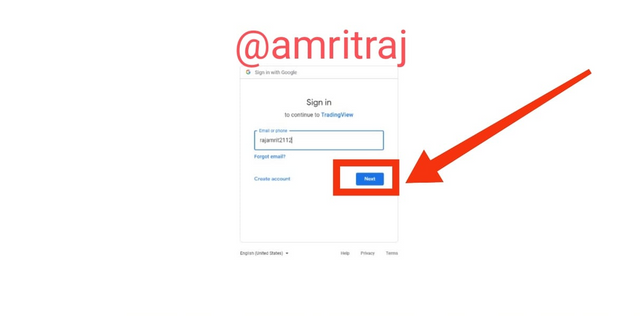
Step 5
Type your email id and press next.
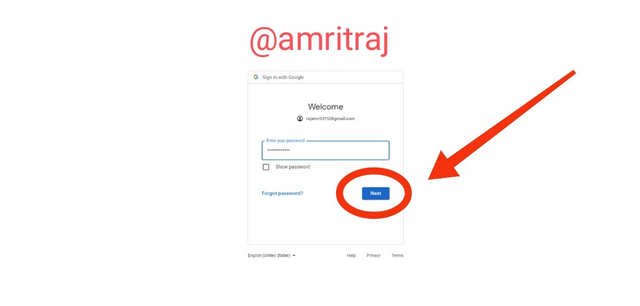
Step 6
Then enter the password of your mail and click next.
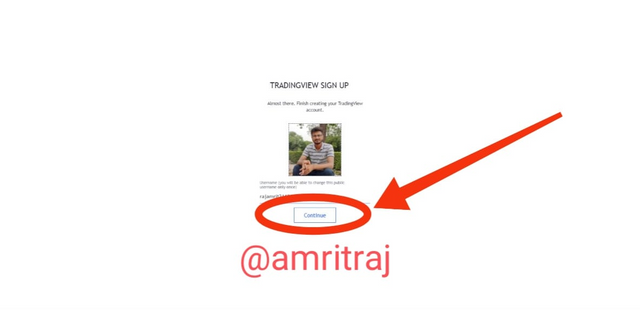
Step 7
Choose a profile photo for your account and the name according to your email will come accordingly & click on continue.
Step 8
Here, our account is created and now we can explore the features and crypto's & make a trade.
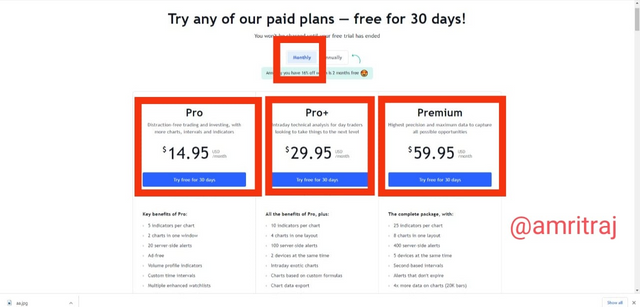
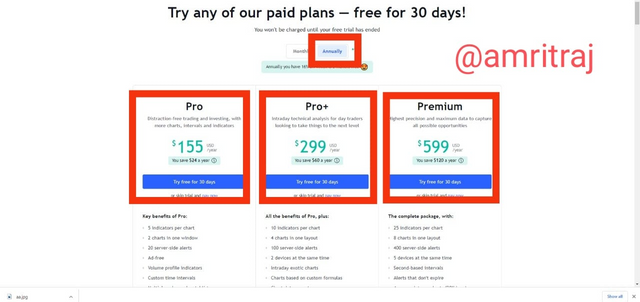
There are 2 different plans Monthly plan & Annual plan in which also categories are divided as follows:
Monthly plans
Monthly Pro Plan - $14.95
Monthly Pro+ Plan - $29.95
Monthly Premium Plan - $59.95
Annual plans
Annual Pro Plan - $155
Annual Pro+ Plan - $299
Annual Premium Plan - $599
Question no 2:
Explain the different features of tradingView and what is your favorite feature and why?(screenshot necessary)?
Answer no 2:
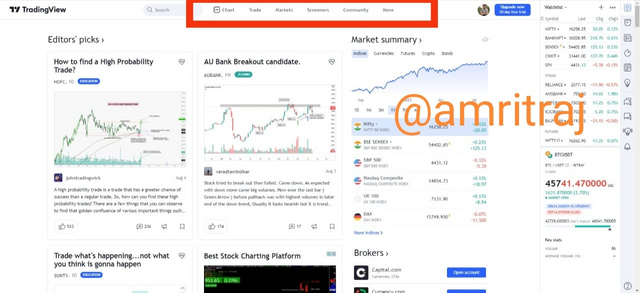
There are many features on tradingview which are really helpful for us to make a trade ib this website. Some of the features are Chart, Trade, Market, Screeners, Community and More lets find them all in detail.
Chart
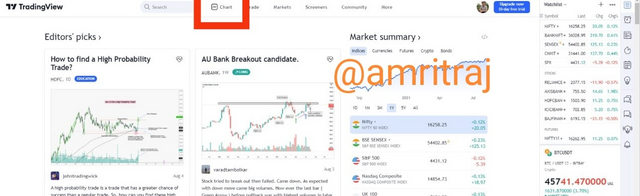
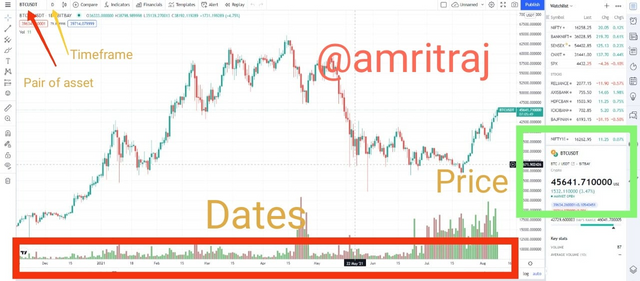
Chart is very much helpful in trading we can see previous prices of any days on our set timeframe and current price also of the asset. On top corner we can choose our desired currency pair , We can set a particular timeframe. And many other options like indicators with which our trade become more accurate and tool box to enhance the skills etc.
Trade
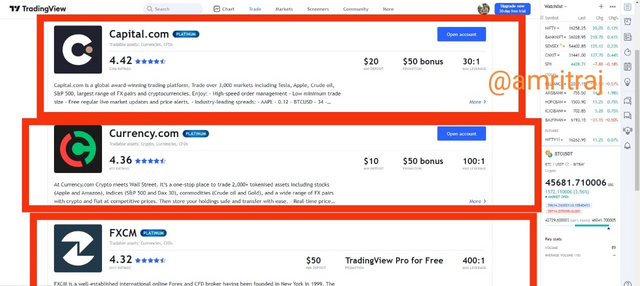
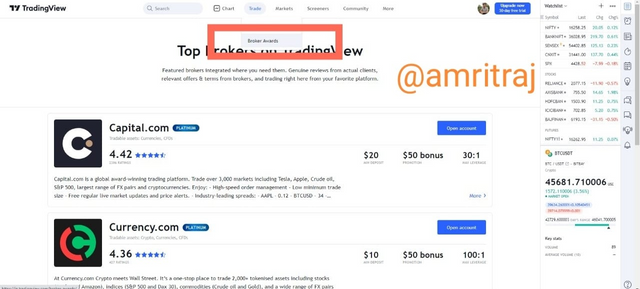
Trades > Top Brokers
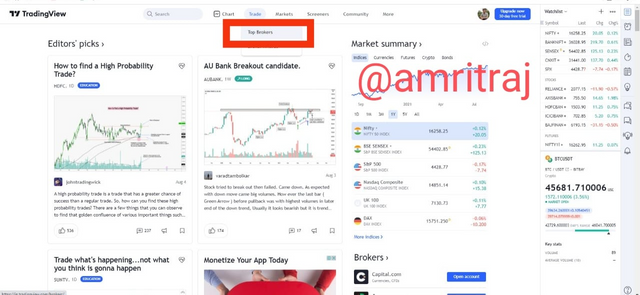
Here we can see the top brokers of the field like Capital.com , Currency.com, FXCM which can guide us which platform is good for trade the desired asset.
Trades > Brokers Award
This option will show the Brokers who are on top and awards associated with them.
Market
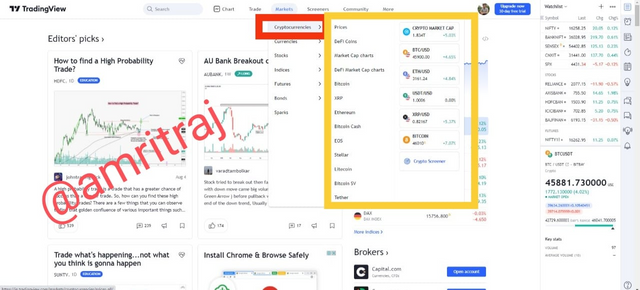
Market > Cryptocurrencies
Here we can directly see the market price and the predictions here of coins at what price we can sell it out & at what price so it can tell us all the basic things about a coin.
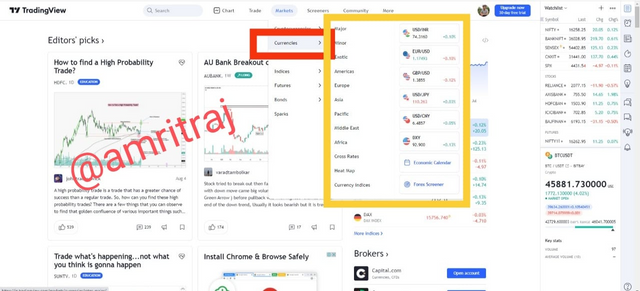
Market > Currencies
Currencies in this option you can see the option of currency of different regions like American, Pacific, Asia, Middle east, Africa etc.
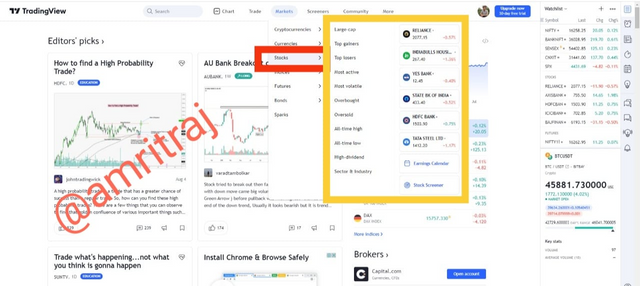
Market > Stocks
Here we can see the assets which are making profits and also loss as top gainer and top looser. Which asset is overbought by more people and which is more sold out oversold by people. All time high and all time low assets and many more.
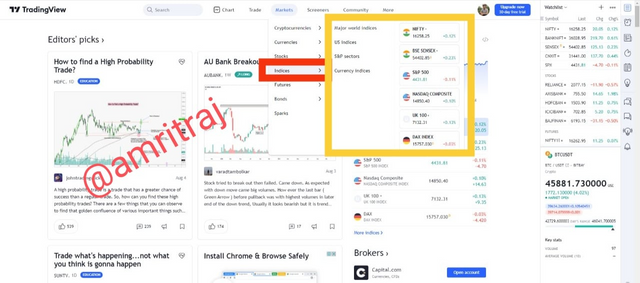
Market > Indices
An index is an indicator that measures the price evolution of a group of stocks on an exchange. For example, the FTSE 100 Index tracks the 100 largest companies on the London Stock Exchange. The trading index allows you to contact the entire economy or industry at a time, and only need to open a position. So, here we have Major world indices, US indices, S & P sectors, Currency indices.
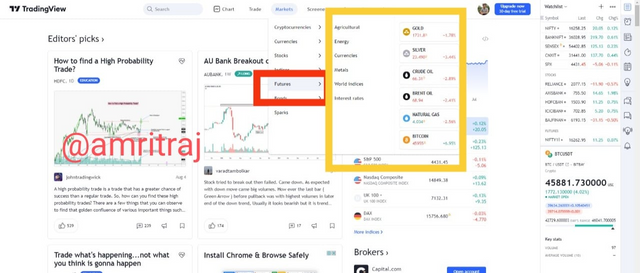
Market > Futures
This panel will show the future of the asset related to Agriculture, Energy, Metal and the interest rates. In future will the asset of this particular that particular asset will show profit or loss which help us in trade to earn profit.
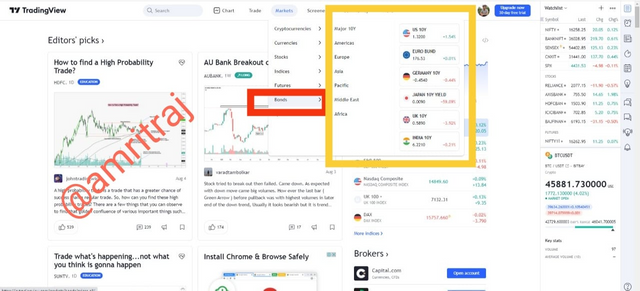
Market > Bonds
Bond trading may be a thanks to take advantage of fluctuations within the value of corporate or government bonds. Many people consider it an important part of a diversified business portfolio, just like stocks and cash. The
bond is a financial instrument that allows people to borrow money from institutions such as governments or companies. The agency will pay a certain interest rate on the investment over the life of the bond and then return the original amount at the end of the loan period. In this panel we have, Major 10Y, Americas, Europe, Asia, Pacific many bonds.
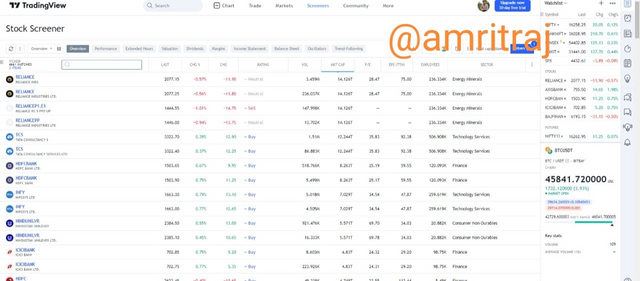
Screeners
Screeners > Stock screeners
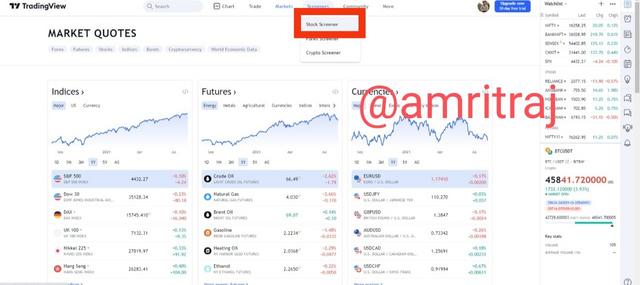
A stock appraiser may be a set of tools that permits investors to quickly screen an oversized number of accessible stocks and increase exchange-traded funds supported their own criteria. Stock evaluators are usually available on brokerage trading platforms (usually free), but there also are some independent subscription-based stock filters available. Stock filters allow investors to use their own methods to work out the worth of stocks or ETFs (long-term traders) or discover potential trading opportunities (short-term traders).
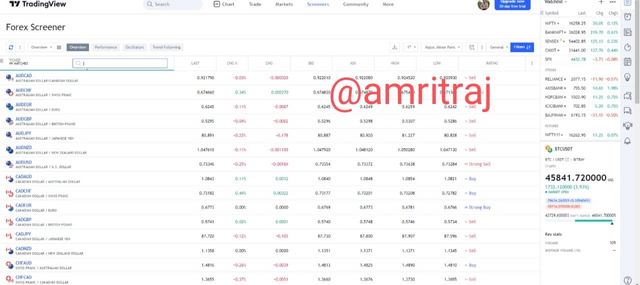
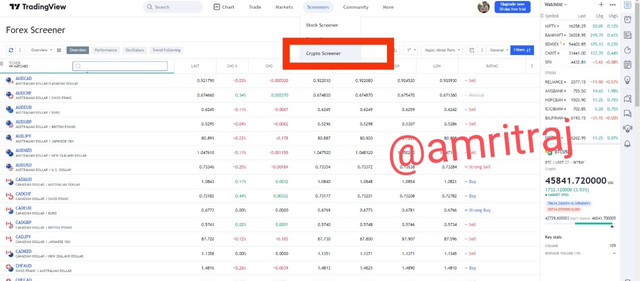
Screeners > FOREX screeners
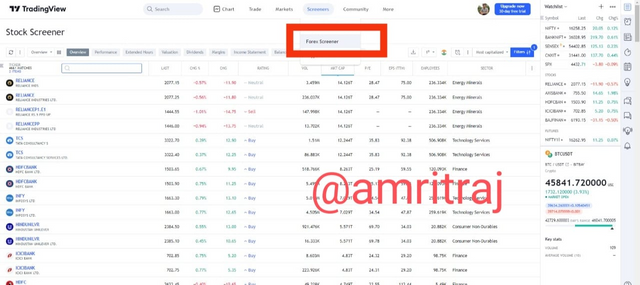
It basically search all the forex market on the parameters you set of your desire to earn profit. It will take out all the list of that forex asset.
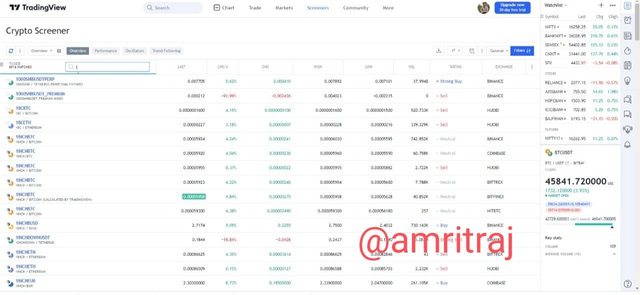
Screeners > CRYPTO screeners
A cryptocurrency screener could be a specialized tool which will facilitate your sort through investment opportunities within the crypto sphere. once you use a crypto screener, you'll set specific parameters that you will use to narrow down and type through investments. Some samples of categories you will want to look by including Price.
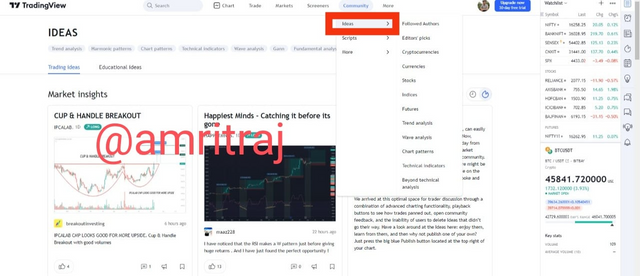
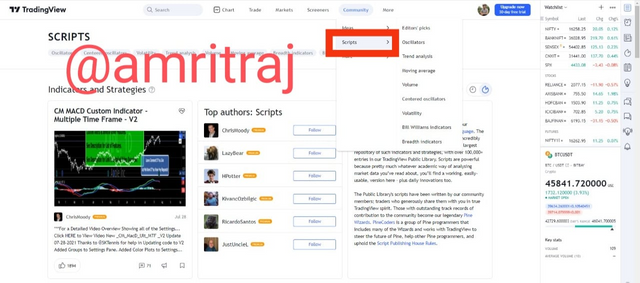
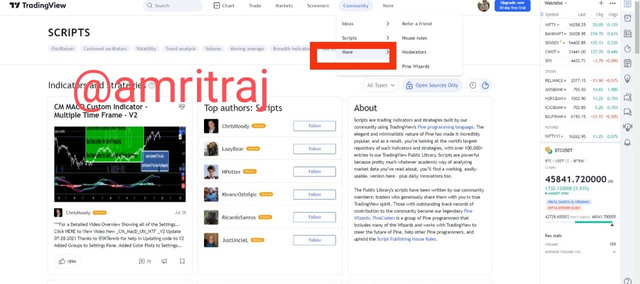
Community
Community will show us idea to trade scripts of good asset which contain all prices bounces of the market. And more options like rules of the website and refer a friend. Here we can see many expert traders and very wise opinions.
My favourite feature
Among all the features i like the feature of screeners because in this we have a particular choice list in front of us of our desire parameters which can make the work easy for us and it prevent the confusion. Lot of work can be save through this feature. Even there are separate screeners for Forex, Crypto & Stock so this make it more clear to mark parameters also. A trader can take the call quickly and can save very much time and also make profit for short term trade.
Question no 3:
How to set up a chart in TradingView and use two tools to edit it.(screenshot necessary)?
Answer no 3:
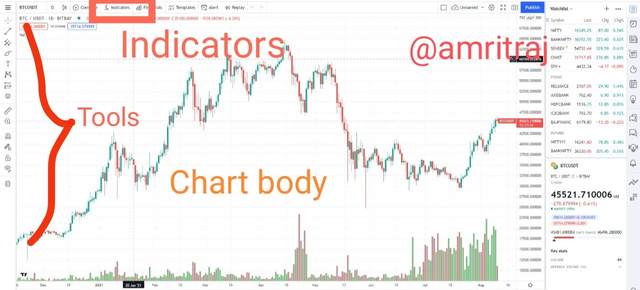
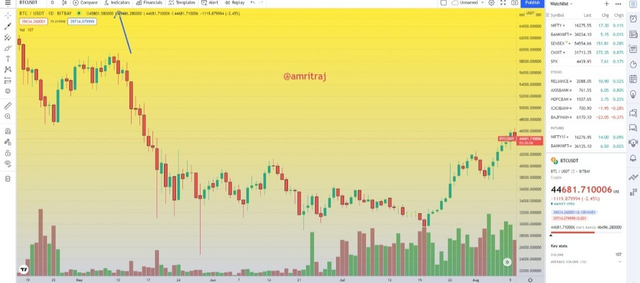
From the above features we get to know about the features of tradingview we know how to go on chart option by the same process we will open a chart of cryptocurrency BTCUSD. Here we can see Chart body where all the graph is visible in choosen timeframe from the date you want. Then there are indicators which can help us in trade in a better way and have more profit. Tools which enhance the graph in our way of understanding.
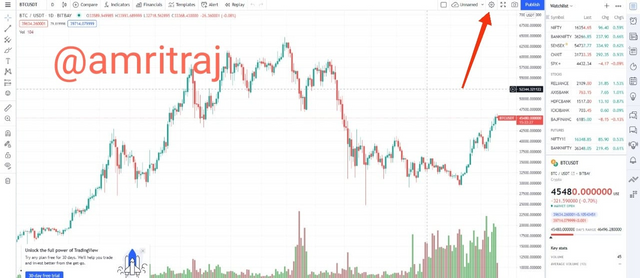
Setting of chart
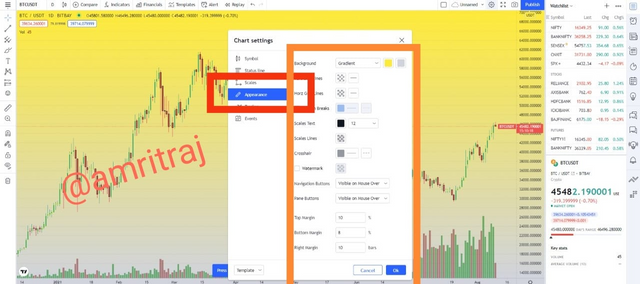
Click on the setting option on above top corner from here you can design modify your chart which can easily visible to you with clear differences.
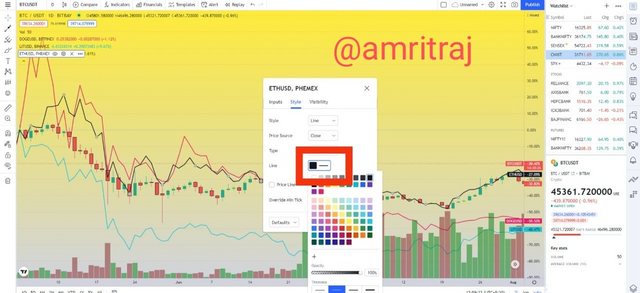
Now I am changing the colors of candles from the symbol option and also applied border to the candles. Then press ok.
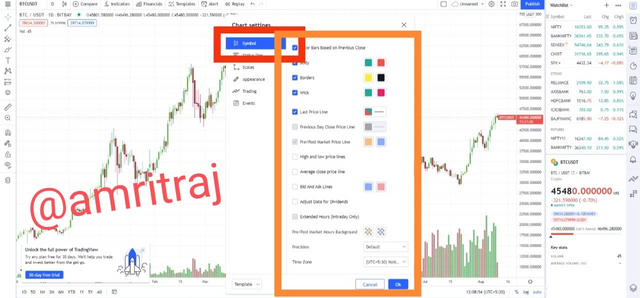
Now in appearances mode we can change the background color and scale the symbols and many more here i have changed the background color and press ok.
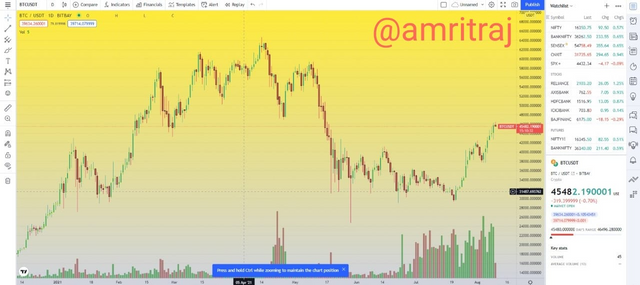
Here, the final look of our graph it looks totally different from above chart and more clear.
Adding tool to chart
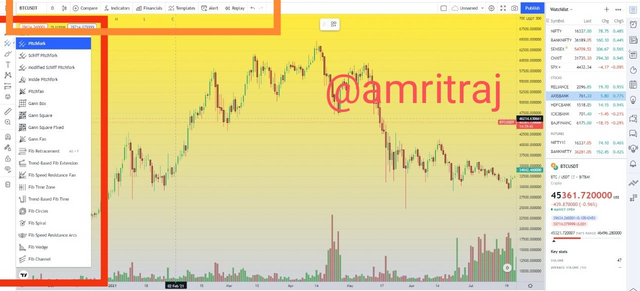
TOOLBAR
In toolbar option we can find many options like editing tools ,trend tools , Frock tool and many more main important tools like indicator, compare which can help us alot to make profitable trades.
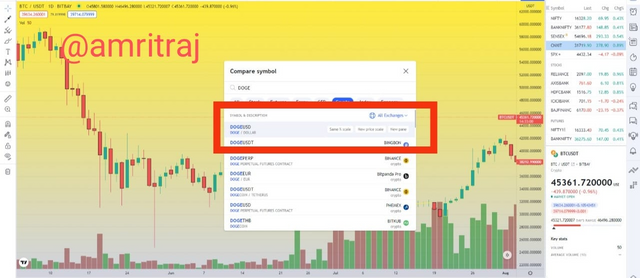
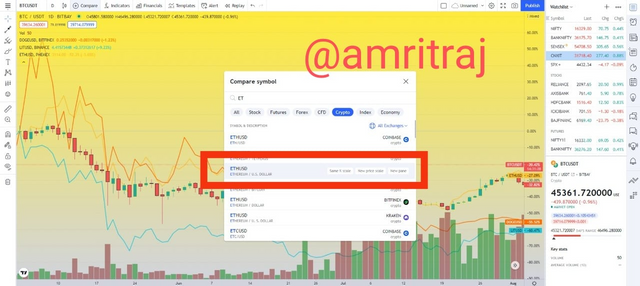
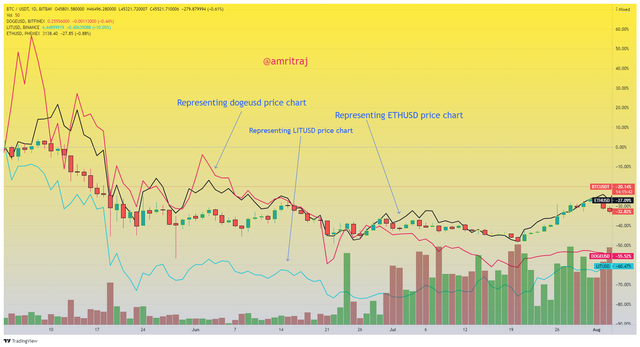
Adding Comparing tool
I am using comparing tool to the chart which can help us in comparing as many as asset we want to compare and get to the result.
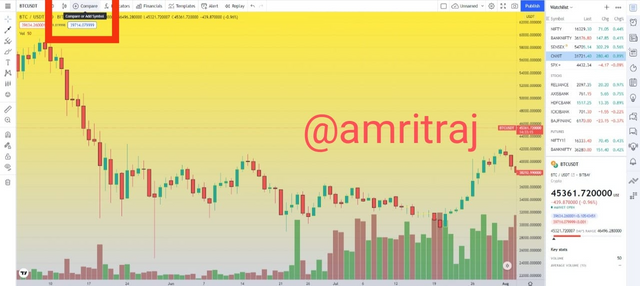
I choose comparing tool to distinguish between DOGEUSD, LITUSD, ETHUSD firstly i select doge then lit then eth and set different colors of the line of each coin price chart.
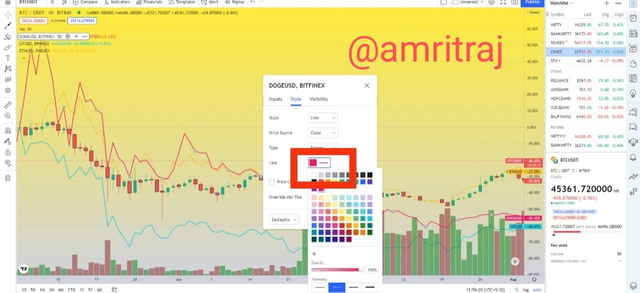
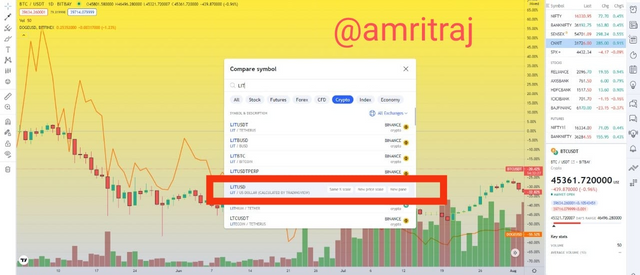
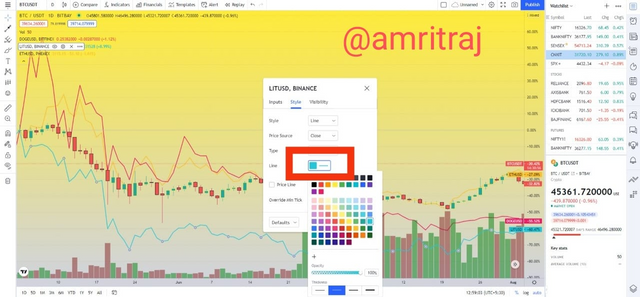
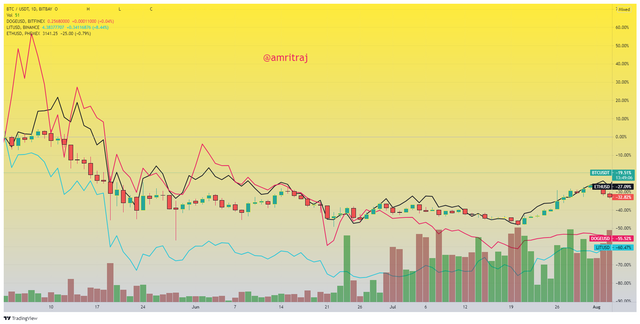
After applying Compare tool on the chart it look very fine and clearly comparing the price of three of them which is easily accessible.
Adding Arrow and text tool
Now i am editing the chart of three comparison with Arrow and text tool. Which can help us to define the thing clearly as we can point towards the symbol we want and define them on the graph through text. Form side bar we will choose arrow tool and text tool and apply them.
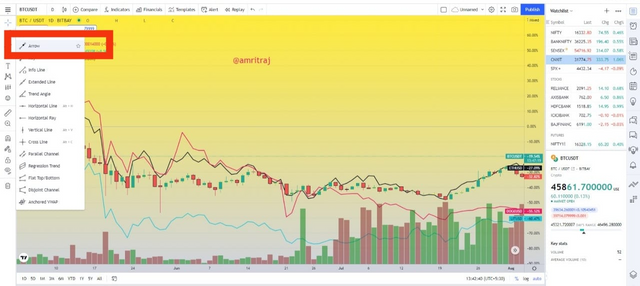
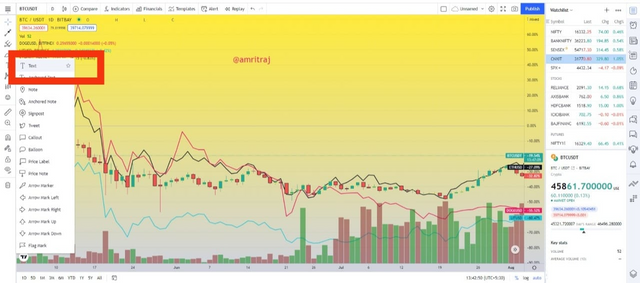
After applying the text and arrow symbol and define the lines the chart looks like.
Question no 4:
Explain how to add indicator in chart, what is your your favorite indicator and why? (screenshot necessary)?
Answer no 4:
The best indicator i like to use always is RSI it show us the overbought and oversold conditions of particular asset also measure the price of asset growing speed. So a trader can work in this very easily like when they see overbought situation they always sold same in oversold they buy and earn profit. This indicator makes really clear and good condition.
Step 1
Go on Tradingview website and select the currency then click on the indicator(fx) on the top.
Step 2
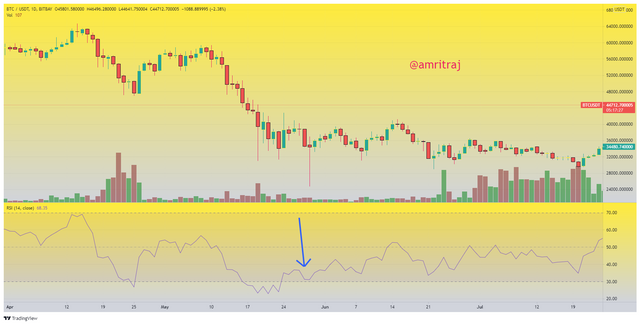
Search RSI and select RSI from the panel of indicators.
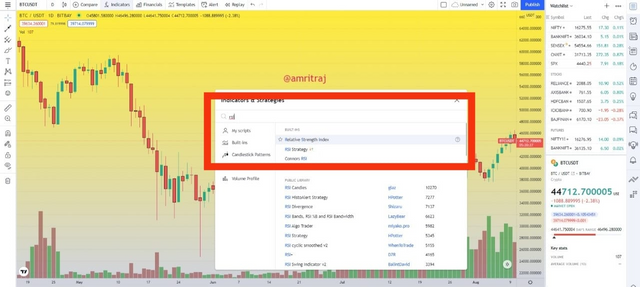
RSI is applied to the chart of BTCUSDT.
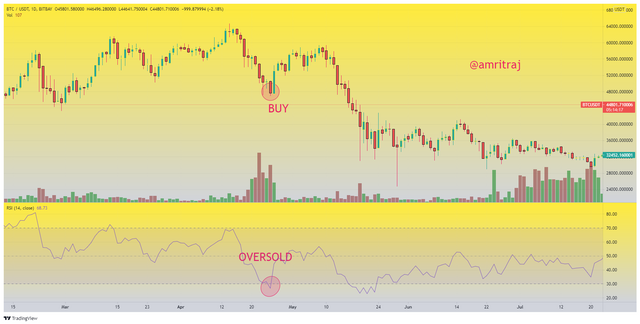
BUYING or OVERSOLD
At this point the currency is oversold and the market price is down so its perfect time for traders to buy the currency.
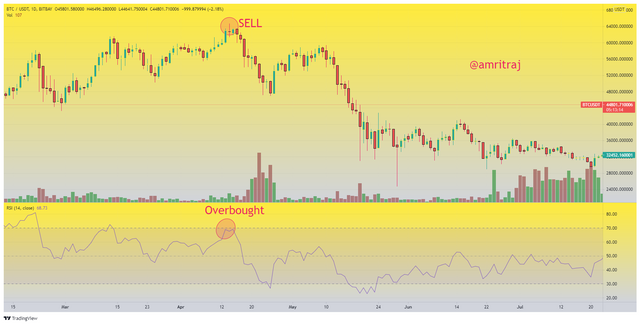
SELLING or OVERBOUGHT
At this point the currency is overboughtand the market price is down so its perfect time for traders tosell the currency and earn the profit.
This is how we can apply RSI and use it.
Question no 5:
Do you think TradingView is useful in predicting the market for a cryptocurrency (trend/price)?
Answer no 5:
Tradingview is extremely useful for predicting trends and costs within the cryptocurrency market, especially when using indicators. Tradingview provides real-time data within the correct order and form. All data is updated in step with the chosen time range directly because of the supply of the many time periods, you'll be able to view different types of price charts for various time periods. due to this, we are able to clearly understand the market trends. As we know, many exchanges are linked on the trade view and offer different prices at different time levels. Therefore, because of the comparison function provided within the trade view, we are able to put the costs from the identical price chart on different exchanges together. compared, this can provide clearer pricing information on the market. because of the editing tools available on the left side of the trade view, we are able to make our chart more creative by adding annotation line price markers and different points, which can help us clarify the encrypted price chart . Many people are now using the business view, and that we are using the business view in steemit's job posting to form creative price charts. Therefore, it's very useful for cryptocurrencies, and therefore the predictions made through it are superb and simple to understand.
Conclusion
In this lecture we learned alot about the tradingview app where we have 30+ traders available. We learnt alot about how to register how to use tools set indicators chart body features of tradingview and much more. So, this lecture is really helpful to us thank you @yousafharoonkhan to teach us so well thank you.
Respected first thank you very much for taking interest in SteemitCryptoAcademy
Season 3 | intermediate course class week 7
thank you very much for taking interest in this class
Thank you professor @yousafharoonkhan