Steemit Crypto Academy | Season 2: week 7 - The Swing trading style by@amritraj
Hey everyone, I hope you all are doing good. So, I am enjoying my days in cryptoAcademy lot to learn and enjoying lectures are there. Which add more value to the content of steemit. So, today I go through the lecture of professor @yohan2on about Swing trading styles.
Here after lot of reserch and reading the lecture of professor i have completed my assignment. Have a look.
HOMEWORK
ANSWER
Swing Trading is basically short-term period trading. In this trading there is very less chance of loss. In swing trading you have to hold your holding more than one day. The holding period is depend upon the market trend. In this there is low risk. It is usually monthly based trading. By swing trading you can earn a good profit upto 10-15℅.
Swing Trading is based on Technical and Fundamental analysis. The market always move in zig-zag manner. When it keeps going on upward then we can say the market is in uptrend and when it keeps going downward then it is in downtrend. Here, experience traders analyse the trend and make profit. They know when to take entry and exit. For the beginners swing trading can be a good way for trading because it has a low-risk factor and there are some technical indicators like candle sticks, support and resistance, multiple time framing, volume, graphs which can help them wisely.
I) LINE GRAPH Line graph is a graph which show us relation between a pair of asset through X axis and Y axis. Which compares the currency on X- axis to currency of Y-axis. Through lines.
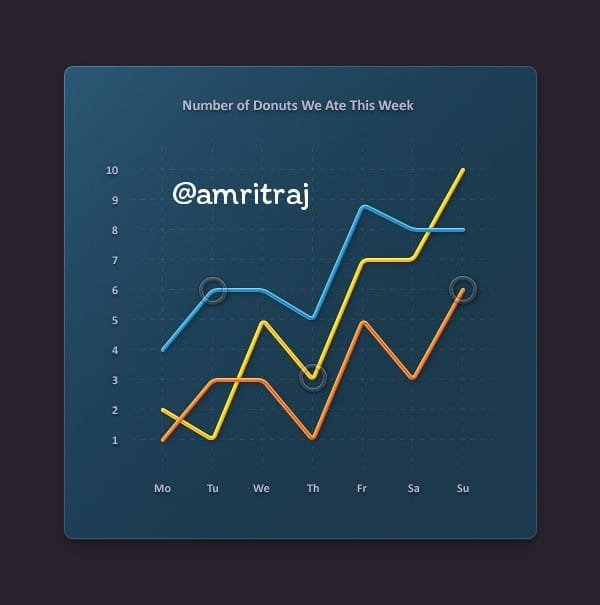 Source https://images.app.goo.gl/XsvkKh8UFKrVNB1d8
II) BAR GRAPH Bar graph is a graph which show us relation between a pair of asset through X axis and Y axis. Which compares the currency on X- axis to currency of Y-axis. Through vertical box .
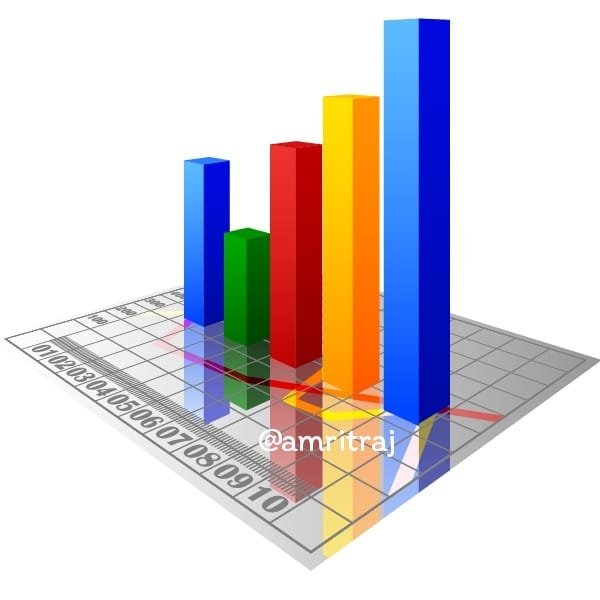
https://images.app.goo.gl/ZdhCw44BdJTDo1dv6
III) CANDLESTICKS GRAPH Candlesticks graph is a graph which show us relation between a pair of asset through X axis and Y axis. Which compares the currency on X- axis to currency of Y-axis. Through vertical box in intervals of time.
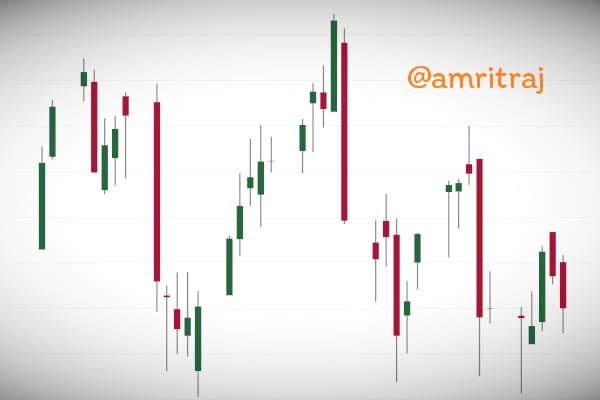
https://images.app.goo.gl/yQM4tHNbJDxkLKgz6
| ADVANTAGES | DISADVANTAGES |
|---|---|
| TIME INVESTMENT IS VERY LESS | ANALYSING IS DIFFICULT |
| MONEY CANNOT INVESTED FOR LONG TERM | NEED LOT OF TIME TO ANALYSE |
| IT WILL GIVE YOU HUGE MARGIN PROFITS | IF YOU TRADE IN HIGH TIMEFRAME LOSSING PROBABLITY INCREASES |
| YOU CAN DO IT ANYTIME | PROFIT IS LESS THAN THAT OF INTRADAY |
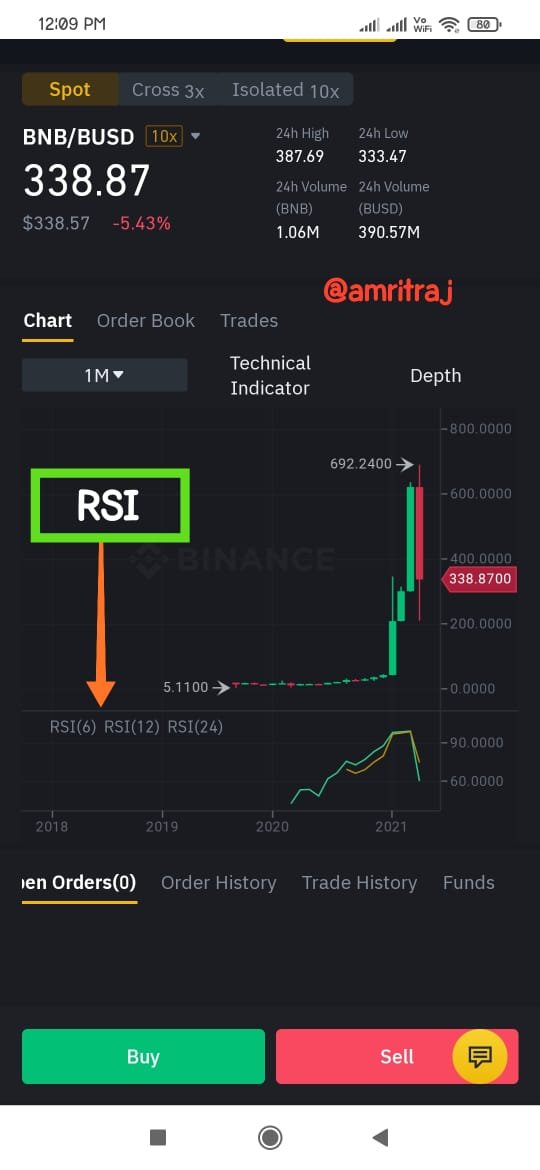
In trading book it is a technical indicator which show us variation in price and let make us recogonize the price of asset We can mark rsi while we enter in market and start analysing. It show us the value from 0-100. When you see RSI is below 30mline you can buy trade and sell it when it is above 70 its perfect when you sell RSI at that time.
For trading first rule is to enter at the correct time in the market. So while I enter always analyse 1 hour market trend downtrend or uptrend and set one of indicator like RSI when i started the trading and Start we should always go with the trend of the market. if trend id downwards then put trend towards 3-4 times. Check the price while entering the market.
We gonna select a pair like i am selecting BNB/BUSD we will se that graphs at varies times and analyse the market deeply.
Multiple time framing is very important while doing trading. Basically multiple time framing is to analyse market in many time frames like we can analyse it in Minutes, Hours, Weekly & Hourly. When we jump into the trading market we should always read the previous trends and according to them with the help of RSI we should place the trade so it will be more accurate and will give you more profits.
I) MINUTE TRADING in this we will gonna analyse the trades in USD/BUSD for 15 minutes and according to the trend of last 15 minutes uptrend or downtrend will put the trade. Here
II) HOUR TRADING in this we will gonna analyse the trades in USD/BUSD for an hour and according to the trend of last 1 hour uptrend or downtrend will put the trade.
III) WEEEKLY TRADING in this we will gonna analyse the trades in USD/BUSD for 1 week and according to the trend of last week uptrend or downtrend will put the trade.
IV) MONTHLY TRADING in this we will gonna analyse the trades in USD/BUSD for 1 month and according to the trend of last month uptrend or downtrend will put the trade.
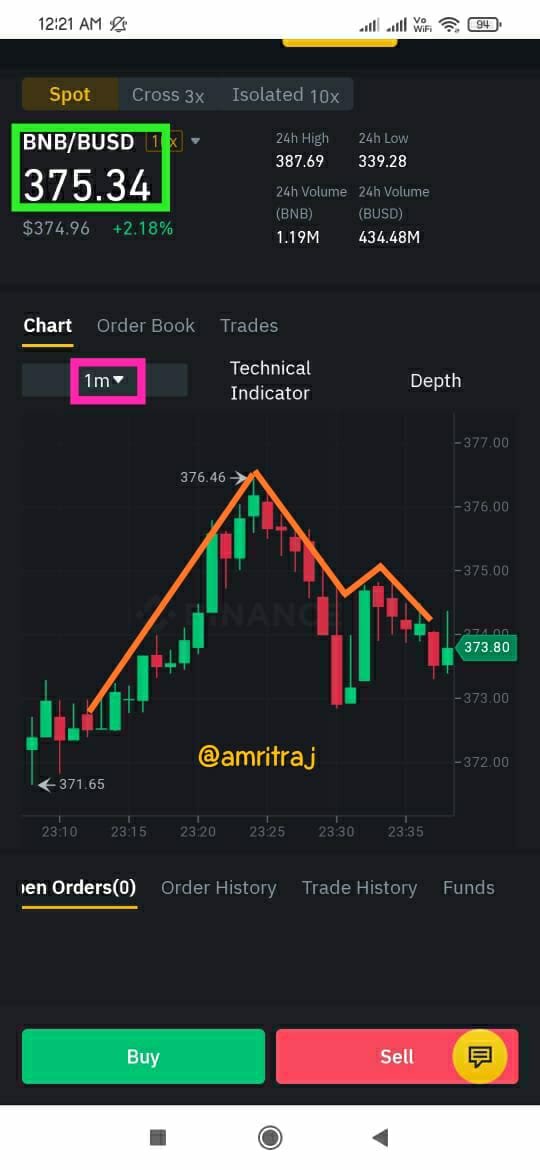
I) MINUTE TRADING in this we will gonna analyse the trades in USD/BUSD for 15 MINUTES and according to the trend of last 15 MINUTES uptrend or downtrend will put the trade. Here we see that we start analyzing
the market from 23:12 pm at that time the market price is $371.65 Slightly it start rising up and at 23:24 it reach at it resistance point (peak point) at $376.46 then it start showing its downtrend and reach the point of $ 373.80 at 23:37 pm. So, this is the trend market is following according to this it seems like now market will drop down a bit and then start rising up again. This is technical analyse of 15 minute timing frame.
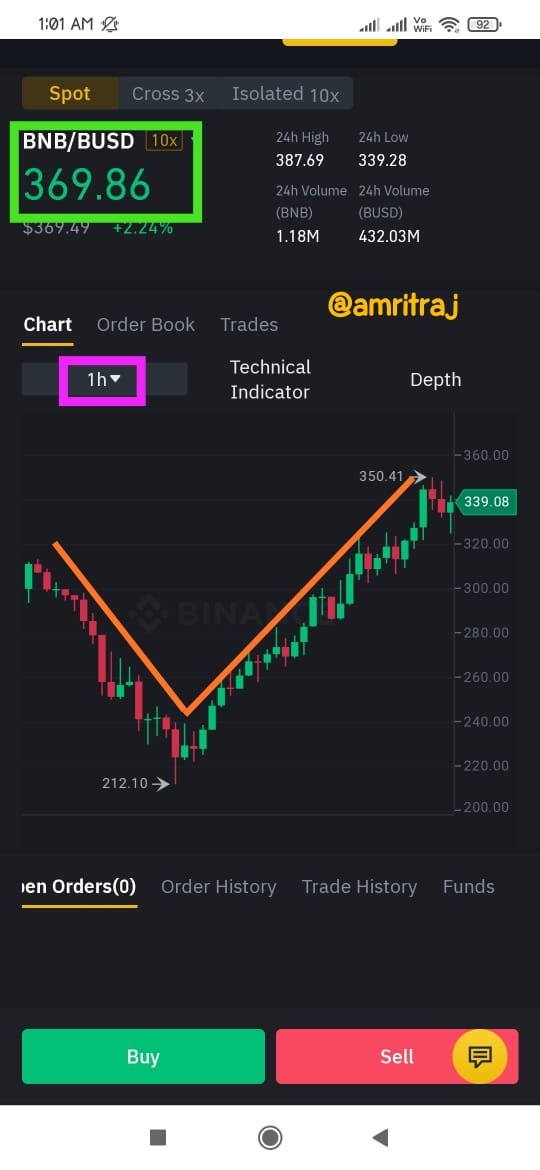
II) HOUR TRADING in this we will gonna analyse the trades in USD/BUSD for 1 HOUR and according to the trend of last 1 HOUR uptrend or downtrend will put the trade. Here we see that we start analyzing
the market from at that time the market price is $320 Slightly it start felling down and at a moment it reach at it Support point at $212.10 then it start showing its uptrend and reach the point of $350.41 at the end. So, this is the trend market is following according to this it seems like now market will drop down now. This is technical analyse of 1 hour timing frame.
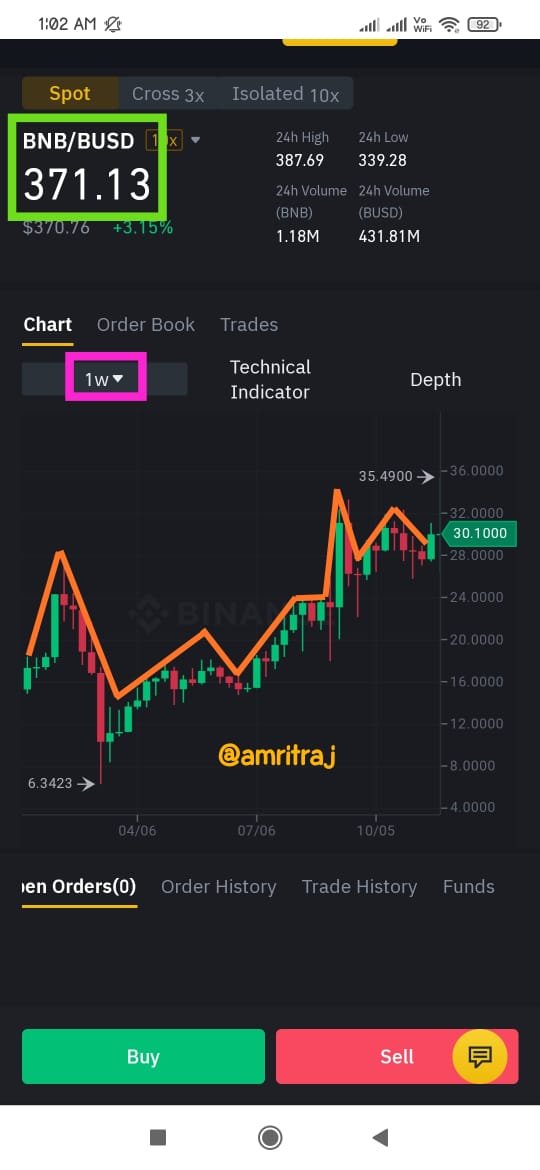
III) WEEK TRADING in this we will gonna analyse the trades in USD/BUSD for 1 WEEK and according to the trend of last 1 WEEK uptrend or downtrend will put the trade. Here we see that we start analyzing the market from at that time the market price is $18.32 Slightly it start showing downtrend and at a moment it reach at it resistance point at $6.34 then it start showing its uptrend $35.49 and reach the point of $30.10 at the end. So, this is the trend market is following according to this it seems like now market will drop down more now. This is technical analyse of 1 week timing frame.
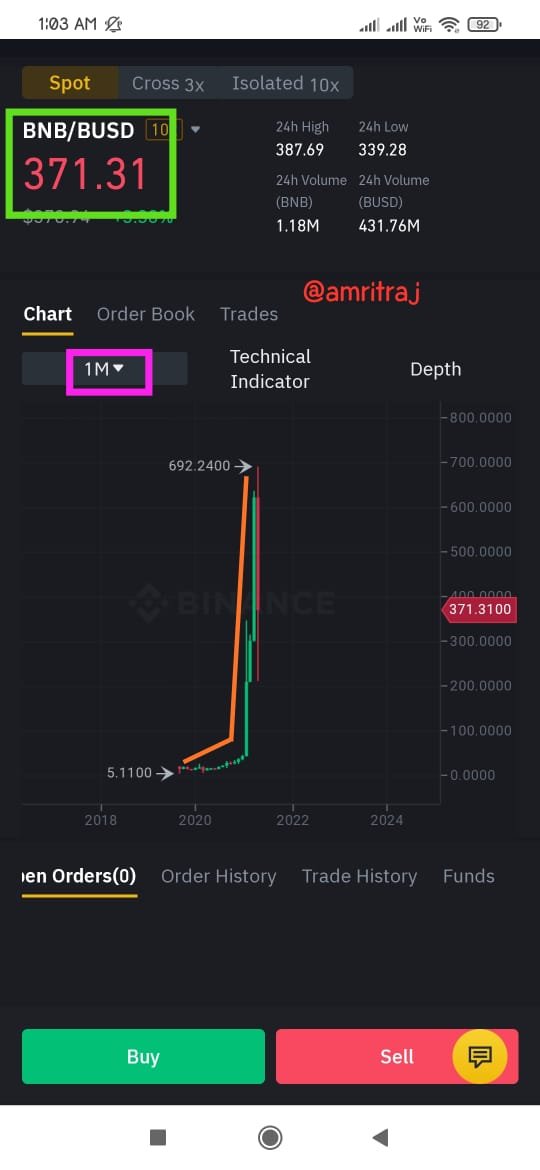
IV) MONTH TRADING in this we will gonna analyse the trades in USD/BUSD for 1 MONTH and according to the trend of last 1 MONTH uptrend or downtrend will put the trade. Here we see that we start analyzing the market from at that time the market price is $5.11 Slightly it start showing uptrend and at a moment it reach at it resistance point at $692.24 then it start showing its downtrend and reach the point of $371.31 at the end. So, this is the trend market is following according to this it seems like now market will drop down more now. This is technical analyse of 1 month timing frame.
Swing trading provides you the strategy for further trading with safe methods. It provides the knowledge about technical and fundamental analysis. Trading is all about 'Patience' if you will keep patience then you can earn good profit otherwise you can loss your money. Always trade with support and resistance and use indicators. Thank you profesor @yohan2on
'Learn then Trade'
NOTE :- ALL SCREENSHOTS ARE TAKEN FROM MY BINANCE WEB VERSION
Hi @amritraj
Thanks for participating in the Steemit Crypto Academy
Feedback
This was poorly done. You had no clear trading plan. Your article contains plenty of irrelevant content to the given homework task. There was no need to explain line graphs, bar graphs. There was no clear proof of understanding Swing trading because of the unclear charts screenshots you provided in your article.
Homework task
3
Thank you
@yohan2on @kouba01 i want you to pay attention on my post my post not yet checked yet