Season 3 week 7 | Stochastic Oscillator by @amritraj
Hey everyone Hope you all are good and doing well. Today I go through the lecture of @lenonmc21 about Stochastic Oscillator . I found it really interesting and learned alot now i am sharing my assignment.
.png)
QUESTION 1
Define in your own words what is the Stochastic Oscillator?
Stochostic oscillator is a momentum indicator which is based on support and resistance.Stochostic oscillator was developed by George Lane around 1950s.Stochostic Oscillator compares a specific closing price of a security to a series of prices over a specific period of time. By adjusting the time period or taking the moving average of the result, the sensitivity of the oscillator to market trends can be reduced.
By using Stochostic oscillator we can get to know easily that when market is overbought and oversold. Its range move between 0-100.There are three important line between 0-100 range i.e. 20,50,80.In stochostic oscillator, the zone between 50-100 consider as bullish zone and on other zone between 0-50 consider as bearish zone. In this indicator there are mainly two line which is used for buying and selling. First is %K line (fast line) and second is %D line (slow line). It has a high accuracy rate. Stochostic oscillator works on 14 time period (days, months, hours) .
Calculations:-
%k = (last closing price - lowest price) / (highest price - lowest price) * 100
%D = 3 day SMA of %k
Question2
Explain and define all components of the stochastic oscillator (% k line,% D line + overbought and oversold limits).
%k Line
%K line represents the fast movement of the indicator that makes the signal through ita cross of the slow line of %D. %K line also create the %D line.
%K line represented as solid line. Traders use this line for buying and selling of an asset. %K line compares the current closing price to te lowest low of time period by the highest high price of the time low price of the time period. The formula is:
%K = (current close price - lowest low price) / highest high price - lowest low price) × 100
%D Line
%D line indicates the slower line and it is generate from K line, %D line is represented with dotted line. It integrates the calculations of K line to generate its value. Slow line indicates the signal through its intersection above or below the fast line, % D line is moving average of %K line. It is calculated by:-
%D = 3 day Moving Average of %K.
Overbought Limit
When the reading of the scale of 0-100 is above then 80, then it will known as overvought. Its range is between 80-100. Generally it shows the bullish movement in the market. In overbought, traders sell the asset.
Oversold Limit
When the reading of the scale of 0-100 is below than 20, then it will known as oversold. Its range is between 0-20. It shows the bearish movement in the market. In oversold, traders generally buy the asset.
QUESTION 3
Briefly describe at least 2 ways to use the Stochastic Oscillator in a trade.
Ways to use the stochastic oscillator in a trade:-
Crossover
Crossover is an another best technique which is used by traders.
Crossover is a intersection of two line (%K and %D) in an overbought and oversold area. In Crossover %K is known as Fast Stochastic line and %D is known as slow stochastic line. A buy signal occurs when the fast stochastic live crosses above the slow stochastic line in oversold area. Similarly, a sell signal occurs when fast stochastic line crossed below the slow stochastic line in overbought area.
Divergence
It occurs when stochastic oscillator does not identify a new high or low of the price. A bullish divergence occurs when price hits lower low but stochastic Oscillator forms a higher low. From above statement we can indicates that the bearish momentum that may herald a bullish reversal is weak. Similarly, a bearish divergence occurs when price hits higher high but stochastic Oscillator forms a lower high. From above statement we can indicate that bullish momentum that may herald a bearish reversal is weak. In divergence we have to make sure with middle line i.e. 50. For bearish divergence we have to trade with support. When stochastic Oscillator falls below 50, then we can confirms the berish divergence. For bullish divergence we have to trade with resistance. When stochastic oscillator moves above 50, then we can confirms the bullish divergence.
QUESTION 4
Define in your own words what is Parabolic Sar?
Parabolic SAR
Parabolic SAR is a price direction provider, which is used by most of the traders. It also gives the attention when price direction is to be changed. Parabolic SAR was developed by J. Welles Wilder. SAR is also known as stop and reverse system. SAR also helps us to provide entry and exit points. We can say that SAR works on trends. SAR is represented on a chart with small sets of dotted lines near price bars. For buying an asset we have to check that the dotted lines should below the price which indicates a upward trend. Similarly for selling an asset, dotted line should be above the price which indicates an downward trend.
QUESTION 5
Explain in detail what the price must do for the Parabolic Sar to change from bullish to bearish direction and vice versa.
For Bearish PSAR to Bullish PSAR
As we known that PSAR is represented with dotted lines. For bullish reversal PSAR dotted line will be appear above the price bar which signifies that at this point traders can buy their assets and when it changes from above price bar to below price bar which indicates for selling their assets. So we can say that for bullish reversal, price bar should be move from above to below of price bar.
For bullish PSAR to bearish PSAR
For bearish reversal PSAR dotted line will be appear below the price bar which indicates that at this point traders can sell their assets and when it changes from below price bar to above price bar which indicates for buying of an assets. So here is a bearish reversal, price bar should be move from below to above of price bar.
QUESTION 6
Briefly describe at least 2 ways to use Parabolic Sar in a trade?
Entry and Exit points
PSAR gives the price direction for the traders to buy and sell an assets. If we have to buy an asset then dotted line must be below the price bar wheras for selling an asset, dotted line must be above the price bar.
Bullish and Bearish Trend Iden
If you are familiar with Parabolic SAR, then it is very easy to find the trend (upward or downward). When dotted line is above the price bar then it is in bearish trend and when dotted line is below the price bar then it is in bullish trend.
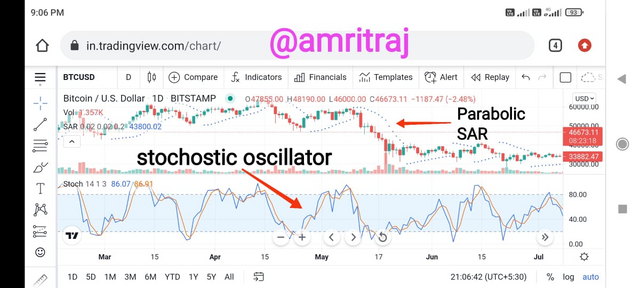
show a step by step on how to add the Stochastic Oscillator to the chart (Indicating the% k Line and the% D Line, the overbought and oversold zone.
Go on tradingview site select the chart and and follow the steps indicated below.

Select chart option
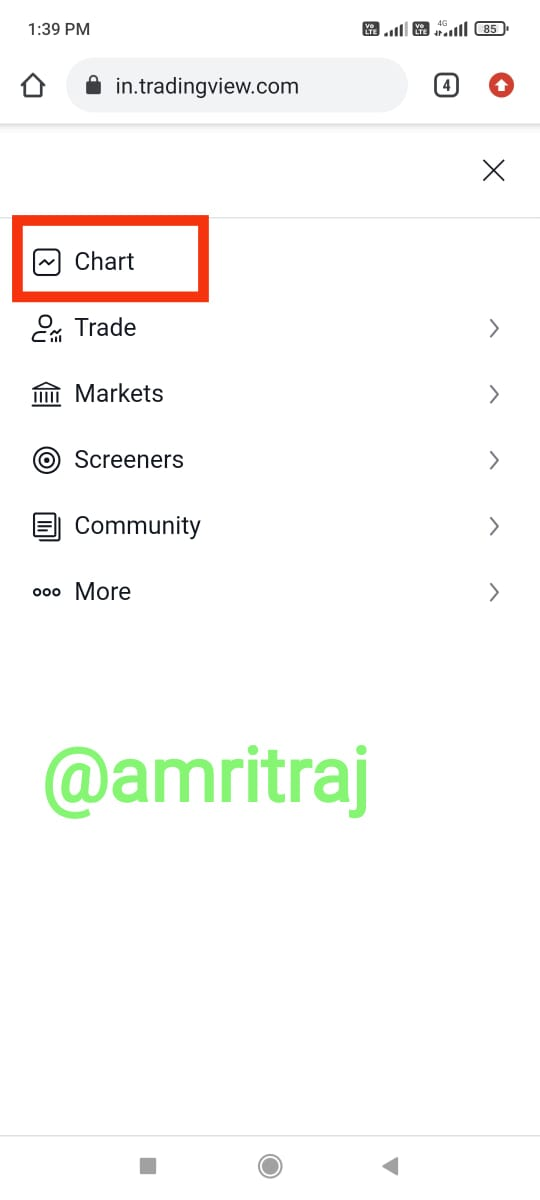
Select indicator option and click it
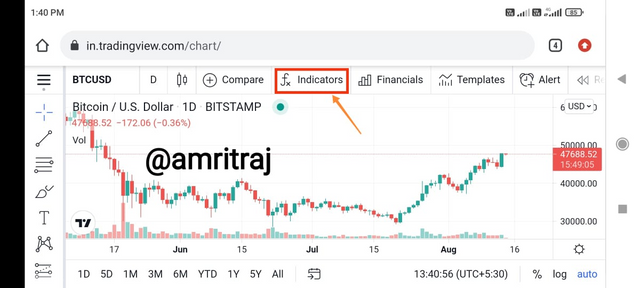
Search stochostic oscillator and click on it
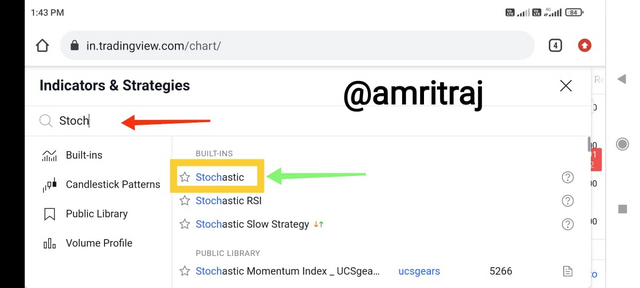
Here is our stochostic oscillator
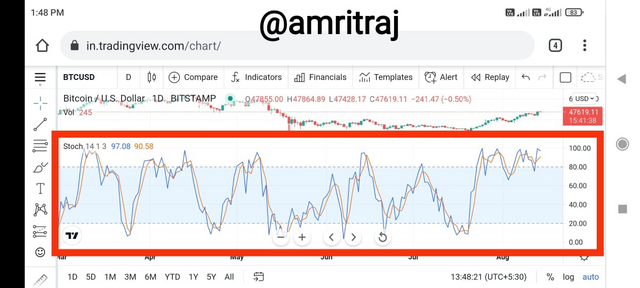
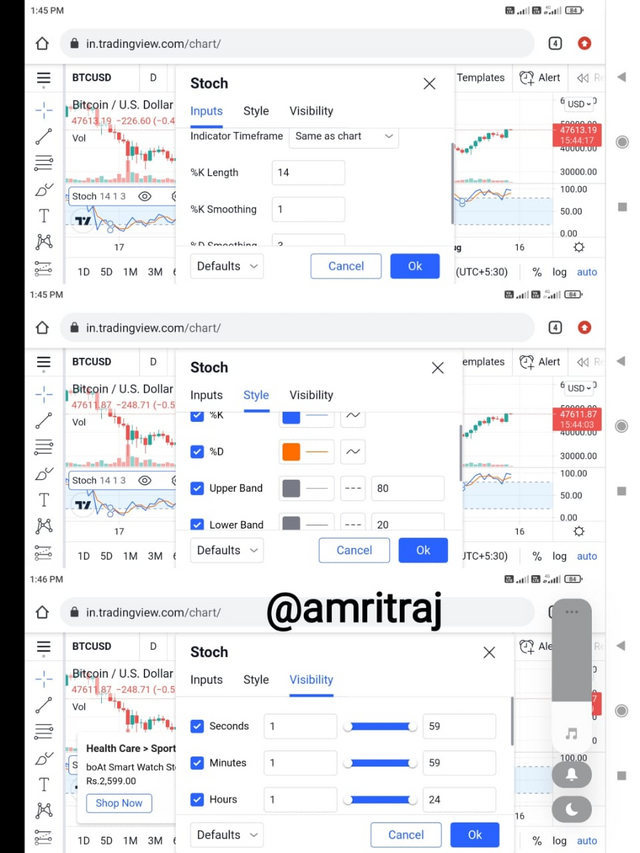
Now at the end we have a setting option through which we can set different colors for different lines like %k, %d , oversold and overbought and visibility of the indicator.
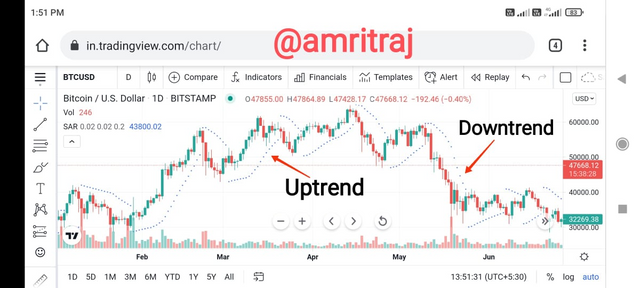
Show step by step how to add Parabolic Sar to the chart and how it looks in an uptrend and in a downtrend.
Go on tradingview site select the chart and and follow the steps indicated below.
Click on indicator
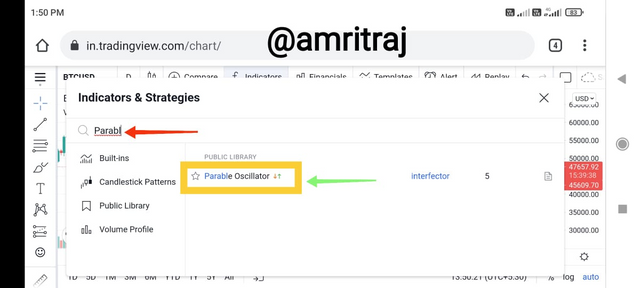
Search parabolic SAR and click on it
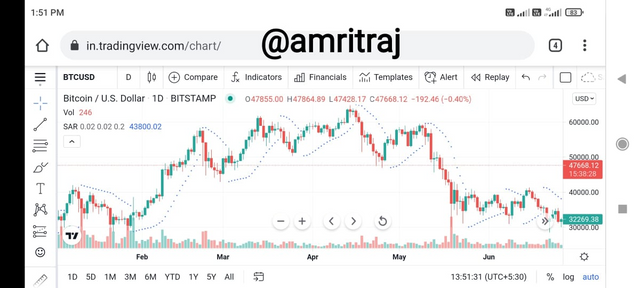
Here is our parabolic SAR
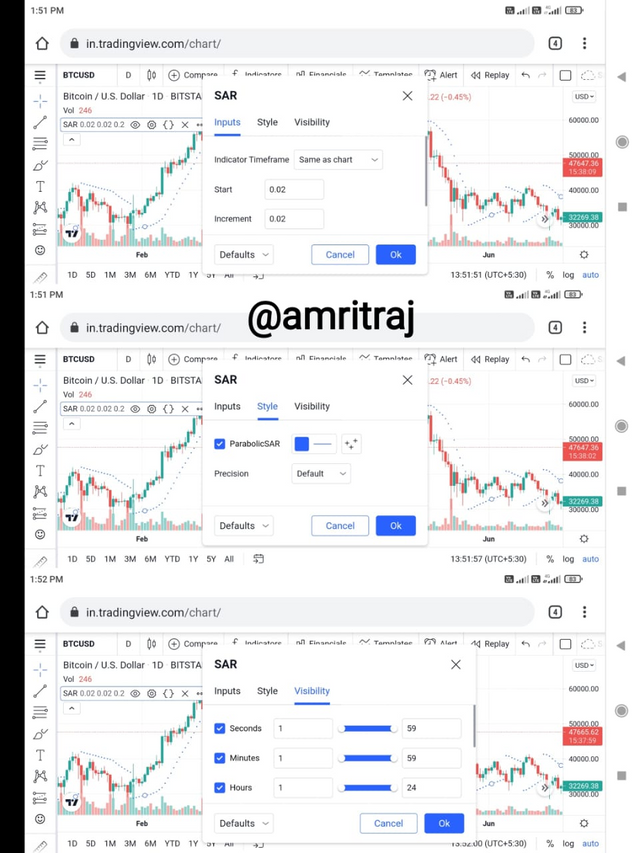
We can set the setting according to our requirement.
Here is the uptrend and downtrend shown by parabolic SAR.
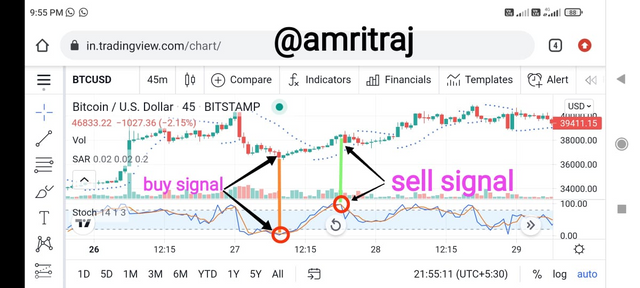
Add the two indicators (Stochastic Oscillator + Parabolic Sar) and simulate a trade in the same trading view, on how a trade would be taken.
After using both indicator we can get easy for buying and selling of an asset. Here for buying,%k line should cross above the %d line which indicates a bullish uptrend and parabolic SAR which is represented dotted line should be below the price bar. For selling, %d line cross above the %k line which indicates a bearish movement and dotted line should be above the price bar.
Conclusion
Stochostic oscillator and parabolic SAR both is a very useful indicator for making profits. Stochostic oscillator gives the momentum of the market and help us to buy and sell and it also tell when market is overbought and oversold. Parabolic SAR indicator indicates the price prediction and it has a high accuracy rate by which we can easily make profits. If we use both indicator then there is more chance of making profits.