Cryptoacademy | Season 3 week 5| SMA and EMA by @amritraj
Hey all, I studied the lecture of professor @lenonmc21 about simple moving average and expotentional moving average. I learned alot now I am doing my homework.

Definition of simple moving averages and exponential moving averages.
SIMPLE MOVING AVERAGE
Simple moving averages is related to market price indicators that allow traders to locate the average price of cryptocurrencies in a given period of time. It is also often used to obtain investment and to understand business opportunities by studying statistics on past market conditions. Through this technical analysis, threats and possible areas can be identified. The simple moving average extracts the price and transaction volume information of the cryptocurrency relative to the previous time to clarify its position in the cryptocurrency market. The purpose of calculating it is to balance your price chart by establishing continuous updates of average price data. With this, traders can now identify the trend direction of a certain cryptocurrency before or after investing.
EXPONENTIAL MOVING AVERAGE
The exponential moving average is a modern technical indicator by which we can weighs the latest data points on a certain day of averaging. Since you are more interested in new data points, the exponential moving average ensures that old data points and unnecessary data points have different effects from the new data points.EMA are built to look for rate trends over a specific period such as 50 or 200 days. Days traders can integrate this metric into charts to help determine trends, directions and strength of the markets and try to identify the entry and exit point.
Calculation of simple and exponential moving averages
SMA
The simple moving average can be calculated by adding the price of the asset and dividing by its period The closing price is the known price for this calculation. E.g. Use the following assets as daily closing prices: $ 20.5, $ 19,$ 23, $ 22.6 and $ 23. With this, the simple moving average for day 1 will be: ($ 20.5 $ 19 $ 23 $ 22.6 $ 23) / 5 = $ 89.7
EMA
As, the exponential moving average pays more attention to current or newer data than to old data. It can be calculated like this formula: EMA = ( K * ( C - P)) + P
Where
C= current price
P= yesterday EMA
K= Exponential constant
Briefly describe at least 2 ways to use them in our trading operations.
It is better way to analysis the trend of a particular asset. If the slope is upward, it means an upward trend, if the slope is downward, it means an downward trend.
Resistance and Support level.
What is the difference between simple moving averages and exponential moving averages (Explain in Detail)
The major difference is that SMA calculates the average of price data where EMA calculates more weight to current data. EMA reacts to price change faster than SMA.The exponential moving average reacts quickly to price movements because it has more weight on recent data. With these, exponential moving averages quickly reflect price action and provide more accurate results than simple moving averages. Because of these differences, the EMA takes precedence over the SMA. Which one to use depends on your goals, personal preferences, and trading style. The SMA is also a good choice when it comes to support and resistance levels and with the use of the SMA one will not go wrong as the SMA reacts slowly.
Define and explain in your own words what "Fibonacci Retracements" are and what their gold ratios.
The Fibonacci retracemet, a technical analysis tool that helps identify support and resistance, is represented by lines drawn on the asset's price chart. It generate the levels between two points. The Fibonacci sequence is a sequence of numbers starting with 1, where a given number is equal to the sum of the two preceding numbers: 1+ 0 = 1, 1 +1 = 2, 1 +2 = 3, 2 +3 = 5.
The Fabonacci ratio can be calculated by dividing the last number by the second number on the right. Eg. 1/1 , 1/2 = 0.5 , 1/3 = 0.333 , 2/3 = 0.666. Fibonacci retracement is plotted to recognize support and resistance areas on price charts based on the digits of the golden ratio converted to percentages. These levels are; 23.6%, 38.2%, 50%, 61.8% and 78.6%. So 38.2% comes from dividing a number in the sequence next to the number found two places on the right and 23.6% comes from dividing a number next to the number found three places on the right .
Show step by step how to add a "Simple and Exponential Moving Average" to the graph (Only your own screenshots - Nothing taken from the Web).
ADDING SMA TO CHART
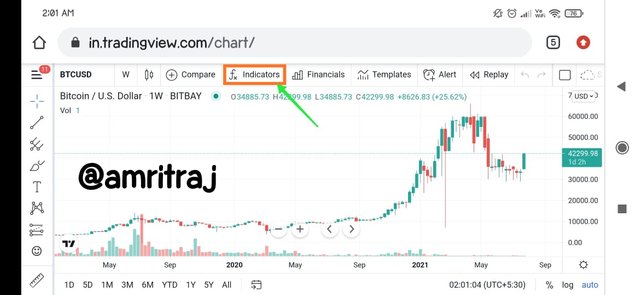
Step 1
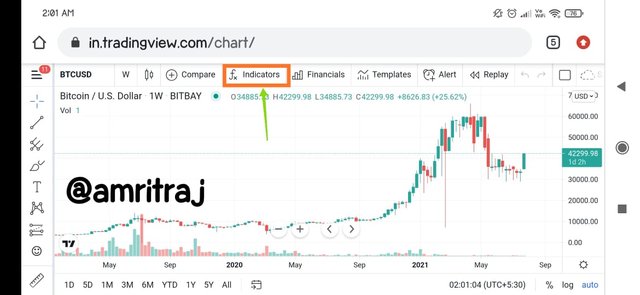
Firstly visit on tradingview.com and click on indicator on top.
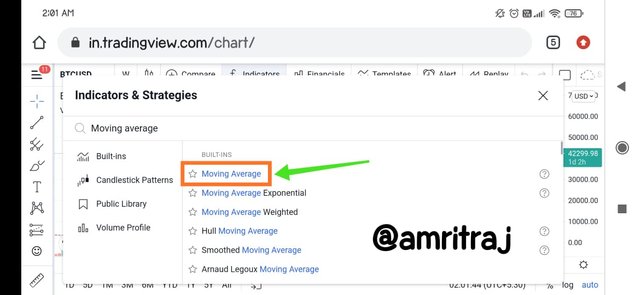
Step 2
Now, search moving average and put moving average indicator on chart.
Step 3
Now we can set our MA like we can set MA as 10.
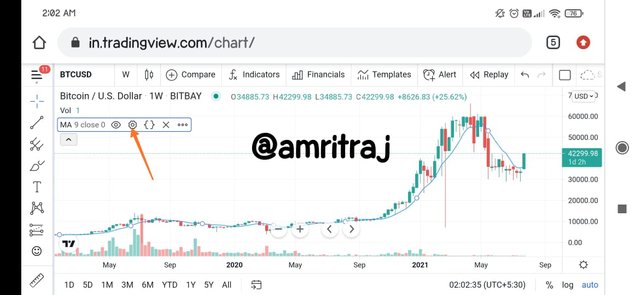
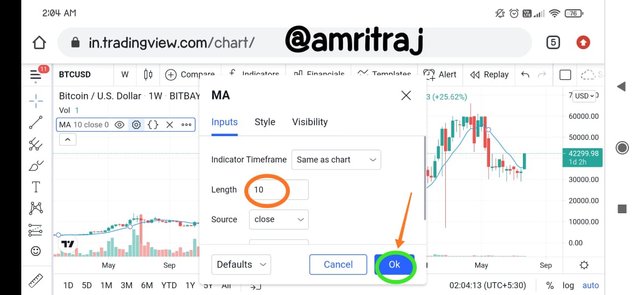
Simple moving average indicator for length 10 is setup.
ADDING EMA TO CHART
Step 1
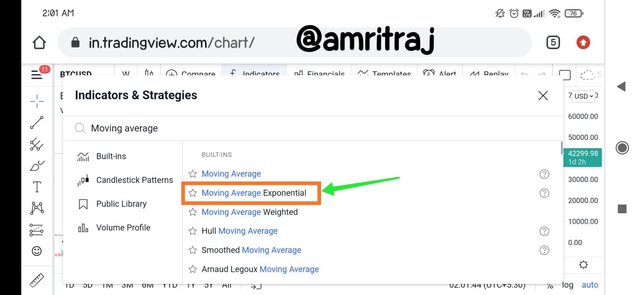
Now in indicators search moving average expotential and click on that.
Step 2
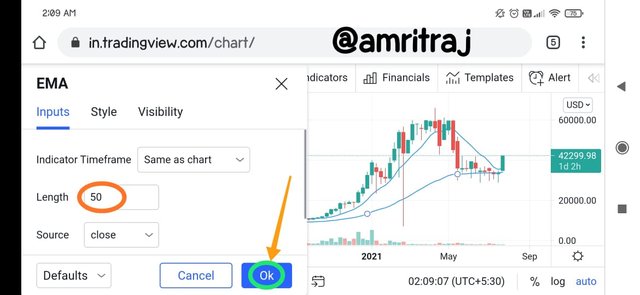
Click on top left corner to edit and set the length 50.
Step 3
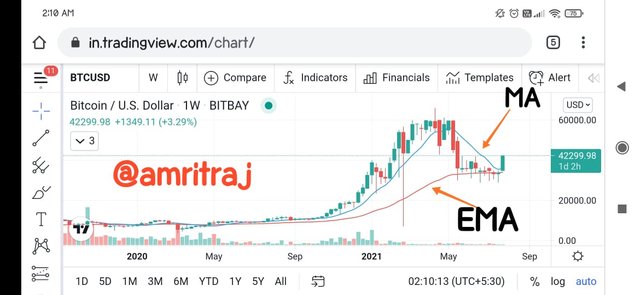
Now our both SMA and EMA is showing in same chart.
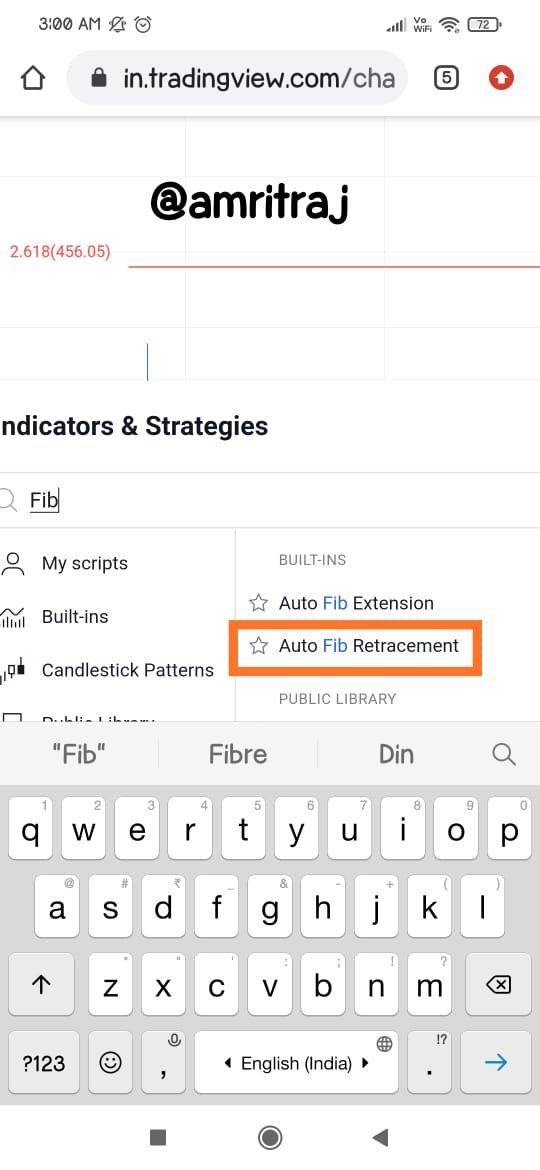
Use "Fibonacci Retracements" to chart a bullish and bearish move (Own screenshots only - Nothing taken from the web)
Open indicator and select Fibonacci indicator.
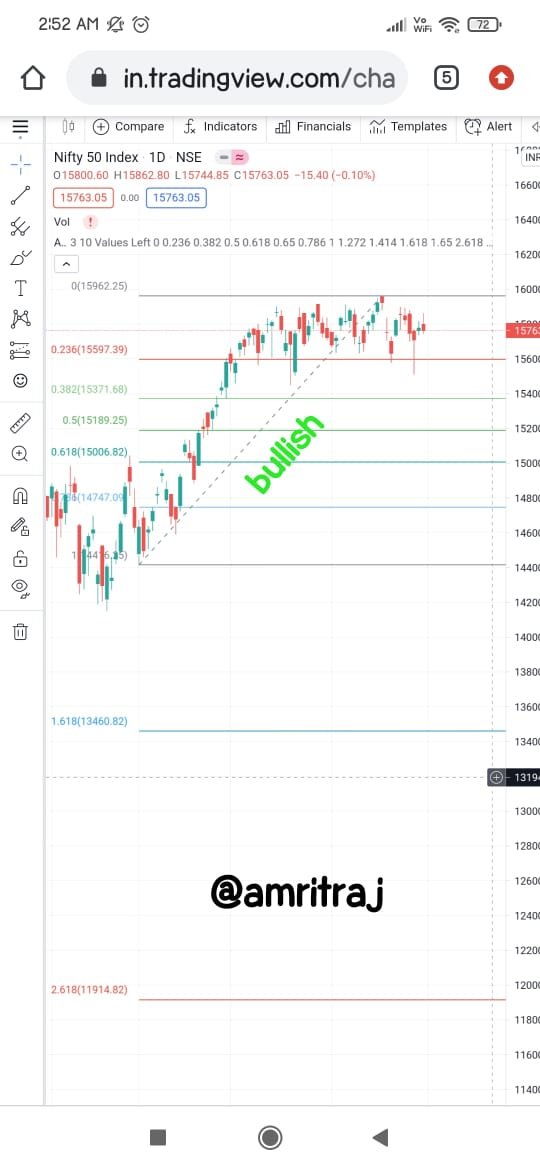
Fibonacci retracements for the bullish trend that is low to high.
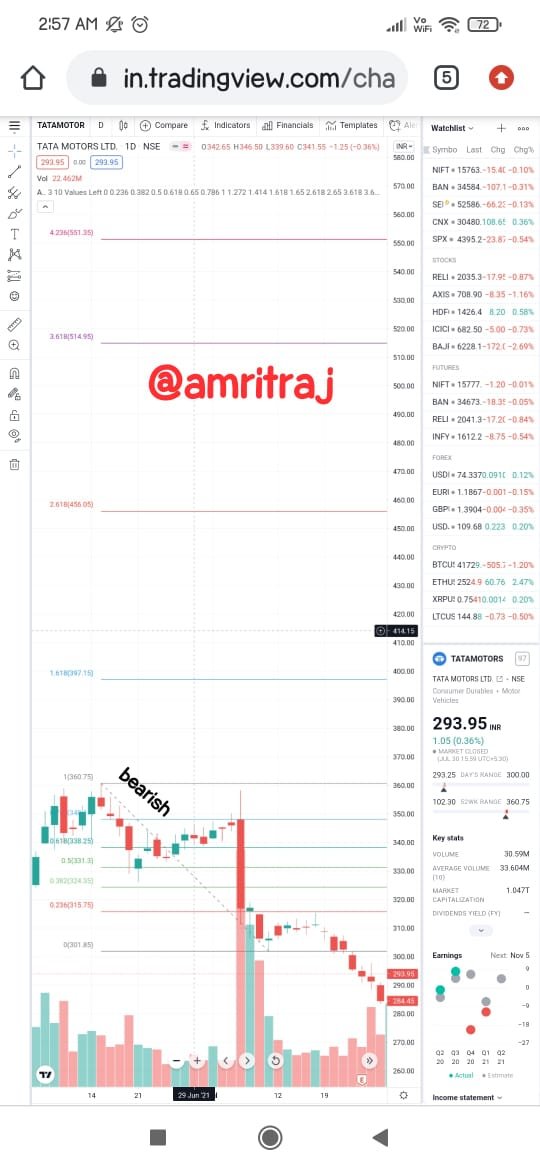
Fibonacci retracements for the bearish trend that is high to low.
CONCLUSION
Moving averages are an absolutely essential part of technical analysis. MA smoothes out price action and also helps predict future prices. Can also help the trader to indicate the current market trend, so that he follows the price. Hence, it can be helpful for traders to determine the current market momentum.