Crypto Academy Season 3 Week 4 | Spotting Market Reversals With CCI by @amritraj

This design is created by me on canva

Question 1
Open a demo account on any trading broker and select five cryptocurrency pairs?
Answer 1
STEP I
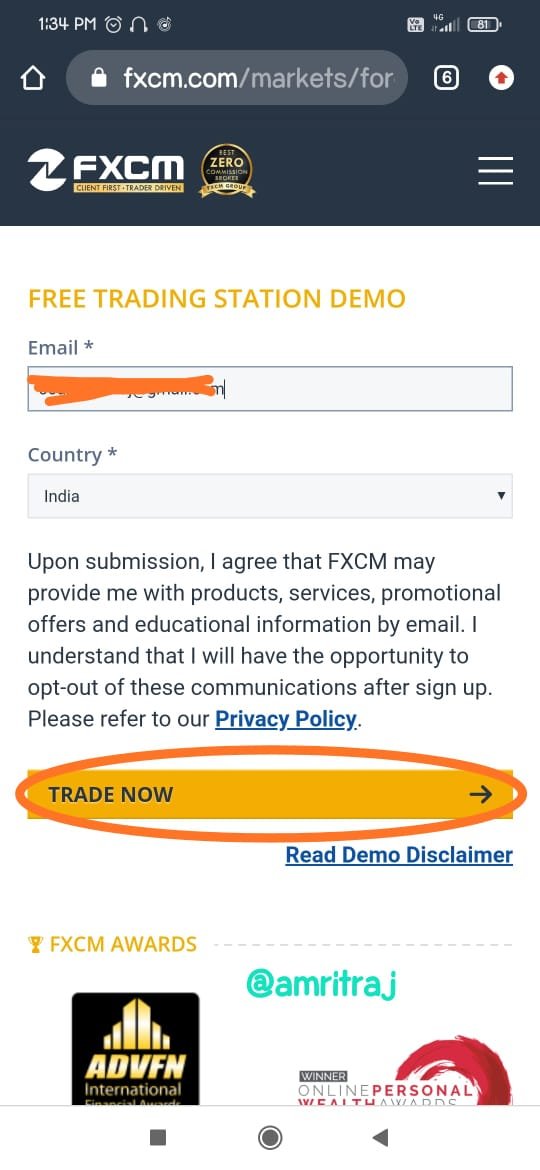
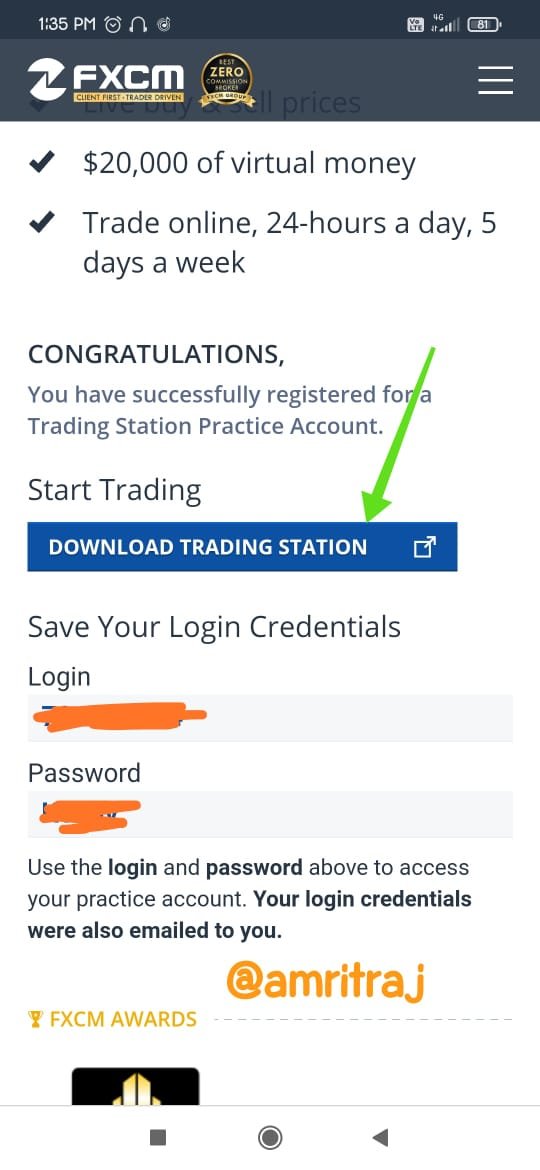
Now I will open a demo account in FXCM. Where we will find a free trial demo. Just enter the email and select the country, and then we will receive an email containing the login ID and password.
STEP II
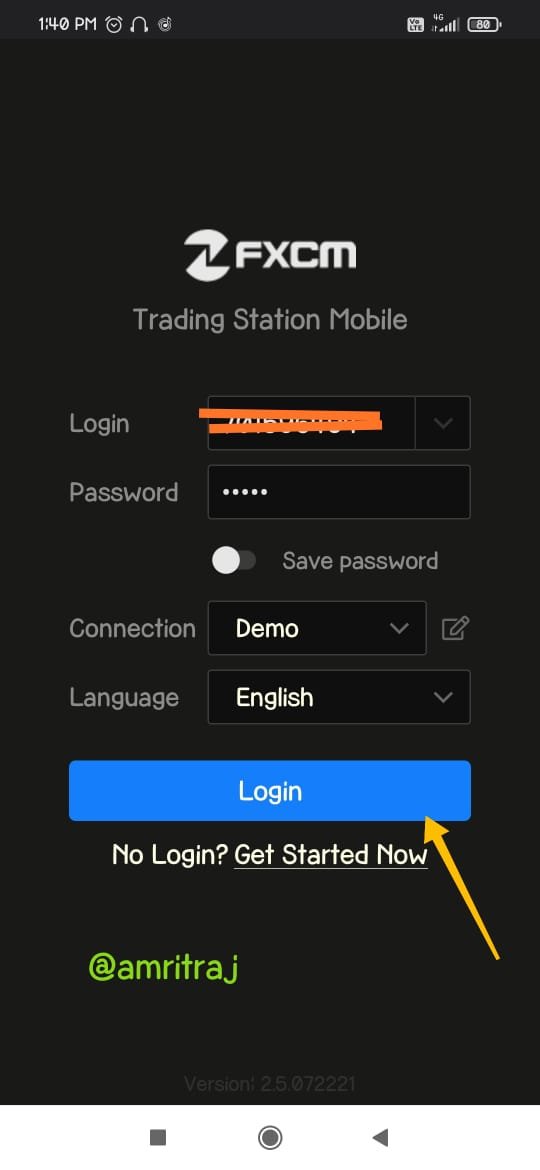
After downloading, enter the user name and password to log in.
STEP III
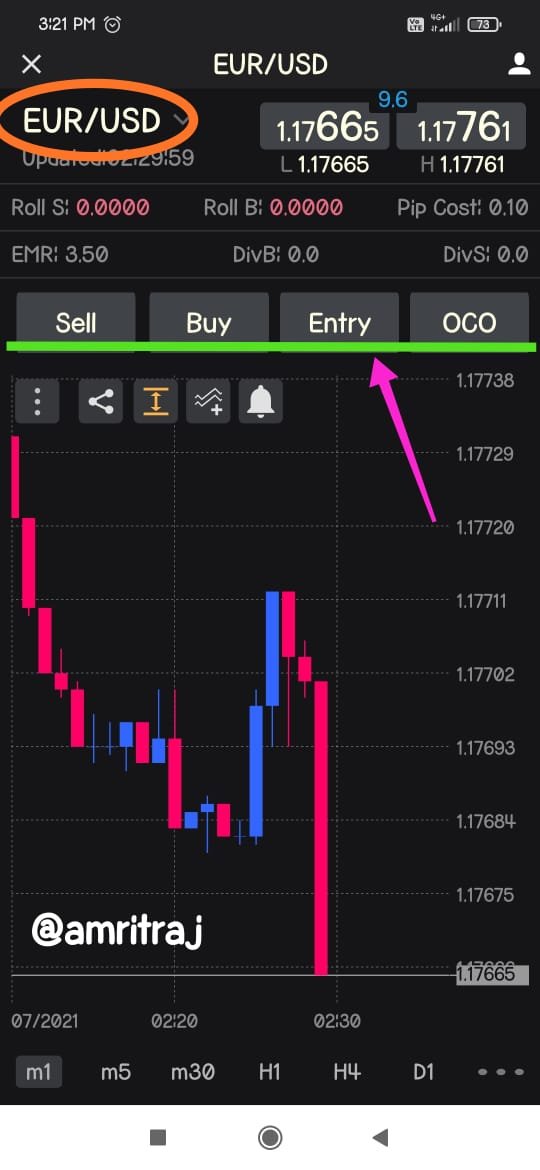
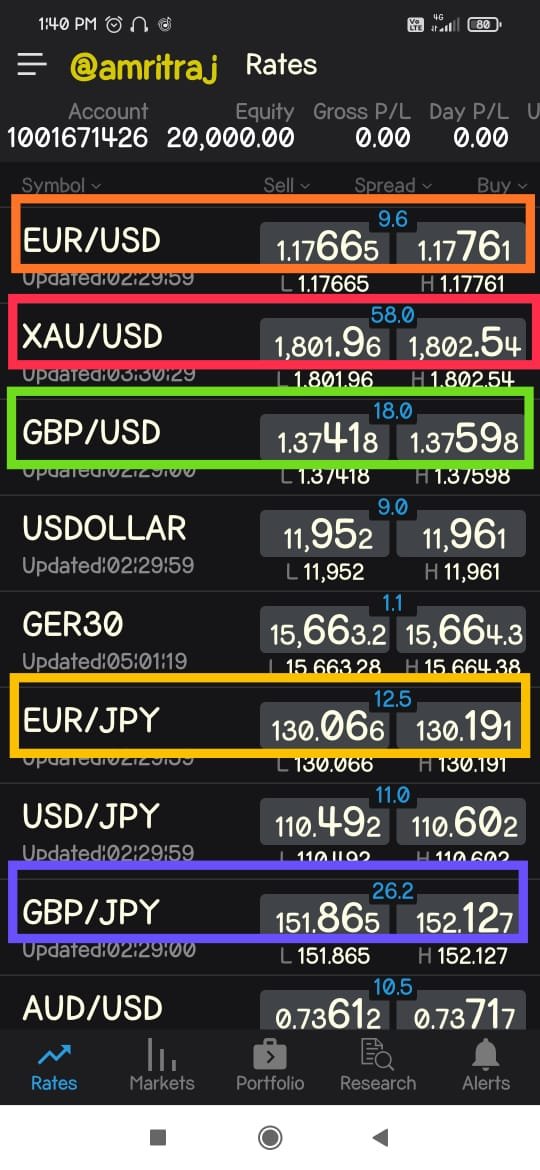
After logging in, we will see the default view. Here, we get a free balance of USD 20,000 on the demo account, which is used to learn trading and develop strategies. We can choose different assets, such as stocks, commodities, cryptocurrencies, and currency pairs. we can see tools that can use different indicators, zoom in, zoom out and draw lines. Quick buy and selling option also available.
STEP IV
Now, we select 5 different cryptocurrencies is EUR/USD, XAU/USD, GBP/USD, EUR/JPY and GBP/JPY. Selected currency is on the top view.
Question 2
Create a market entry and exit strategy?
ANSWER 2
Trading entry and exit strategies are established rules created and followed by traders to ensure discipline and fact-based trading. These strategies can include how and when to use indicators, chart patterns, candlestick types, risk ratios, etc. They also indicate when to move away from trading settings. Business strategy depends on the individual. Traders develop strategies based on how they understand price changes and choose to react to them. This is very subjective and is designed to suit the individual personality.
My strategy
I use a confluence-based trading strategy, which is a combination of various factors, such as market structure, candlestick analysis, indicators, chart patterns, and sometimes fundamental analysis to generate trading settings. Depending on the time frame and risk appetite, this style usually has a high rate of return.
Entry Strategy
Obvious directional deviation
Is a market trend or a range? If it is a trend, what is the trend? Is the market structure maintained? If you are in range, do you have enough limits (points) to allow trading?
Confluences
Is the indicator consistent with the market structure? The trading volume is the last hours, the chart patterns and the candlestick analysis.
Risk-reward (Take Profit and Stop Loss)
According to the configuration, what is the best minimum risk-reward ratio? I use at least 1: 1.5, such as risking $ 50 per transaction to win $ 75.
Risk Management
What percentage of investment capital must be made for each transaction? My risk per transaction is 34%. This helps maintain a healthy balance in the event of bad transactions.
Exit Strategy
Benefits
The target prices generally obtain a benefit target price, since the ratio at risk is greater. This output method indicates that the merchant has earned benefits.
StopLoss
Close Trade price, usually less percentage compared to rewards. This method of leaving the results of the appearance of this loss.
Deactivation of Commerce
This output method occurs when commercial ideas are disabled, but generally transactions will be benefits or losses.
Entry
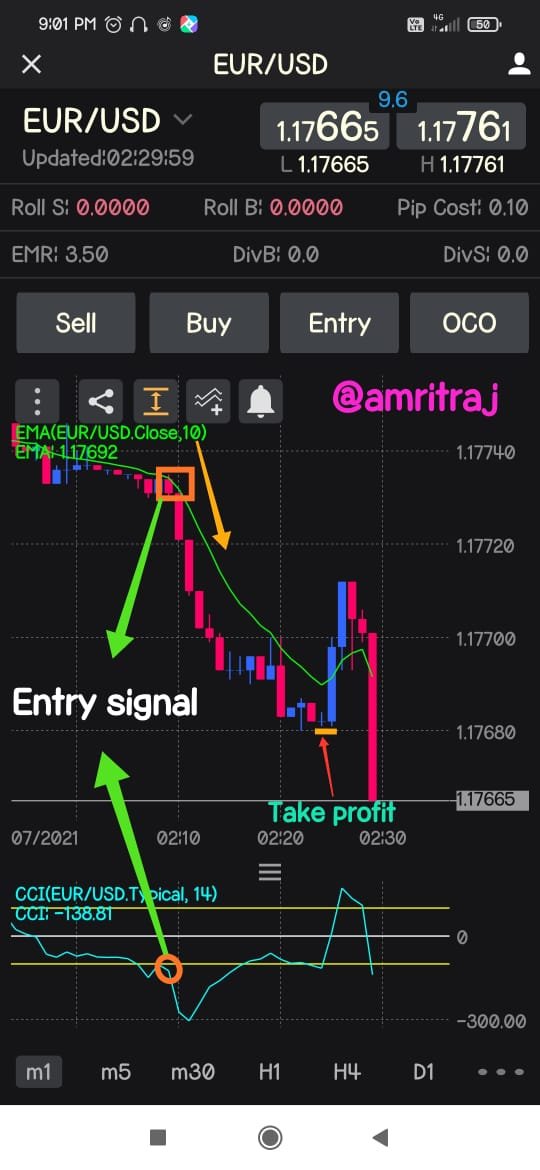
In the above chart, the trend is a clear downward trend, forming lower highs and lows, which is confirmed by the market structure and the EMA indicator (EMA stands for dynamic support and resistance area). The Commodity Channel Index (CCI) indicator shows that the price is still in the neutral zone, which means that there is a possibility of further downside before reaching the oversold zone. The price touched and rejected the moving average, and the formation of moving averages and candlestick patterns confirmed the reversal of the trend after a small rise.
Exit
The ratio of stop loss and take profit is set to 1:2, which is consistent with the area represented by the blue horizontal line in the previous market structure.
Question 3
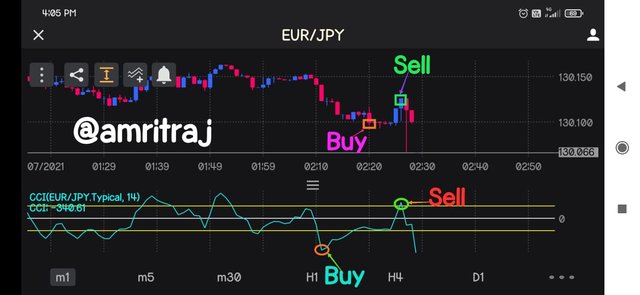
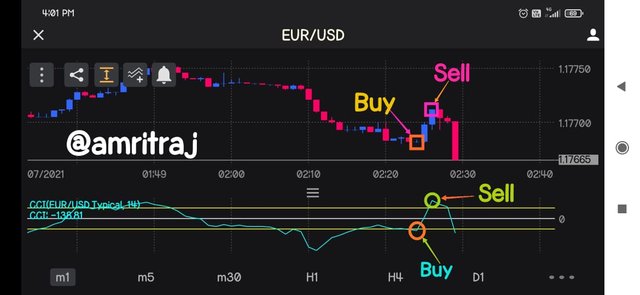
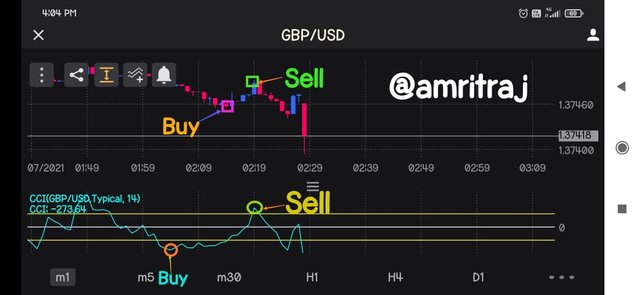
Use the signals of the Commodity Channel Index (CCI) to buy and sell the coins you have selected ?
Answer 3
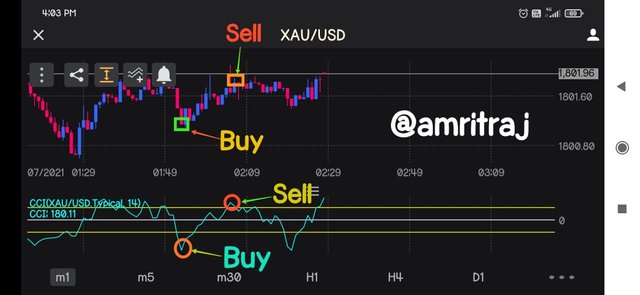
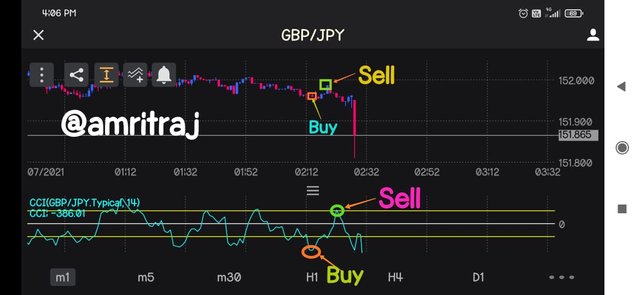
As, we learned exit entry strategy in market with indicators so we apply all knowledge and guess the points in our selected currency.
Question 4
Declare your profit or loss?
Answer 4
I made 4 trades in my demo account but i face loss because maerket was not stable at that time. I was unable to understand the thing properly so thats why i am just apopering in this question according to the above knowledge but To be honest i was unable to establish a good trade.
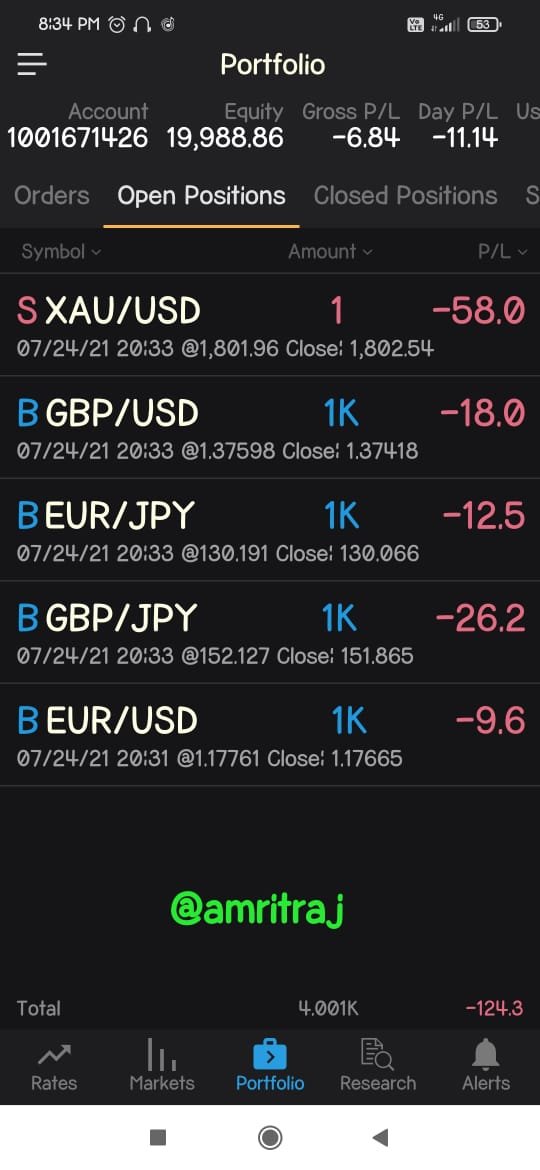
Profits: zero
Loss:
XAU/USD - (-58$)
GBP/USD - (-18$)
EUR/JPY - (-12.5)
GBP/JPY - (-26.2)
EUR/USD - (-9.6)
Net Profit made=Total Profit-Total Loss
= 0-(124.3)
= -$124.3
Question 5
Explain your trade management technique?
Answer 5
The stop-loss and take-profit prices of the transaction were set to a ratio of 1:3, but I manually closed the positions of the two transactions. This is because the settings are viewed within the daily time frame, it's time to play.
Another contributing factor is that the price is trading below the 20 and 50 EMA in the daily time frame, which is contrary to the situation shown by the CCI indicator. I ran to clearly and correctly understand the concepts taught in this lesson. I can say that the CCI indicator shows an early price reversal signal, but the signal should be confirmed when the other indicator factors are consistent.
Conclusion
The market reversal is the main change in the price change phase. It indicates changes in market sentiment and provides traders with opportunities for profit. Indicator tools such as CCI and EMA are used with price action to identify trend reversals and allow interested investors to invest at the right time. Thank you @asaj Professor for Amazing lesson.
Hi @amritraj, thanks for performing the above task in the fourth week of Steemit Crypto Academy Season 3. The time and effort put into this work is appreciated. Hence, you have scored 4.5 out of 10. Here are the details:
Remarks:
It was specifically stated that this task involves cryptocurrencies. Here's a screenshot of my homework post:
Unfortunately, you did not perform the task as stated above.