Crypto Academy Week 14, Homework task for [@fendit] - Elliott Wave Theory carried out by @amplegeologist

Hello steemians, once again am happy to be a part of this week’s Steemit Crypto Academy Contest, the 14th week. After reading through the lecture given by @fendit, on the topic “Elliott Wave Theory” am about to answer the questions or task given by the professor. It was an interesting lecture knowing about Elliott Wave Theory and it application
What's the application of this theory?
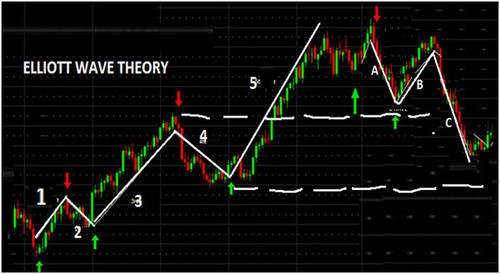
image source
Elliot Wave Theory is a principle that was created by Ralph Nelson Elliott that follows the market trend of assets if it is bearish or bullish and is used in predicting the market prices of assets.
The applications of the Elliot Wave Theory is as follows:
- It helps to provide traders or investors a suitable entry and exit positions in the market when trading
- It helps the traders to know the movement of market so as to know a good buying period or selling period
- It provides traders with information as to if the market is trending in a bearish or bullish direction
- It helps traders or investors to predict the downtrend and uptrend movement of a crypto assets
- It helps in preventing the traders or investors from acquiring loss in trading of assets.
- It helps traders or investors in taking right decisions as to knowing the pattern of the market
What are impulse and corrective waves? How can you easily spot the different waves?
The basic waves recognized in the crypto markets are the impulse and the corrective waves.
Impulse wave are those waves that indicates an uptrend in the prices of assets while correctives waves are those waves that indicates a downtrend in the prices of assets.
From the theory’s view, the market cycle has a total of 8 waves where the first 5 waves according to asset chart represents the impulsive wave and the last 3 waves represents the corrective waves.
How can you easily spot the different waves?
Different waves can be easily identified and spotted based on some rules. The identification of this waves can be done by comparing the length of the start and ends of each wave.
The first wave indicates the beginning of the cycle which shows a low influx of buyers of the asset leading to a little rise in the price of the asset.
The second wave indicates a downtrend in the price of the asset due to a low influx of sellers than buyers of the asset.
The third wave indicates a high uptrend in the price of the asset due to a higher mass of investors buying the asset.
The fourth wave indicates a fall in the price of asset due to the selling strength of positions by the traders.
The fifth wave indicates a high level price in the asset caused by the high level of population buying the asset.
The five waves above represents the five impulse waves.
According to Elliot’s Wave theory, the corrective waves can be identified using the last three waves which start after the end of impulse wave.
Zigzag wave, this wave can be spotted when there is a zigzag pattern of formation in the wave. It follows an uptrend in the price of asset where B becomes shorter than A and C
Flat wave is one which shows an equal formation where there is no zigzag pattern shown and it also shows a downtrend in the price of asset
Triangle wave is one which indicates a downtrend in the prices of asset.
What are your thought on this theory? Why?
Elliott Wave theory is a theory which can help in the identifying market trends where selling or buying of assets can be possible. It is a very good parameter for prediction of prices because the waves can easily be traced and understood although it might not be a 100% sure prediction but will help in taking certain decisions as to when to buy and also sell assets and also it will be perfect for a short term trading.
B) Choose a coinchart in which you were able to spot all impulse and correct waves and explain in detail what you see. Screenshots are required and make sure you name which cryptocurrency you're analyzing.
In this question, I will be using BINANCE coin chart to explain the wave patterns as shown below. Am using the DOGE TO BUSD price chart below and waves.

In the screenshot shown below, the impulse waves and the corrective waves are shown. The first five waves represented as 1-5 indicates an impulse wave. The first wave is the starting wave which shows a rise in the price of the asset due to little influx of buyers of the coins than the sellers, the second wave indicates a drop in the price of the asset due to increased number of sellers than the buyers in the crypto market. The third wave indicate a high uptrend in the price of the asset due to a higher mass of investors buying the asset. The fourth wave indicates a fall in the price of asset due to the selling strength of positions by the traders and the fifth wave indicates a high level price in the asset caused by the high level of population buying the asset.
The corrective waves are represented with the letters A, B, and C and these waves represents a zigzag pattern of corrective wave.

Conclusion
This was a great and amazing lecture and have learnt a lot from this lecture on Elliot Wave Theory and its application on trading. Elliot Wave Theory is quite a nice and useful tool for the forecasting and prediction of market trend of assets for a profitable trading.
Thanks to Professor @fendit for this wonderful and interesting lecture, it was an awesome one.
Thank you for being part of my lecture and completing the task!
My comments:
Your work was fine, but I wish you had developed a bit more your answers!!
Overall score:
5/10