Crypto Academy / Season 3 / Week 7 – Homework Post for [professor @lenonmc21] Analysis and Trading with the indicators "Stochastic Oscillator +"Parabolic Sar"
Am gladdened once again for yet another opportunity of this wonderful edition by the cryptoacademy. From the lecture offered by Professor @lenonmc21, reading through this lecture series have given me a better insight on Analysis and Trading with the indicators "Stochastic Oscillator +"Parabolic Sar". To this, I will be writing based on the task given by the Professor.
Theory (No images)
Define in your own words what is the Stochastic Oscillator?
Stochastic Oscillator is an indicator used by traders to estimate or calculate the closing price to the high-low range of an asset over a specific period of time. Stochastic Oscillator is a technical indicator that was developed by George Lane, an analyst in 1950. Stochastic Oscillator is also known as a momentum indicator used by investors for technical analysis of asset movement so as to make a good decision on asset in the market.
This indicator ranges from 0 to 100 which helps a trader to identify when the price of an asset falls into an oversold or vice versa. The momentum of price will be detected by the use of Stochastic Oscillator thus helping an investor to spot out a potential bullish or bearish as well as the resistant and support of an asset in the market.
Explain and define all components of the Stochastic Oscillator (% k line, % D line + overbought and oversold limits).
%K line: This is a component of Stochastic Oscillator. It is a line that displays the real value of stochastic oscillator of the asset (i.e the real value of price movement or momentum). It helps a trader in tracking the current market rate of an asset.
This line can be calculated by using the formula:
%K = 100 [(CCP – LPT) / (HPT – LPT)]
Where CCP – is the current closing price
LPT – lowest price traded
HPT – highest price traded
%K – Stochastic line
%D line: This is another component of the Stochastic Oscillator. It is a line that displays the moving average of the real value of price momentum (i.e the moving average of %K). It is slow in reaction to the change of price in the market and thus otherwise known as the Stochastic slow.
Overbought limit: This is a point where the influx of buyers of the asset exceeds the limit range of the Stochastic Oscillator. It can be seen on a chart when the %K and %D line crosses above the 80 range of the Stochastic Oscillator and it indicates a potential reversal in the uptrend of an asset.
Oversold limit: This is a point where the influx of sellers of the asset exceeds the lit range of the stochastic oscillator. It can be seen on a chart when the %K and %D line crosses below the 20 range of the stochastic oscillator and it indicates a potential reversal in the downtrend of an asset.
Briefly describe at least 2 ways to use the Stochastic Oscillator in a trade.
Stochastic Oscillator can be used in trade as follows:
The indicator can be used by traders to indicate a potential reversal in the trend movement of an asset. How? If for instance an asset enters an oversold region, it signifies a potential reversal in the downtrend, thus a potential bullish trend is expected (the right time for traders to open order in a trade) and if the asset enters an overbought region, it signifies a potential reversal in the uptrend, thus a potential bearish trend is expected (the right time for traders to exit order in a trade).
The indicator can also be used by traders to recognize support zones and resistance zones thus allowing investors or traders to know the right time to sell off or buy an asset to make profit in a trade.
It also helps traders to be able to signal trade that will yield profit by spotting a good time for opening order and closing order when the assets experiences a cross of the %K line and %D line over the overbought line and also when the %K and %D lines crosses below the oversold zone respectively.
Define in your own words what is Parabolic Sar?
Parabolic Sar is one of the technical indicator used by investors or traders to study the direction of price of an asset and it potential trend change. Parabolic Sar indicator was developed by J. Welles Wilder. It is an indicator also known as stop and reverse indicator that can be used by traders or investors to spot reversal and direction of price as well as when a trader should open a trade (order) and also close a trade (order).
This type of indicator is denoted as dots on charts showing the bullish or bearish an asset price thus giving a trader or investor an advantage in making good decisions on when to make an entry and when to exit an entry.
Explain in detail what the price must do for the Parabolic Sar to change from bullish to bearish direction and vice versa.
For the Parabolic Sar to change from bullish to bearish direction, the dotted lines of the Parabolic Sar must fall under the price of the market (i.e grow under the candlestick). As the trend keeps increasing in a bullish direction, if the dotted line touches a candlestick or the bullish candlestick, it indicates a potential reversal in the bullish trend and thus the dotted line will start growing or will be displayed above the market price.
For the Parabolic Sar to change from bearish to bullish direction, it takes the reverse case of the first explanation. The dotted lines of the Parabolic Sar must fall above the price of the market (i.e grow or move above the candlestick). As the trend keeps moving in a bearish or downtrend direction, if the dotted line touches a candlestick or the bearish candlestick, it indicates a potential reversal in the bearish trend and thus the dotted line will start growing or will be displayed below the market price.
Briefly describe at least 2 ways to use Parabolic Sar in a trade?
Parabolic Sar can be used in trade as follows:
The indicator can be used by traders or investors to spot out the possible entry and exit points in an order when the Parabolic Sar experiences a display below the market price or above the market price respectively.
The indicator can also be used by traders or investors to determine the next move an asset if it is going to be in a bullish or bearish trend. Over a period of time, Parabolic Sar changes it direction which is determined by the influence of buyers or sellers investing in the asset. So, by the time the parabolic sar is displayed below the market price showing a bullish move then touches the market price can give a trader a good indication that the market price is about to reverse, likewise in a bearish direction.
Practice (Only Use your own images)
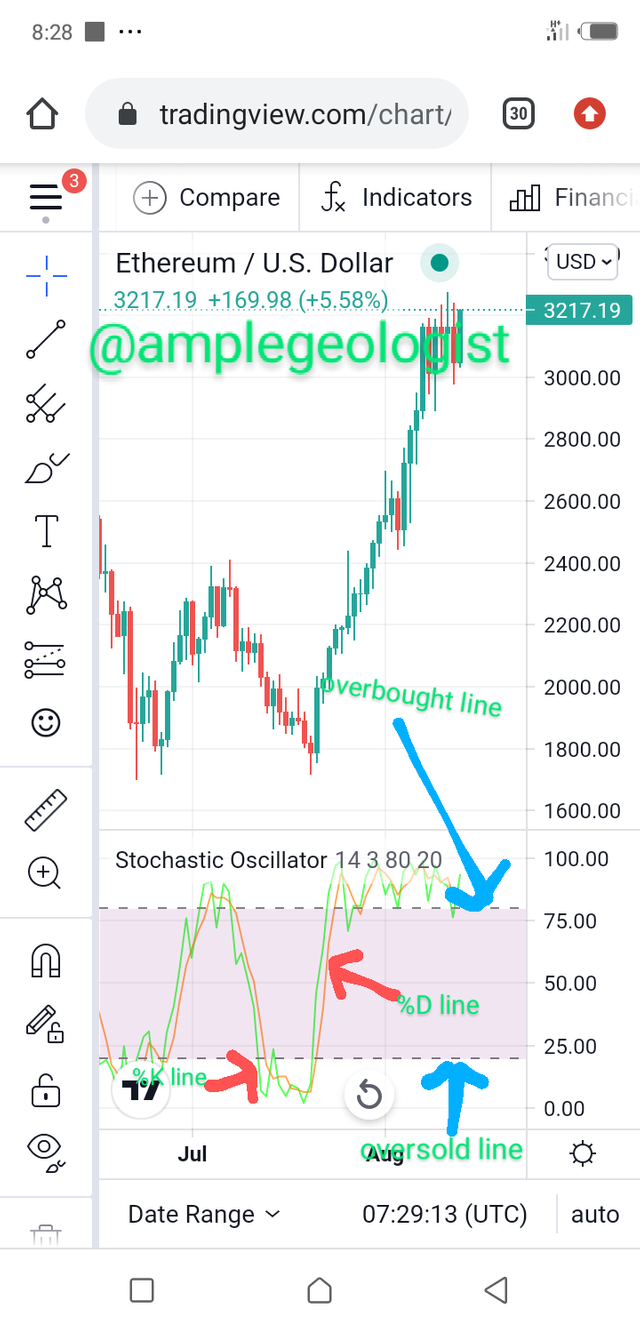
It shows a step by step on how to add the Stochastic Oscillator to the chart (Indicating the% k Line and the% D Line, the overbought and oversold zone.
For this task, I will be showing a step by step way of adding the Stochastic Oscillator indicator to the chart.
First, you have to visit: https://www.tradingview.com/
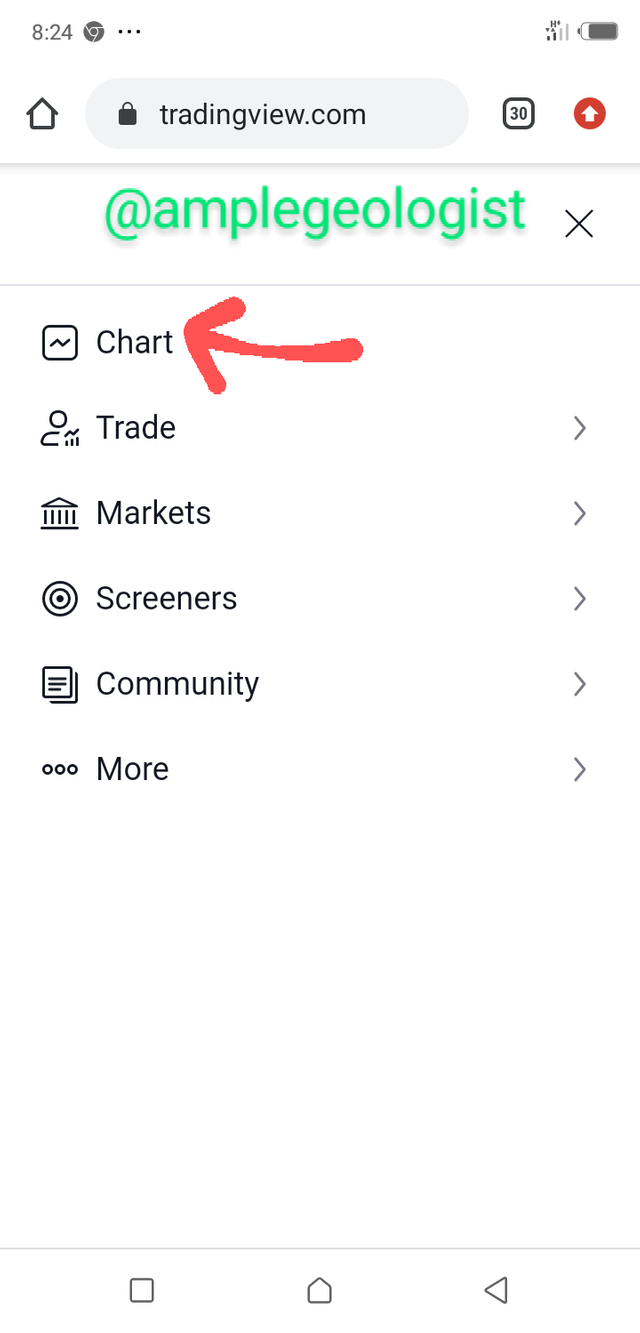
Then I clicked on the “Menu” bar at the top left corner of the opening page, this took me to a new page where I clicked on the “Chart” option

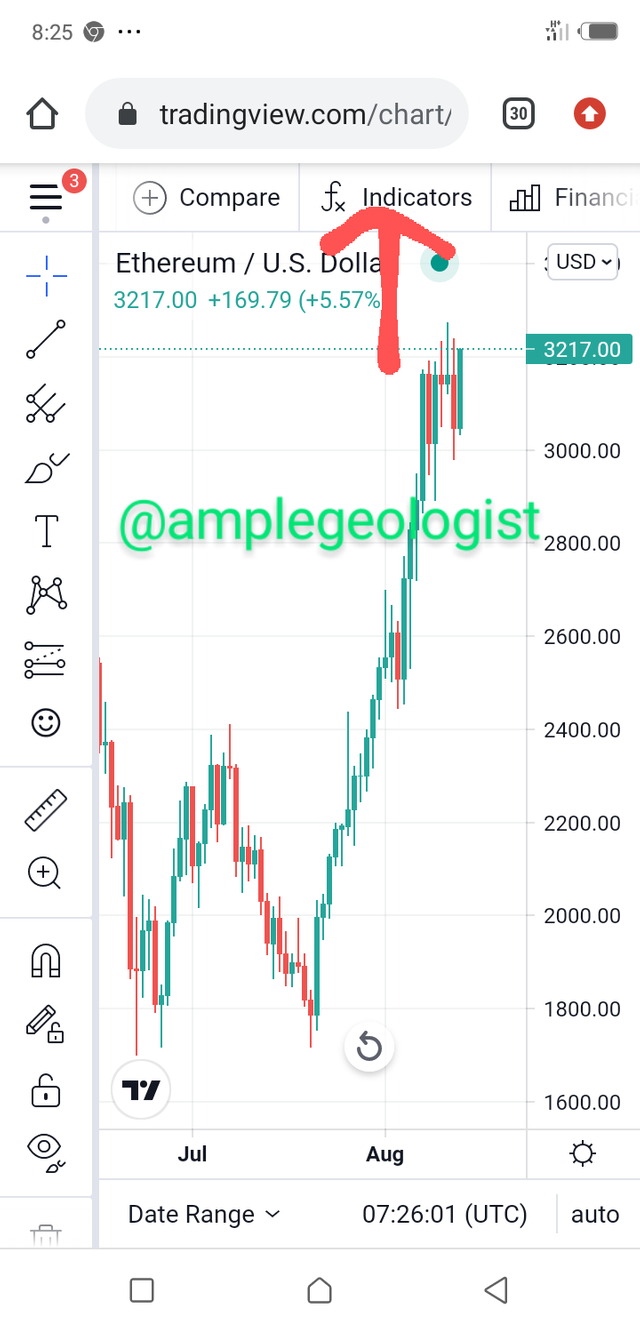
After clicking on the chart option, it redirected me to the charting interface where I now clicked on the “indicator” icon at the top corner of the page.
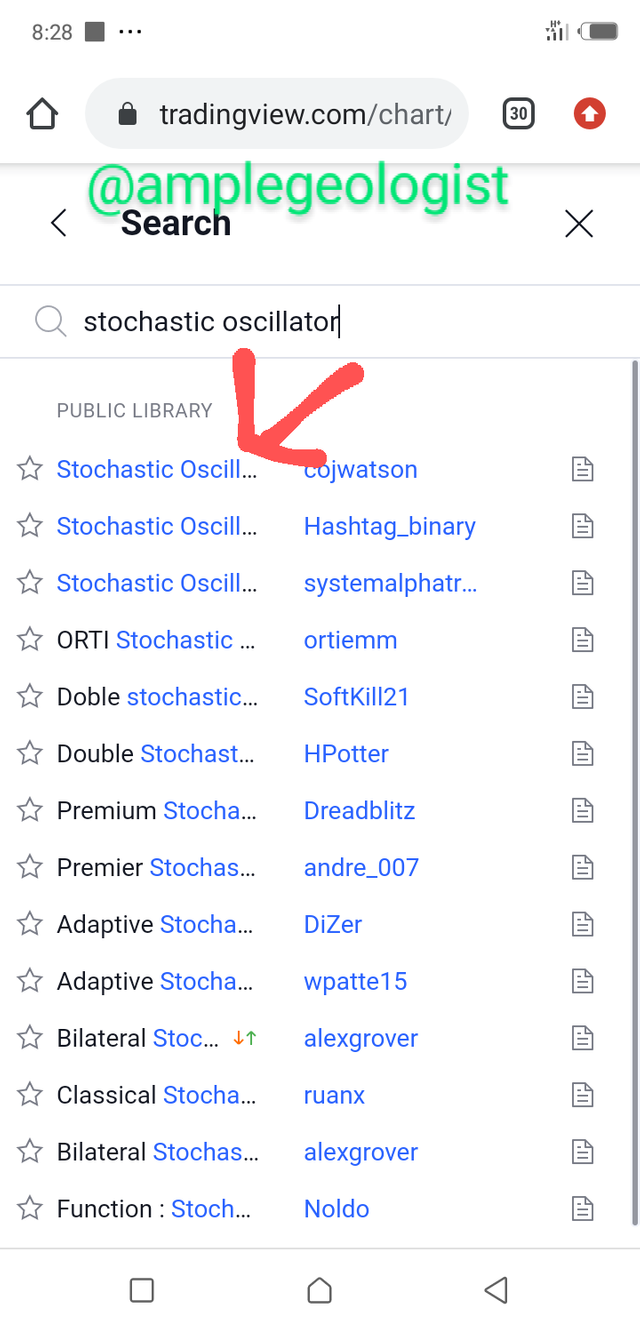
After clicking the indicator icon, a pop out window showed where I then searched for the Stochastic Oscillator indicator and it displayed, then I clicked on it and it was added to the chart as shown below.
Show step by step how to add Parabolic Sar to the chart and how it looks in an uptrend and in a downtrend.
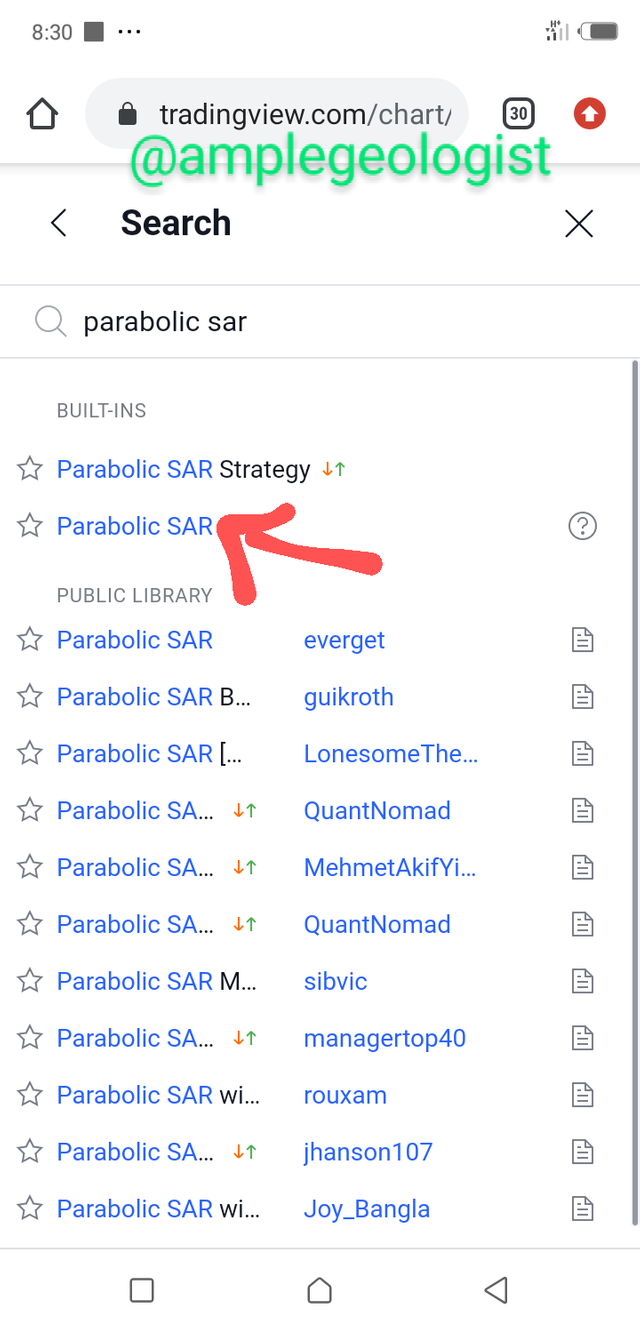
For this task, I will be showing a step by step way of adding the Parabolic Sar indicator to the chart.
After clicking the indicator icon, a pop out window showed where I then searched for the Parabolic Sar indicator and it displayed, then I clicked on it and it was added to the chart as shown below.
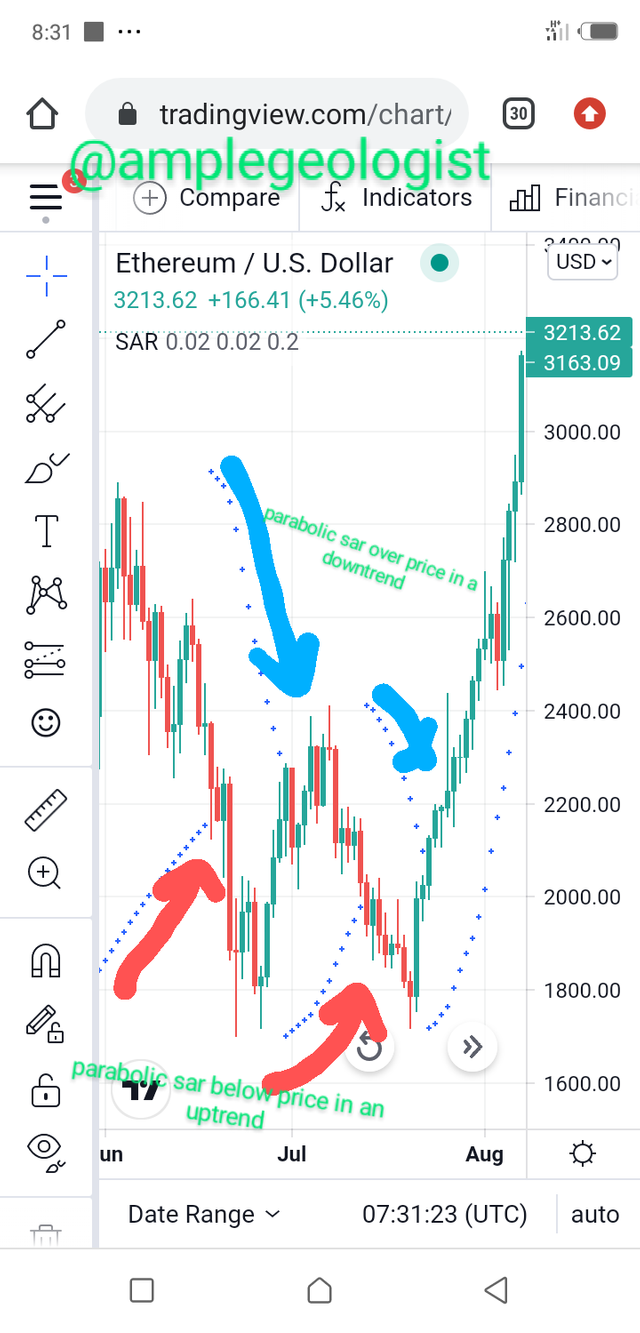
As shown in the snapshot above, in an uptrend, the Parabolic Sar dots is identified with the red arrow and that of the downtrend is indicated with the blue arrow.
Add the two indicators (Stochastic Oscillator + Parabolic Sar) and simulate a trade in the same trading view, on how a trade would be taken.
For this task, I will be adding the Stochastic Oscillator indicator and the Parabolic Sar indicator to the chart.
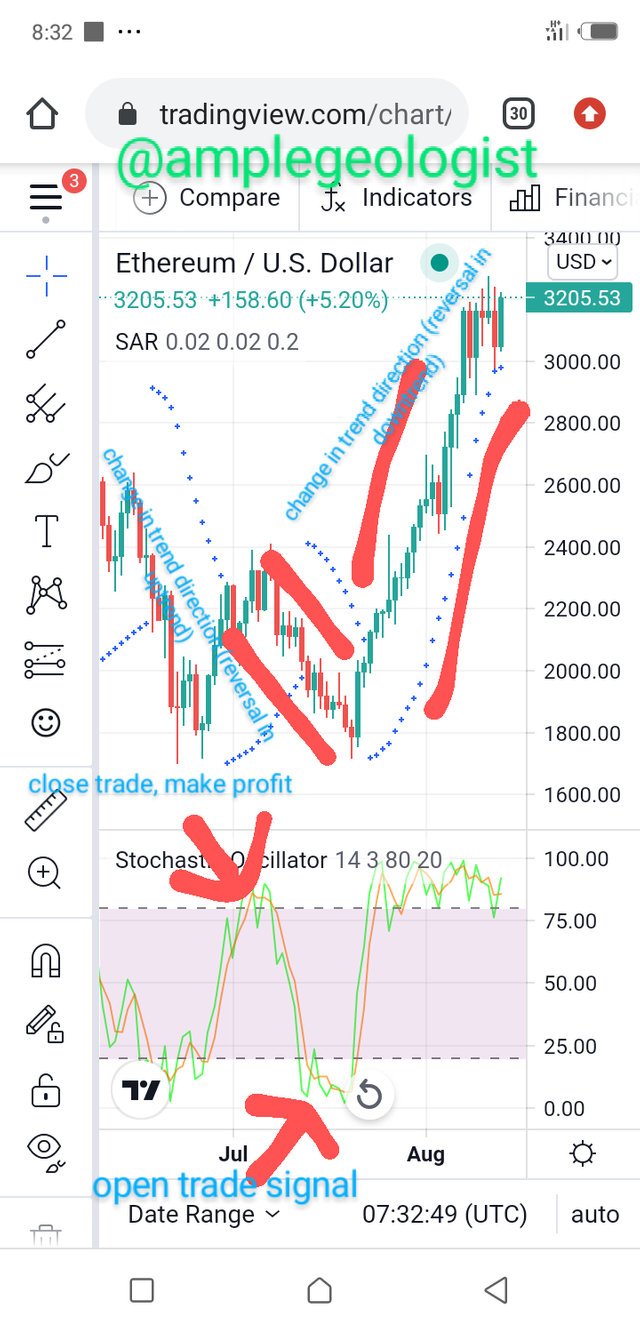
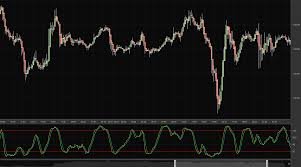
Looking at the above chart, the two indicators are reoresented. The green line (%K line) crosses the red line (%D line) at the overbought zone, thus indicating a good signal for reversal in the trend, as a trader this is the right time to close my trade to make profit.
In the parabolic sar,the trend direction also changes from bullish to bearish.
And also, as the green line (%K line) also crosses the red line (%D line) at the oversold zone, there is a signal for reversal of the trend and as such a right time to open my trade.
The parabolic sar, also indicates a change in trend direction from bearish to bullish.
Conclusion
Stochastic Oscillator and the Parabolic Sar indicators are very vital indicators if used together as it will help a trader or investor to know the best possible time to open and close a trade, it will also give a trader an insight on how the trend or price of asset will be. So as a trader, deep understanding of indicators should be carried out for optimal output with regards to the volatile market of assets.
Thank you Prof. @lenonmc21 for this wonderful lecture series, it was quite an interesting one.