Crypto Academy / Season 3 / Week 5 – Homework Post for [professor @lenonmc21] Trade with ‘Simple and Exponential Moving Averages’ + application of ‘Fibonacci Retracements’
Am gladdened once again for yet another opportunity of this wonderful edition by the cryptoacademy. From the lecture offered by Professor @lenonmc21, reading through this lecture series have given me a better insight on trading with ‘Simple and Exponential Moving Averages’ + application of ‘Fibonacci Retracements’. To this, I will be writing based on the task given by the Professor.
Theory (No images)
Define in your own words what are simple moving averages and exponential moving averages
Simple Moving Average
Simple moving average is an indicator line found on the market or price chart of a particular cryptocurrency which helps traders or investors to recognize and identify how the price of an asset is moving in consonant with the period of time. The indicator line comes with diverse colours thus showing trending of a cryptocurrency in the market chart.
Exponential Moving Average
Exponential moving average is also an indicator line found on the market or price chart of a particular crypto asset which also helps traders or investors to recognize and identify how the price of an asset is moving over a particular period of time. Likewise the simple moving average, the exponential moving average takes as important into consideration the recent price movement of a particular crypto asset over a particular period of time. The line also has variable colours. It gives an accurate average of the price trends in a market chart.
Explain how simple and exponential moving averages are calculated
How Simple moving averages are calculated
The calculation of simple moving average can be done simply by adding up the number of closing price of a particular asset together over a particular period of time.
For example, taking into consideration, a paired asset such as EUR/USD placed on an hour chart and the closing price for the paired asset are as follows; $20, $24, $32, and $12 respectively. To calculate the simple moving average of the paired asset will now be (20 + 24 + 32 + 12) ÷ 4 = 22.
Therefore, the simple average of the paired asset = 22
How Exponential moving averages are calculated
In the same likeness, exponential moving average which deals with recent price can be calculated by using the formula:
(Recent price x average of simple moving average) + (Past exponential moving average) = Exponential Moving Average (EMA).
Exponential moving average is calculated by multiplying the recent price by the simple moving average, and the answer is multiplied by yesterday’s exponential moving average.
Briefly describe at least 2 ways to use them in our trading operations
The two moving averages plays a greater role in identifying the possible trend prices of assets in the market chart.
They can be used in determining an obstruction to the movement of an asset, be it in a bullish or bearish trend
They are good indicators which helps traders to identify possible points to which they can open and order as well closing an order to make profit
They are also used in forecasting a reversal direction trend of an asset, especially when the average lines crosses the resistance or support line.
What is the difference between simple moving averages and exponential moving averages (Explain in Detail)
Although the two moving averages are similar and common in terms of their operability, but it has slight differences which are listed below:
The simple moving average calculates with considerations on the average price while the exponential moving average calculates with consideration strictly on the recent or current price of the asset.
The calculations of the simple moving average is easy as compared to that of the exponential moving average which is so complex
In the exponential moving average, there is much sensitivity on the change in price over a period of time as compared to the simple moving average which centered on equal weighting of the values.
Define and explain in your own words what “Fibonacci Retracements” are and what their gold ratios are
Fibonacci Retracement is a technical tool which consists of numbers in sequence used by traders to calculate the swings and pullbacks of an asset. It helps traders to determine the temporary dip occurrence on the trending line of an asset. Fibonacci retracement involves the use of calculated percentages and horizontal lines to indicate a good resistance zone for opening or closing of a trade or a good support zone for the opening or closing of a trade in an asset.
The Fibonacci retracement works in both the bullish trend and the bearish trend. Fibonacci retracement uses mathematical principles to establish its golden ratios. This golden ratios can be gotten by the division of Fibonacci sequence of numbers which starts from 0. How do we calculate this sequence of numbers? by simply adding the first sequence number which 0 to the next one to get the next sequence. Example; 0+1 =1, 1+1 =2, 1+2 =3, 2+3 = 5, 3+5 = 8, 5+8 =13, 8+13 = 21, 13+21 =34 …etc.
These are what we call Fibonacci sequence of numbers – 0, 1, 1, 2, 3, 5, 8, 13, 21, 34, etc.
To calculate for the Fibonacci ratio, the previous number on the sequence is divided by the next number on the sequence as shown below:
0/1 = 0
1/1 = 1
1/2 = 0.5
2/3 = 0.66
3/5 = 0.6
5/8 = 0.625
8/13 = 0.615
13/21 = 0.619
21/34 = 0.618, etc
The following are the most important Fibonacci ratio mostly used by traders: 38.2%, 50%, 61.8% and 76.8%, with the Golden ratio as 61.8% or 0.618.
Fibonacci retracement is a technical indicating tool mostly used by traders to determine pullbacks of price in asset in an uptrend movement so they can take the advantage of correcting their trade by buying or opening a trade. Similarly it also helps traders to take the advantage in a downtrend movement pullbacks of correcting their trade by selling out or closing their trade.
Practice (Only Use your own images)
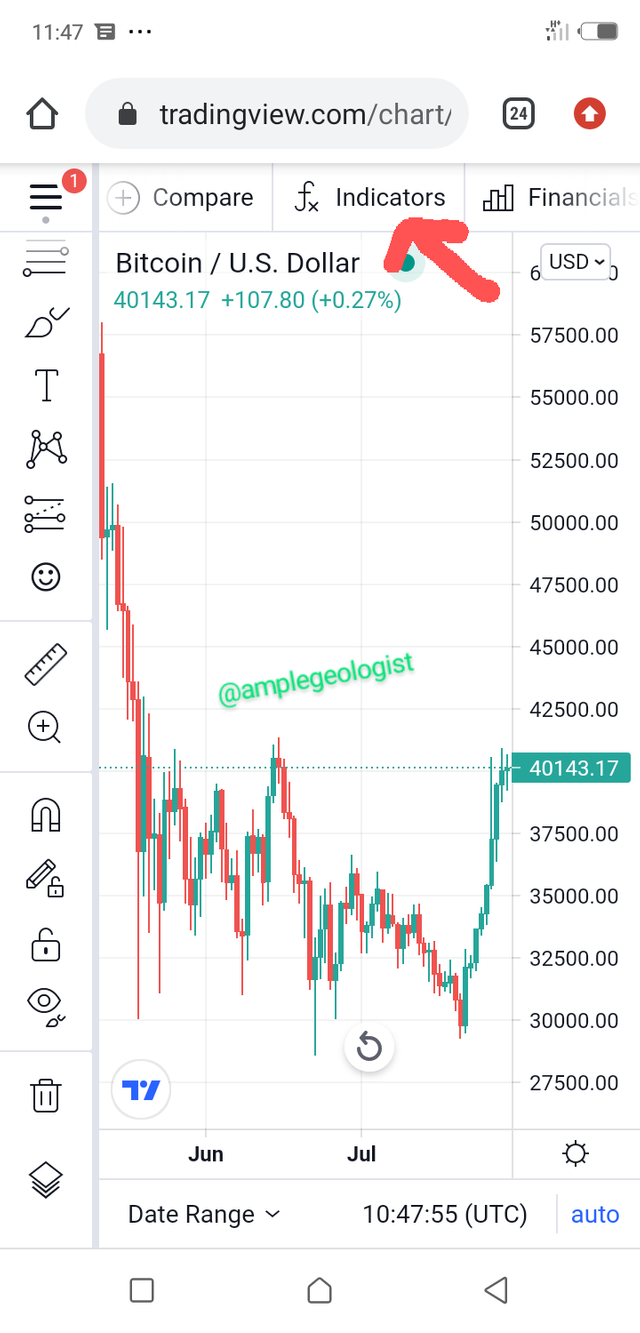
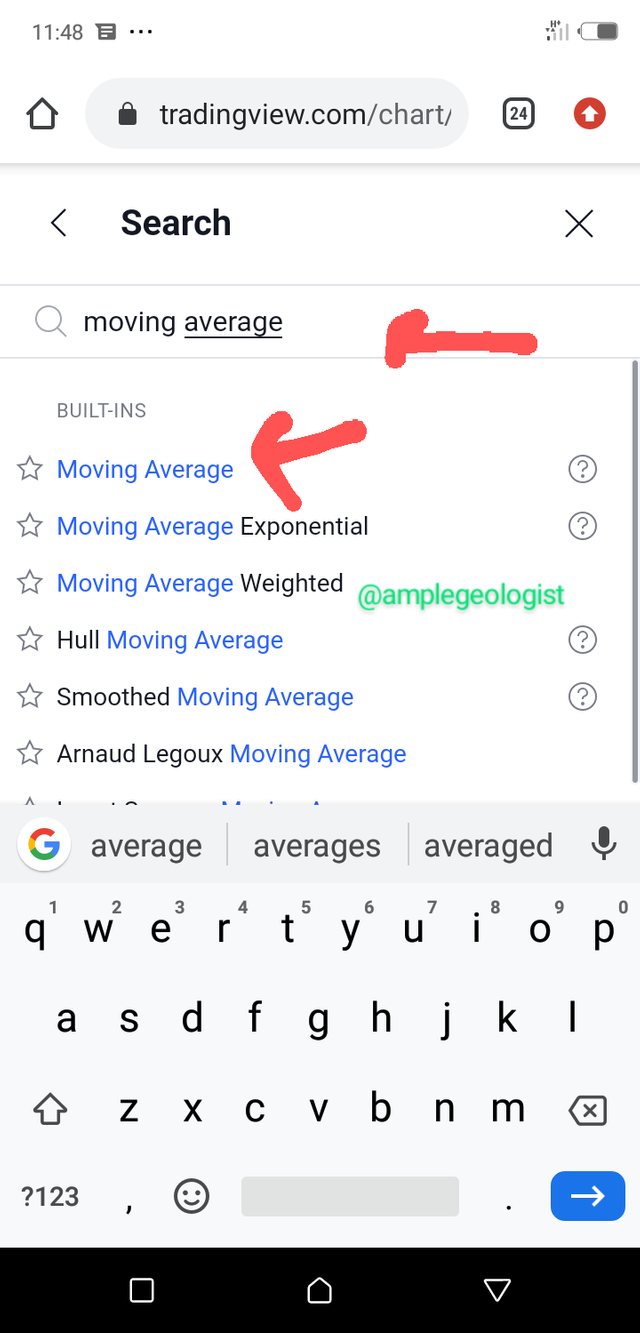
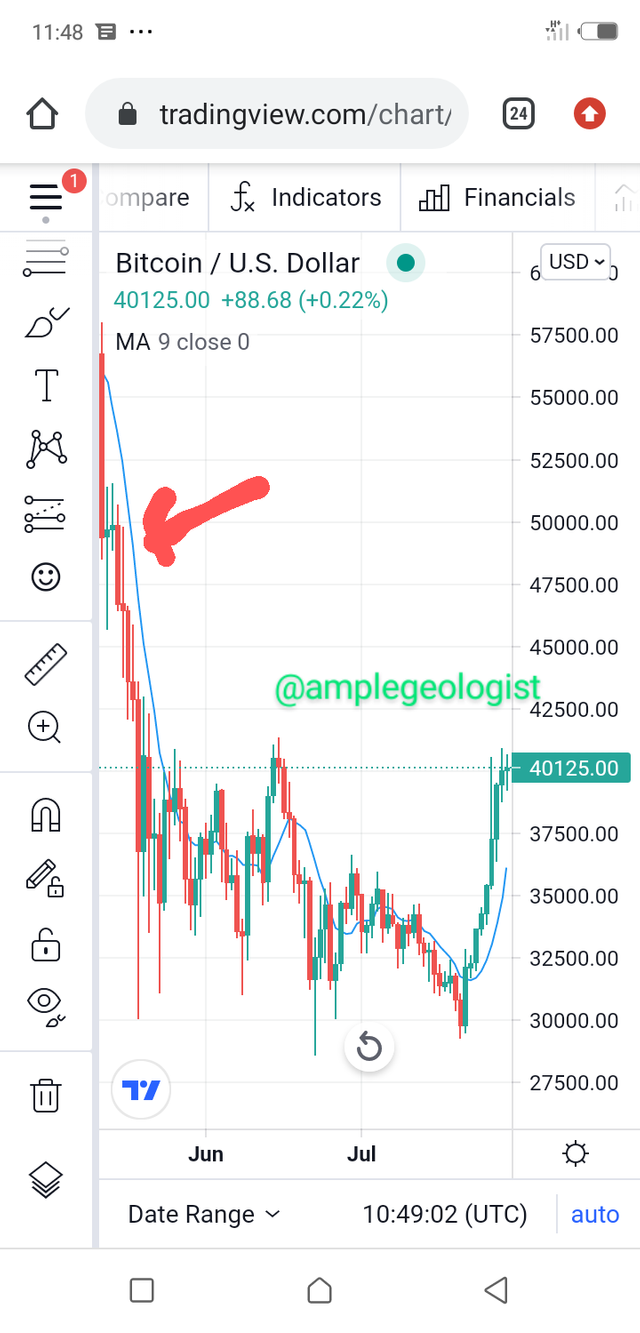
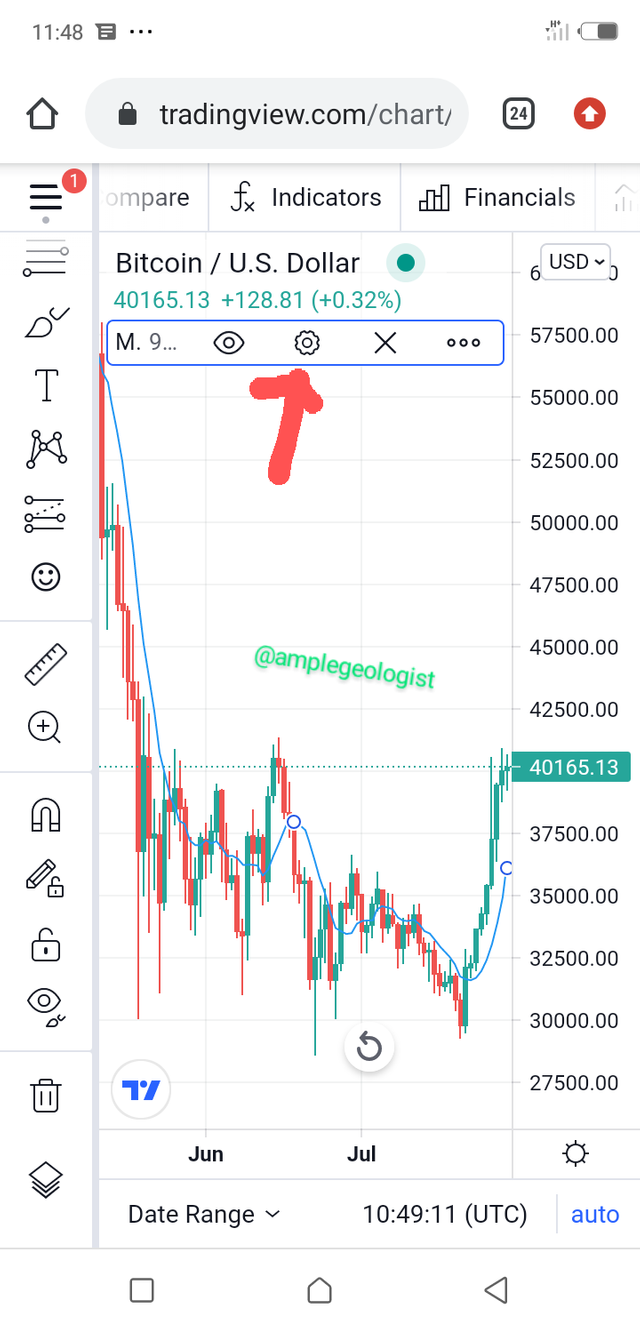
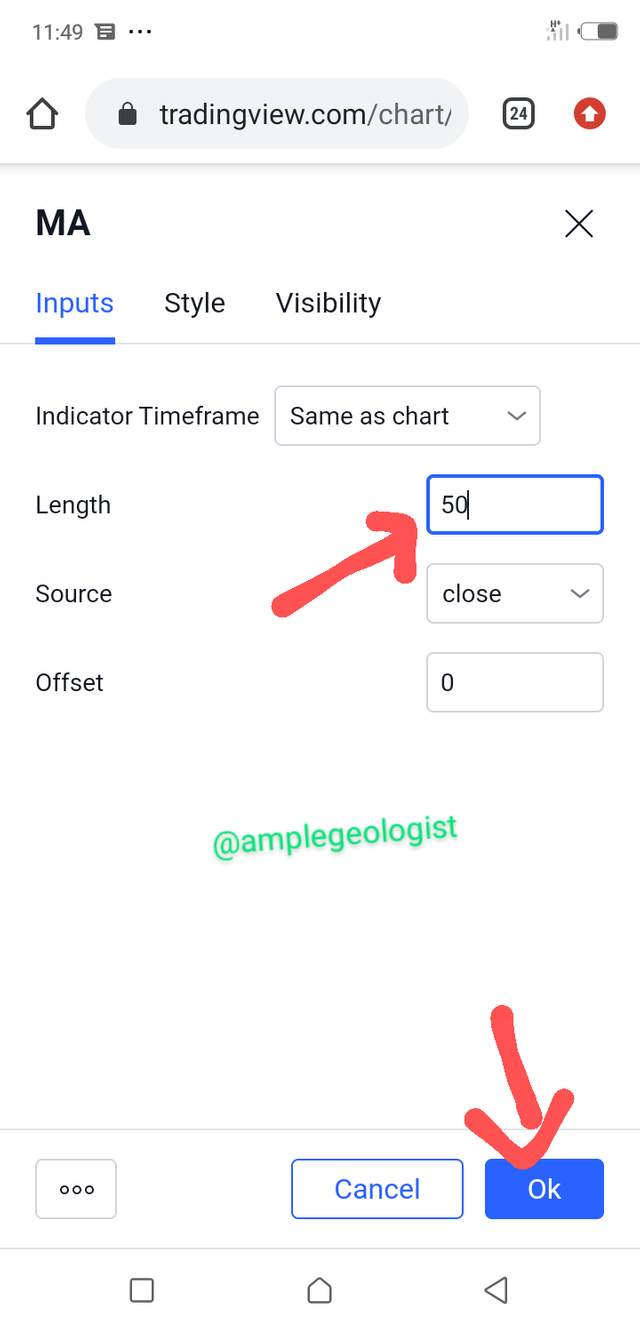
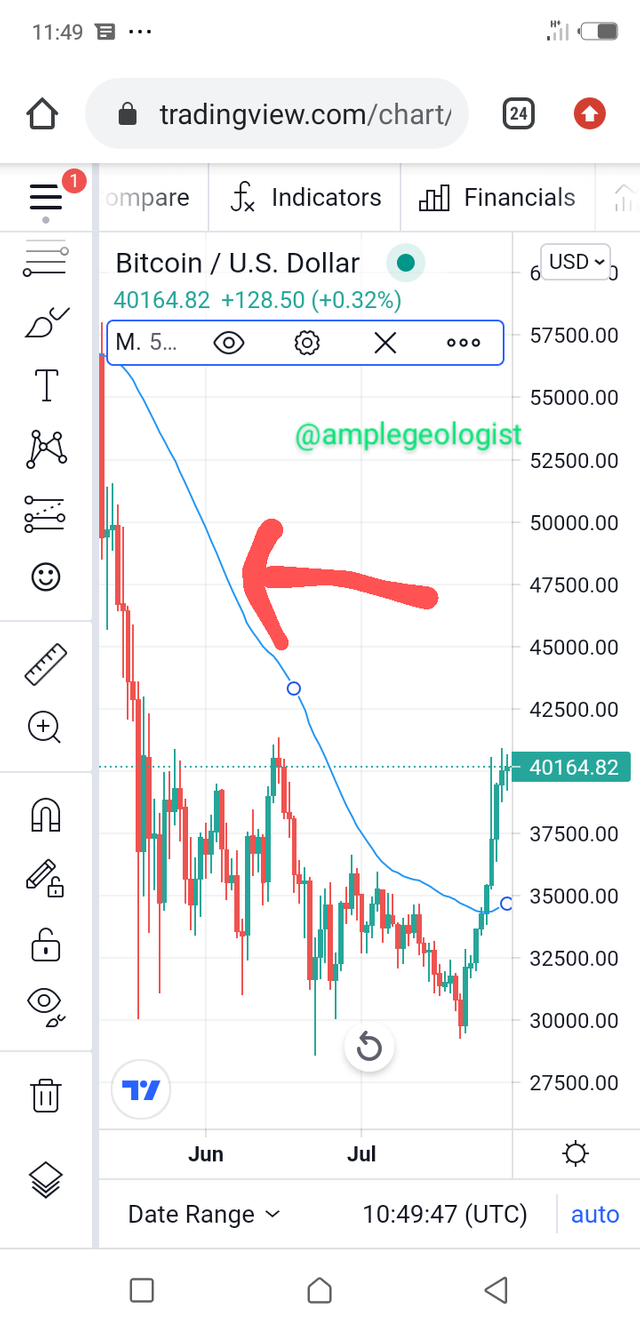
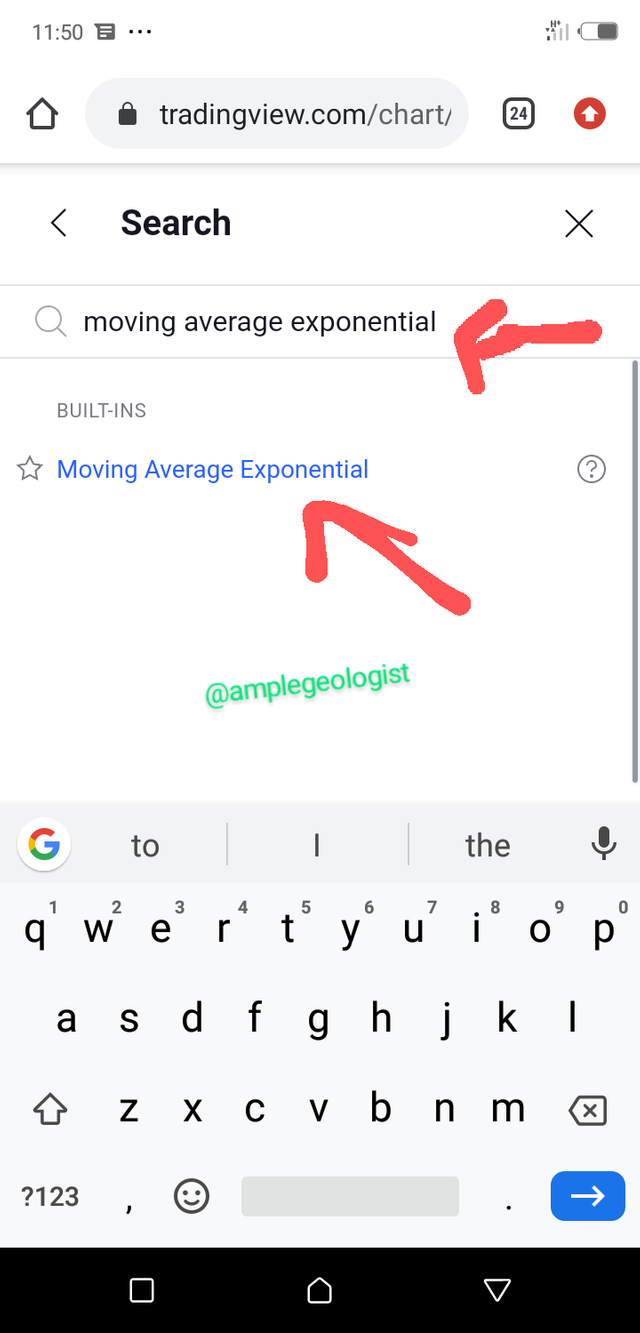
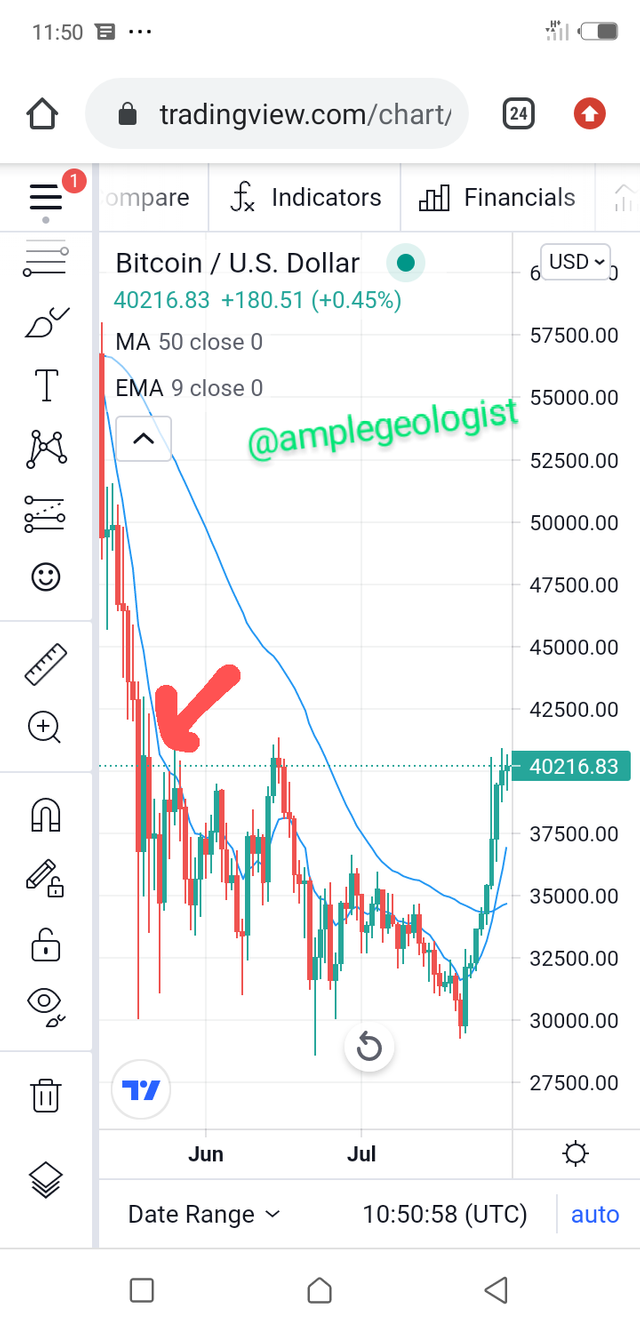
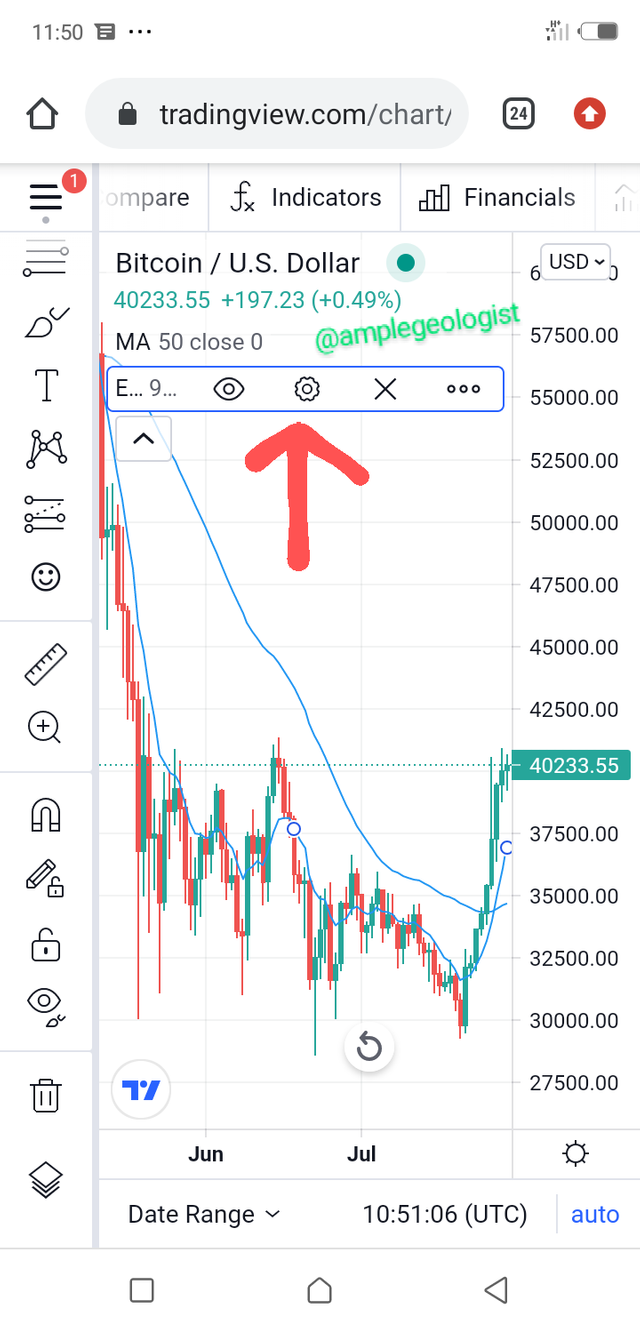
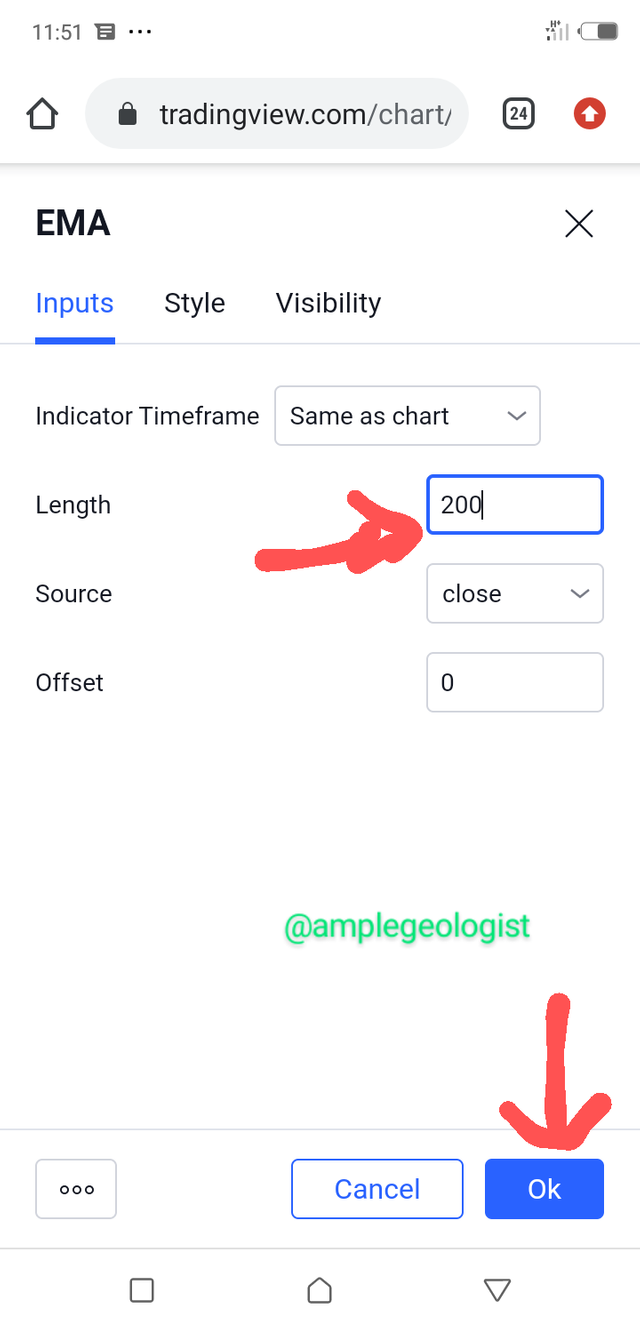
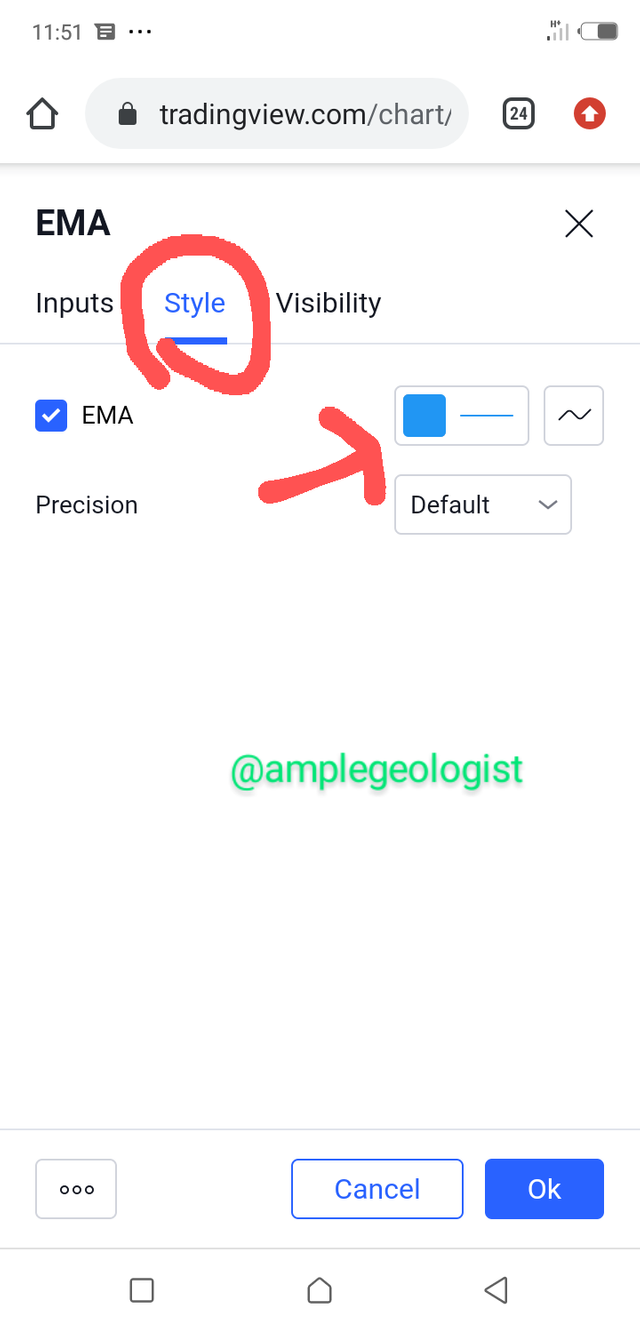
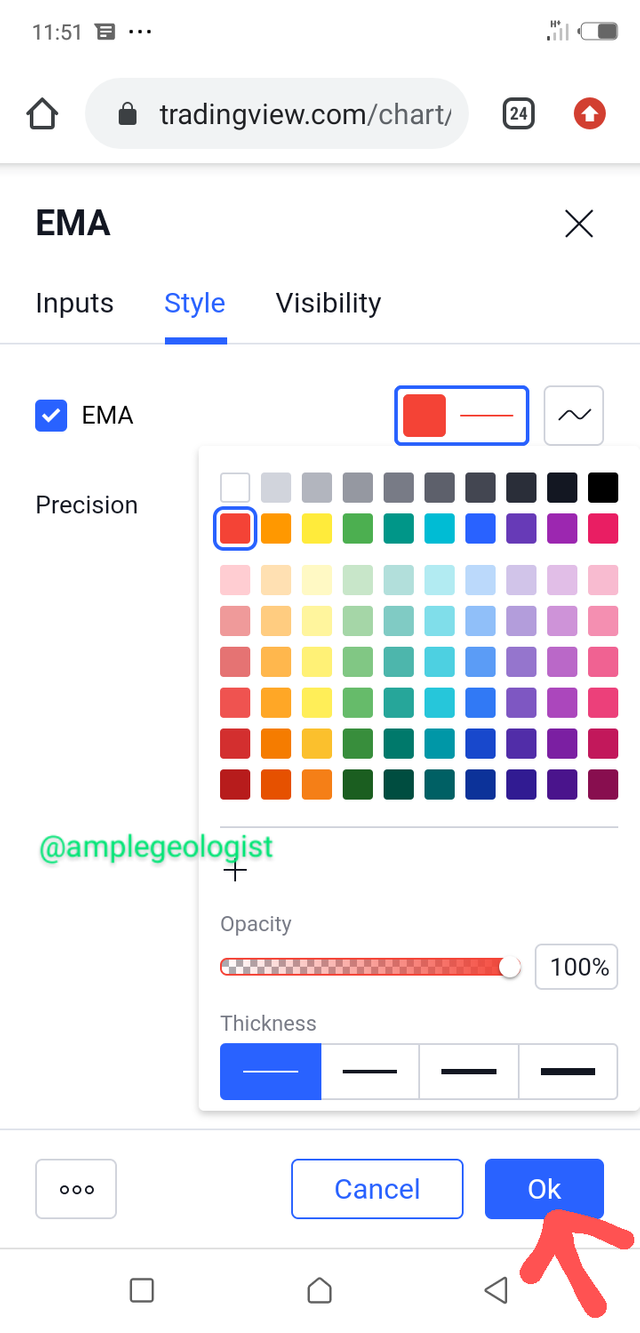
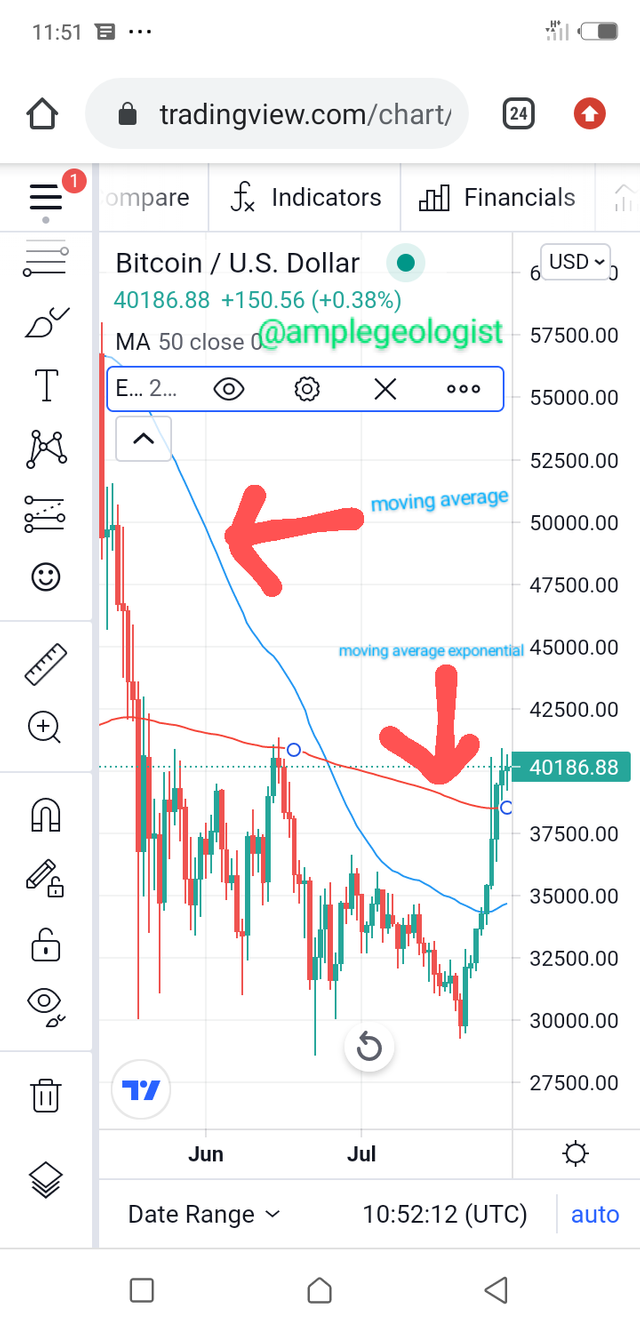
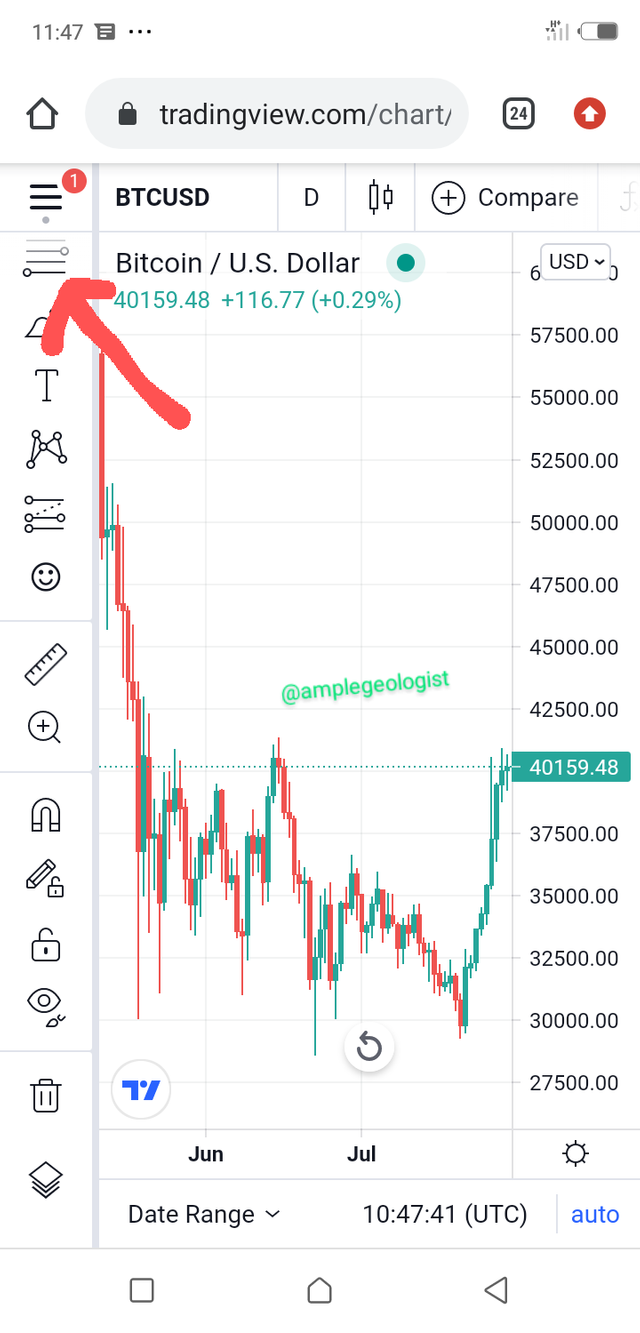
Show step by step how to add a “Simple and Exponential Moving Average” to the graph (Only your own screenshots – Nothing taken from the web)
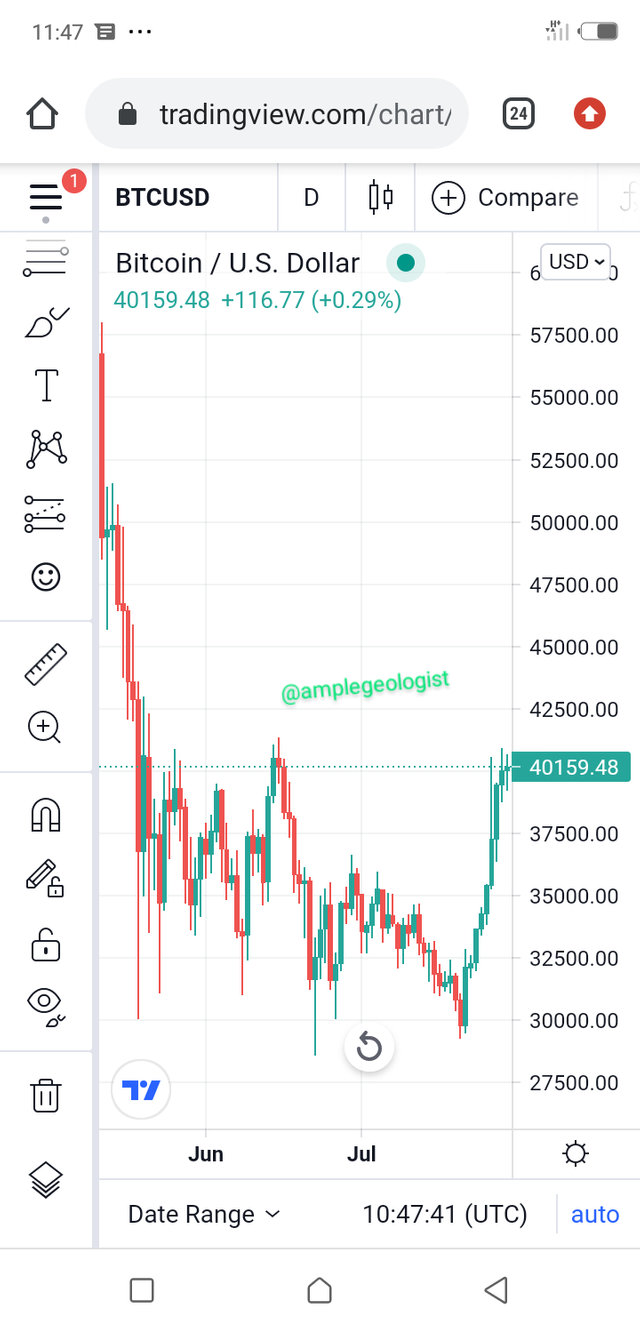
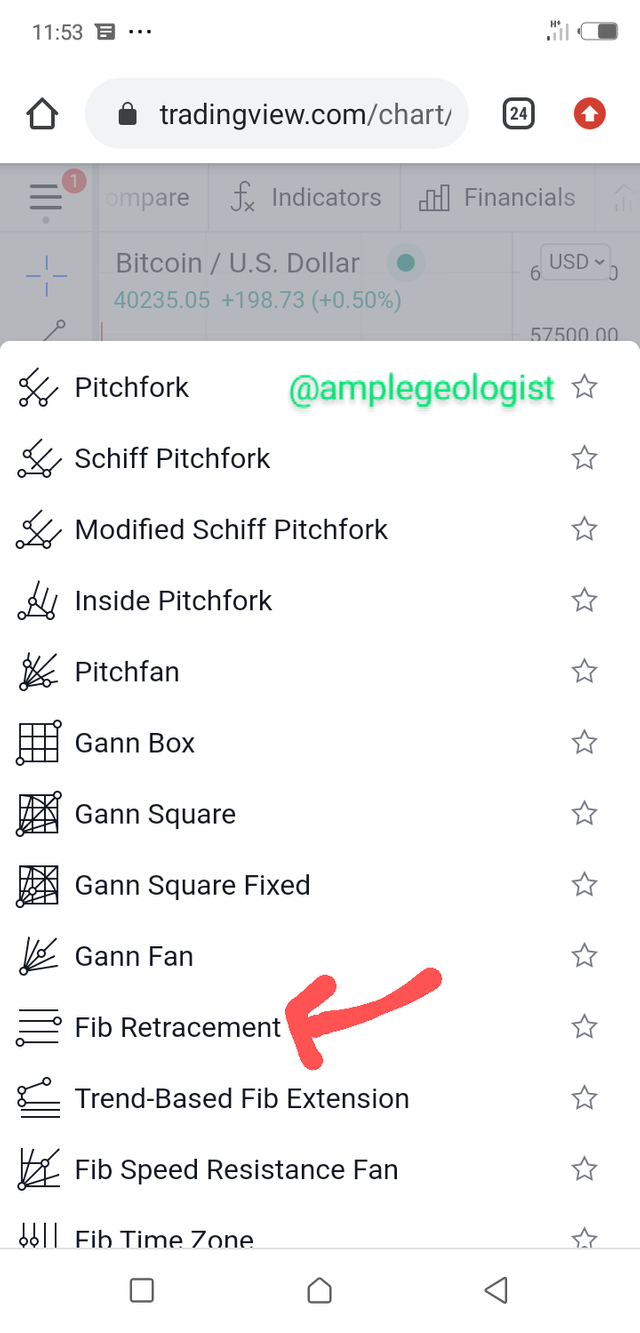
First, visit the URL - https://tradingview.com/, then follow the steps below:


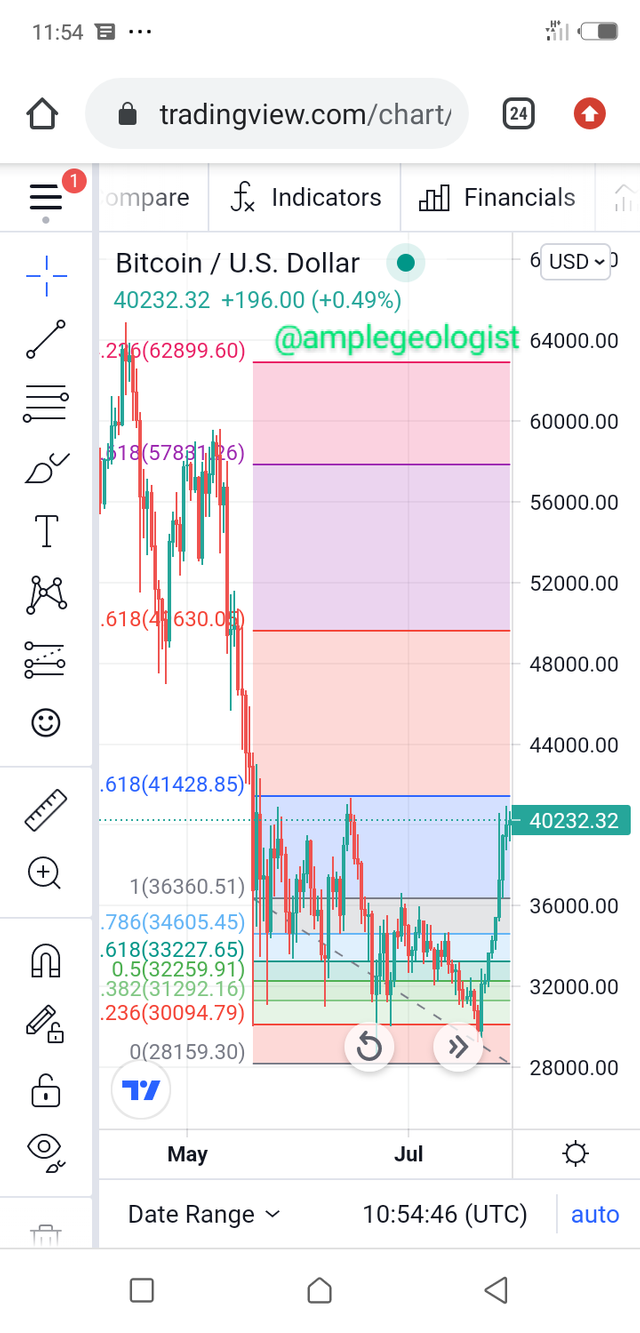
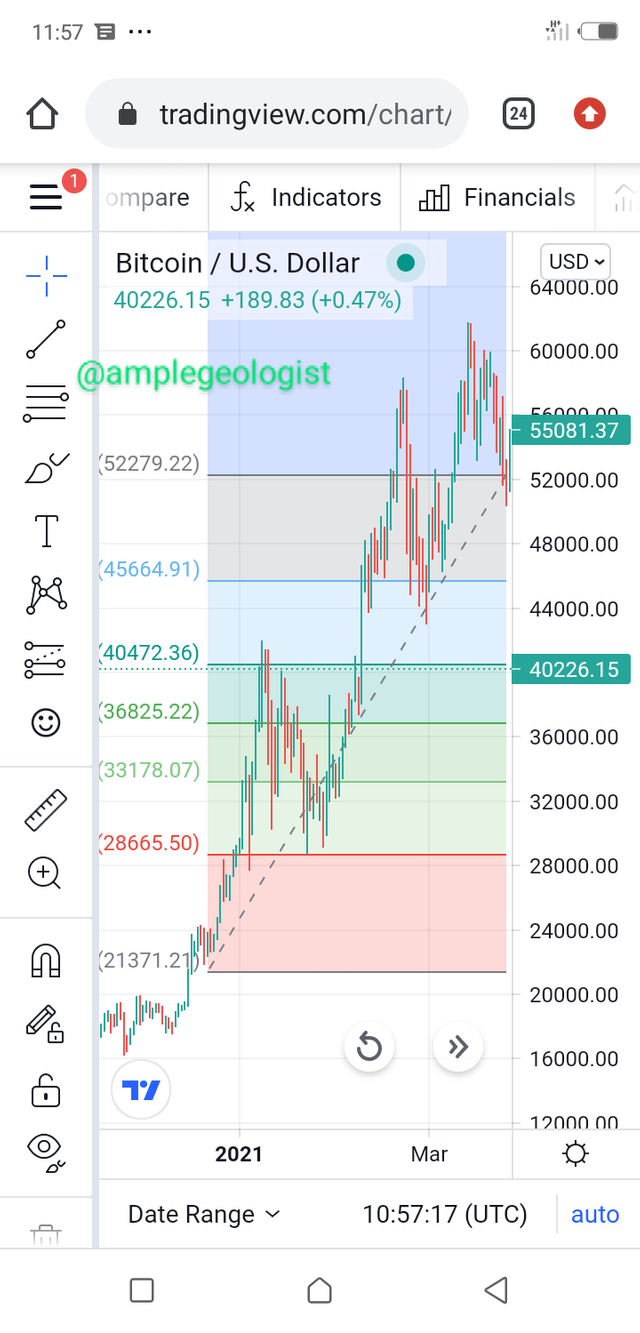
Use “Fibonacci Retracements” to chart a bullish and bearish move (Own screenshots only – Nothing taken from the web)
As seen in the screenshot below is a bearish move calculated by the Fibonacci retracement chart
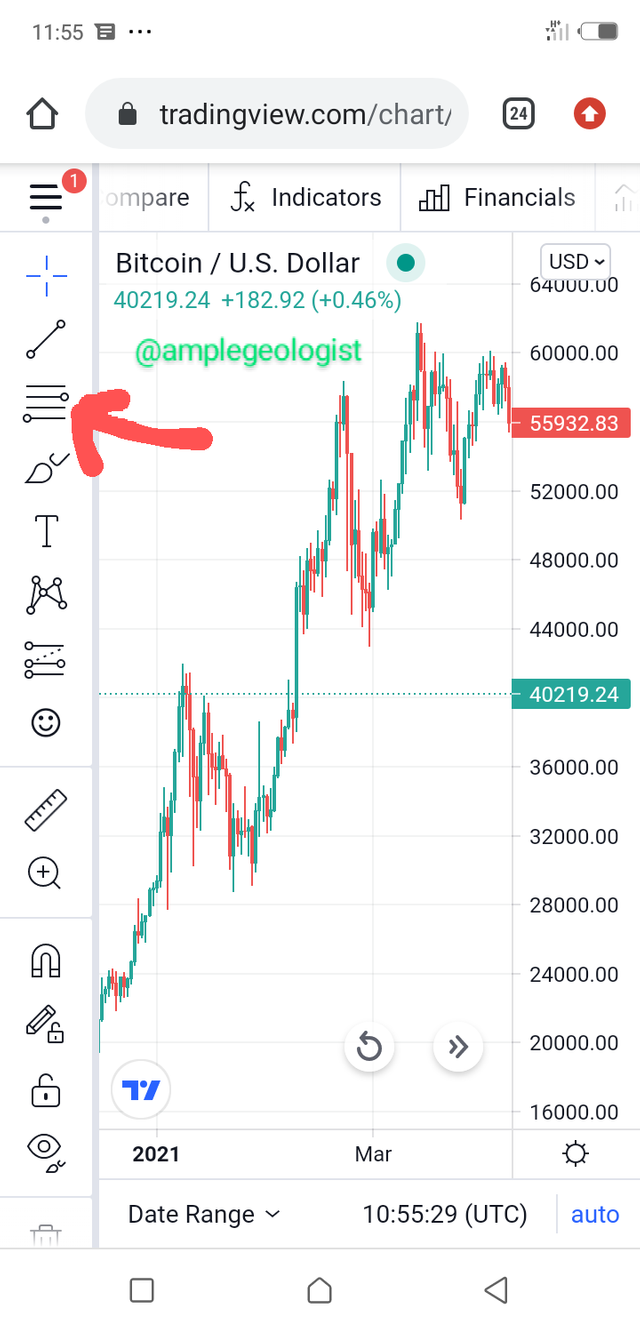

As shown below is the bullish move calculated by the Fibonacci retracement chart
Conclusion
Moving averages can be seen as one of the important indicators which every trader should embrace. With the understanding of this indicators, it helps traders to know the possible yielding time for a trade to be open and also for a trade to be closed.
Thanks Prof @lenonmc21 for this wonderful lecture series, it has been one of the lectures have learnt new things that I never heard of.