Candlestick pattern - Steemit Crypto Academy Season 4 - Homework Post for Task 10
Hello everyone.
Today I will be participating in a Beginners'course by @reminiscence01 that is based on the candlestick and the benefits we get from it.
QUESTIONS.
1a) Explain the Japanese candlestick chart? (Original screenshot required).
b) In your own words, explain why the Japanese Candlestick chart is the most used in the financial market.
c) Describe a bullish and a bearish candle. Also, explain its anatomy. (Original screenshot required)
1a) Explain the Japanese candlestick chart? (Original screenshot required).
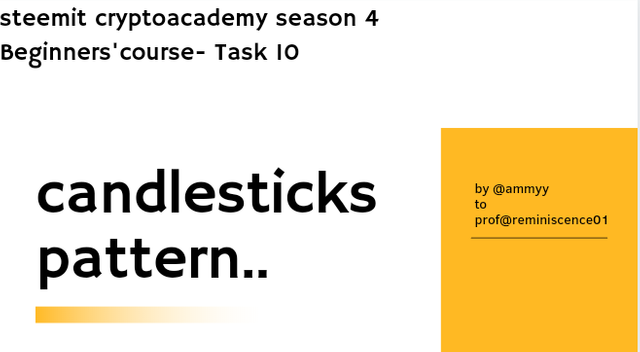
Japanese candlestick is a form of technical analysis which are used by traders to analyze and chart the price movement of an asset. Traders use the Japanese candle stick to make decisions on the short-term direction of the price through identifying the pattern of price action.
The Japanese candlestick was developed by MUNEHISA HOMMA. Who is a Japanese rice trader. HOMMA developed the candlestick because he observed that the rice market was influenced by the emotions of traders which works with the effect of demand and supply on the price of rice.
The Japanese candlestick was developed in 1724s, when the Japanese stock market began in 1870s, the homma's candlestick methodology was incorporated by the local technical analysts to use in the trading process.
Steve nison who is an American technical analyst made the technique known through his book titled "Japanese candlestick charting technique".
• With the help of Japanese candlestick, it provides accurate and more detailed information about price movement.
• Japanese candlestick provide a graphical representation of demand and supply during each periodic price action.
• Japanese candlestick shows the opening, closing, high and low price point at a given period.
b) In your own words, explain why the Japanese Candlestick chart is the most used in the financial market.
I will be highlighting why the Japanese candlestick is mostly used in the financial market.
It helps traders to anticipate their next moves through giving them the reliable visual historical display chart to know how the asset behaves and make them position themselves in the aspect of when to buy/sell or hold. It makes it easier to identify the market pattern.
Japanese candlestick are simple and easy to understand even for beginners through the customized color that shows the uptrend and downtrend of a particular asset which I will explain later in question c.
The Japanese candlestick is filled with important information that contains details about the high, low, open and close of a particular asset which gives traders a reliable information on how to carry out their investment plans. Which means you can see the direction of the market easily.
The Japanese candlestick can also be paired with other supporting indicators to obtain a maximum result. Because when you combine two or more indicators it makes the results more accurate then believing in one Indicator which may not be 100% accurate.
c) Describe a bullish and a bearish candle. Also, explain its anatomy. (Original screenshot required)
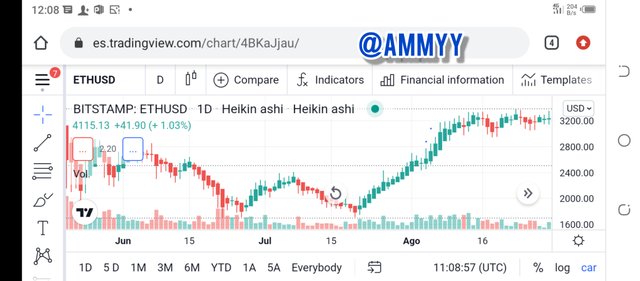
BULLISH CANDLE:
The Bullish candle is represented as the green candlestick which is used to show how the price movement increase in an asset at a particular period. When a Bullish candle is present it simply means an increase in price in the future.
Note that the closing price of a particular asset that is experiencing Bullish is higher than the opening price.
Open price:
- the open price is were the trend begins it means/indicate that the price will move in a Bullish direction.
Close price :
- These helps to indicate the end price of the candle at a particular period. It is the last price of the candle and it is higher than the open price.
High price:
- It is the highest price throughout the bullish period, the price can be higher than or equal to the close price of an asset.
Low price:
- It is the lowest price throughout the Bullish period, the price can be lower than or equal to the open price of an asset.
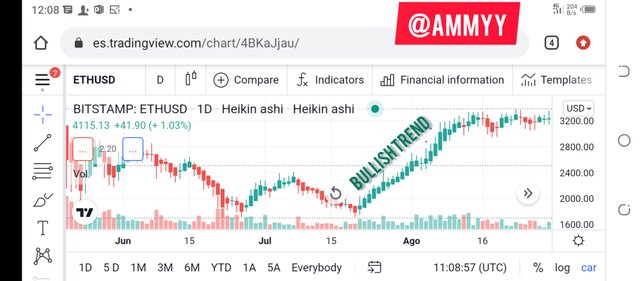
BEARISH CANDLE:
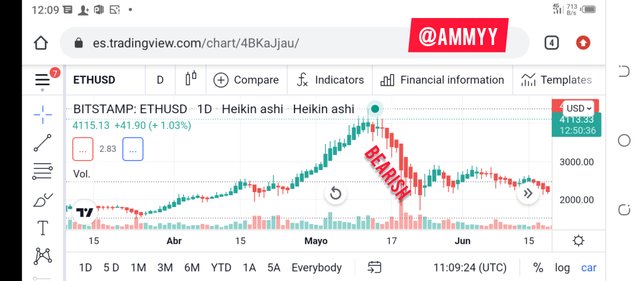
The bearish candlestick is used to identify the price movement of an asset decreasing during a particular period. The bearish is represented as the red colour. It indicates the reduction of an asset price in the future but it serve as an opportunity for traders to accumulate assets and invest for the future.
Open price:
- It shows the start of a price in a particular asset and it is a way to identify that the price will move in a Bearish direction.
Close price :
- It is the end price of an asset and the opening price is higher than the close price because bearish is about decreasing.
High price:
- It is the highest price or value the asset hit, the price can be lower or equal to the open price
low price :
- It is the lowest price or value the asset hit, the price can be lower or equal to the close price.