Basic trading strategy using the Harmonic AB = CD + Fibonacci pattern - cryptoacademy S4W2 - Homework position for @lenonmc21

.png)
QUESTION 1.
Define In Your Own Word What Harmonic Trading Is ?
What is Fibonacci retracement ?
Fibonacci retracement are parts of technical analysis which predict future price in the market and it is used by traders to identify the upcoming resistance and support which are gotten from past price action. An upcoming resistance and support cannot be identify without the historical price action.
There are different types of harmonic Trading which are:
- AB = CD Bullish/Bearish.
- ABC Bullish/Bearish.
- Butterfly Bullish/Bearish.
- Bat Bullish/Bearish.
- Shark Bullish/Bearish.
- Gartley Bullish/Bearish.
- Shark Bullish/Bearish.
- Crab Bullish/Bearish.
But today we would be discussing on AB = CD Bullish/Bearish.
QUESTION 2.
Define And Explain What The Pattern AB = CD is And How We Can Identify Them ?
1). AB = CD Bullish:
First off Bullish means when a trader believe the price will go higher from the current position, Bullish means buying like placing orders.
In AB=CD BULLISH to know the next future Bullish movement, the current price has to fall / go down. Indication is done through point A,B,C and D. You have to find the 4 points that are decreasing together at the same price rate, to verify if it is valid and clear we have to use the Fibonacci retracement and there are some specific steps to be considered.
In the movement A and B, there must be no Secondary movement that goes beyond point A or point B.
Point C must be lower than point A. Fibonacci retracement of the AB movement must be from 61.8% and 78.6%.
Point D must be between 127.2% and 161.8% if the Fibonacci retracement of the movement between BC.
2).AB=CD Bearish:
In the movement A and B, there must be no Secondary movement that goes beyond point A or point B.
Point C must be higher than point A. Fibonacci retracement of the AB movement must be from 61.8% and 78.6%.
Point D must be between 127.2% and 161.8% if the Fibonacci retracement of the movement between BC.
QUESTION 3
Clearly describe the entry and exit criteria for both buying and selling Using the AB=CD Pattern?
ENTRY.
- Identify the 4 movement ( A,B,C and D).
- After that has been found apply the Fibonacci retracement, remember point C must be between 61.8% and 78.6% and point D must be between 127.2% and 161.8%.
- After point D has been determined and there is a Bearish candle the trader can enter the market.
EXIT.
- To exit the market we must configure our stop loss to be 2% above or below our point D.
- Also if we have a risk point of 2% below or above our point D, there must also be 2% take profit.
QUESTION 4
Make 2 entry (up and down) on any cryptocurrency pair using the AB=CD pattern confirming it with Fibonacci retracement ?
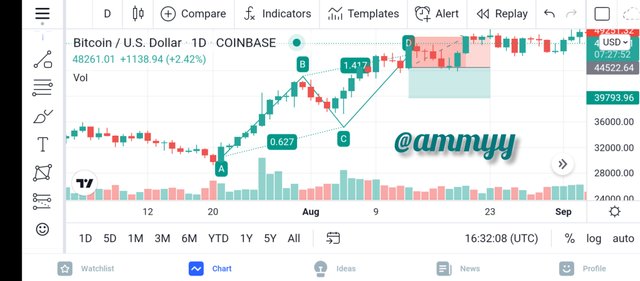
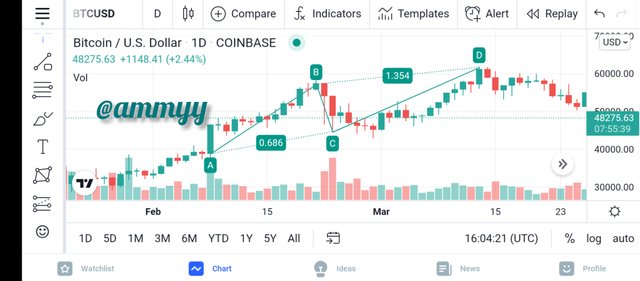
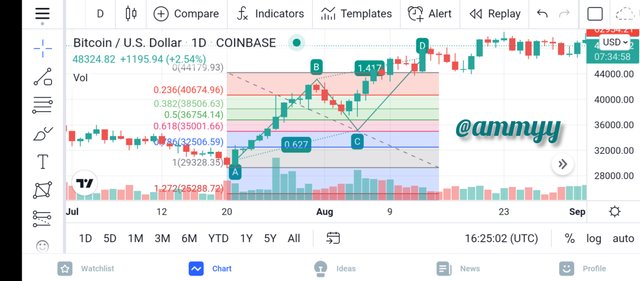
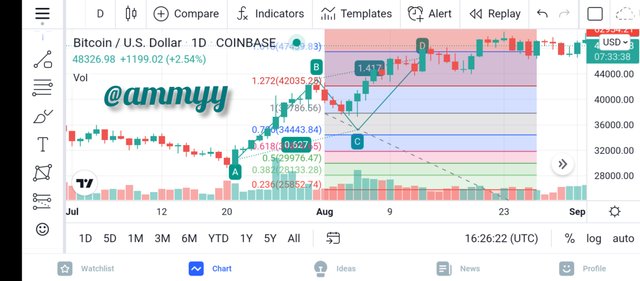
1). AB=CD BULLISH.
working with cryptocurrency (BTC/USD).
Chart gotten from tradingview Applying Fibonacci retracement on point C.
point c in between 61.8% and 78.6%Applying Fibonacci retracement on point D.
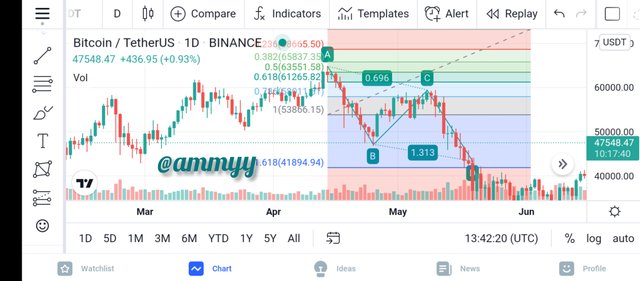
point D in between 127.2% and 161.8%Market entry.
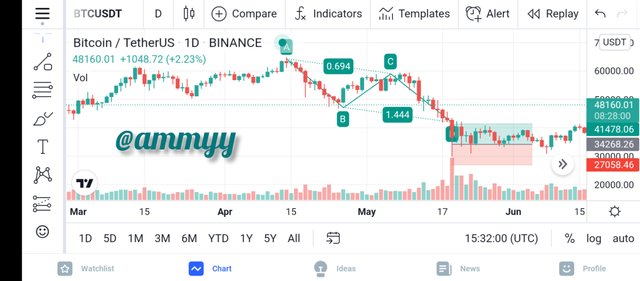
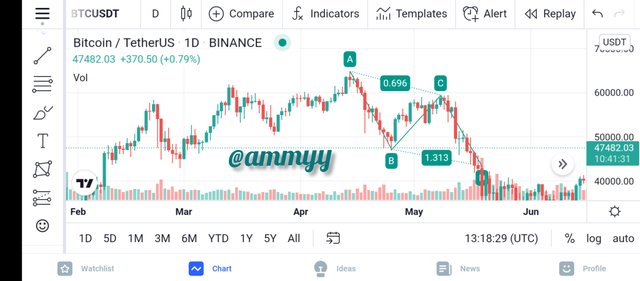
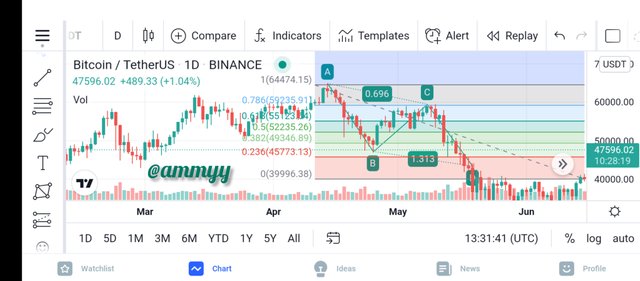
2). AB=CD BEARISH.
- working with cryptocurrency (BTC/USD).
Applying Fibonacci retracement on point C.
point c in between 61.8% and 78.6%Applying Fibonacci retracement on point D.
point D in between 127.2% and 161.8%Market exist.