Crypto Academy / Season 3 / Week 8 - Homework Post for professor @amjadsharif
Greetings to All,
Once again I had to attend the lecture of Prossor @cryptokraze. It was a wonderful lecture. In which I got to learn a good pattern Named Sharkfin.

1- What is your understanding of Sharkfin Patterns. Give Examples (Clear Charts Needed)
It has been observed that the market moves in one direction and this movement is very fast which we call trend. It can be either up trend or down trend.
If a market moving very fast in one direction immediately reverses, then this movement forms a V shape or an inverted V shape. This is called a sharkfin pattern.
Let us now try to find out how V shape and inverted V shape are formed in sharkfin pattern.
When the market is moving very fast downwards it means it is in a down trend and then suddenly starts moving upwards and this movement is very fast then it will appear in V shape on the chart.
Conversely, when the market is moving rapidly upwards, it means that it is in an up trend and suddenly starts moving downwards rapidly and if it moves very fast, it will form an inverted V shape on the chart. This pattern is called the sharkfin pattern.
Example of Sharkfin on Chart:
It can be seen like as on the chart.
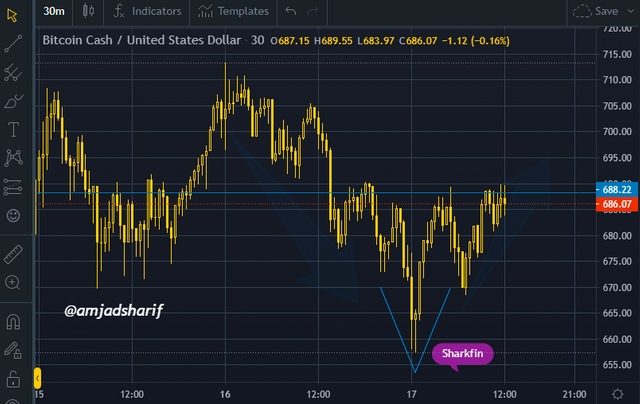
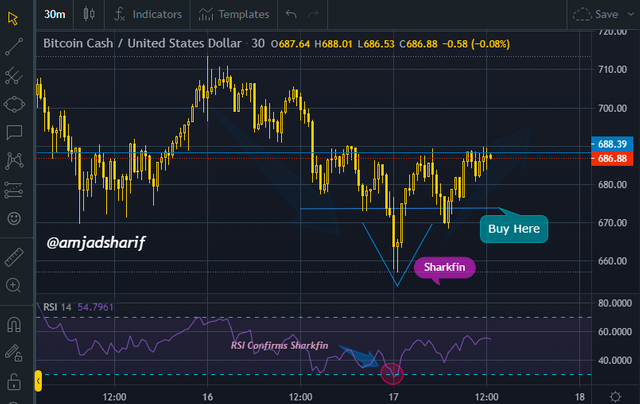
In above chart of BCH/USD 30 munites timeframe, It can be clearly seen that the V shape has been formed in the chart. The market was in a downward trend but suddenly the trend changed and it started moving upwards. This quick Reversal made V-shaped.
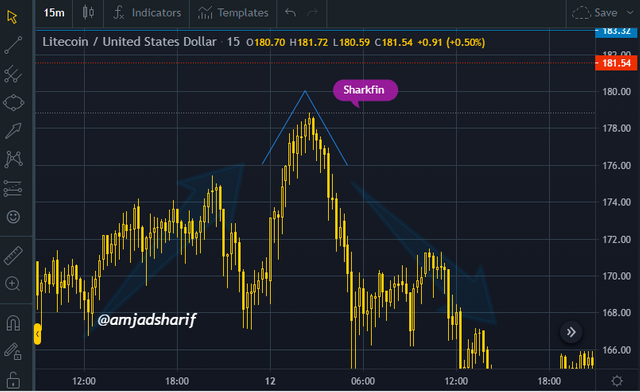
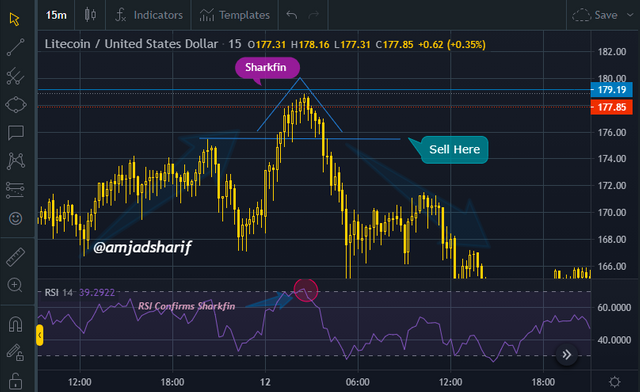
In above chart of LTC/USD 15 munites timeframe, It can be clearly seen that the inverted V shape has been formed in the chart. The market was in a uptrend but it moving downward after quick Reversal. This quick Reversal made inverted V shape.
2- Implement RSI indicator to spot sharkfin patterns. (Clear Charts Needed)
From my own personal observation, it is impossible to analyze the market without an indicator. If you do, you are foolish. It is important to have an indicator on the chart to test any pattern so that you can better analyze the market.
When you see a sharkfin, you have to figure out how it can enter the market with the signal it receives. Because there is no pattern that gives the true signal and sometimes the false signal.
As our esteemed professor has recommended using Relative Strength Index (RSI) with Sharkfin.
Applying Relative Strength Index (RSI) with default setting. Its band will be set at 30 and 70 and its length will be at 14.
The Bullish Reversal Pattern is formed as a result of the end of the down trend of the market. When the market is moving downwards and suddenly starts reversing upwards and a V shape appears on the chart, it will be called bullish sharkfin pattern.
Now we have to see here whether this signal is true or false. For this we will seek the help of RSI. If the RSI is below 30 and crosses the line of 30 from bottom to top after reversal, we will consider it as the correct signal and place a buy position here.
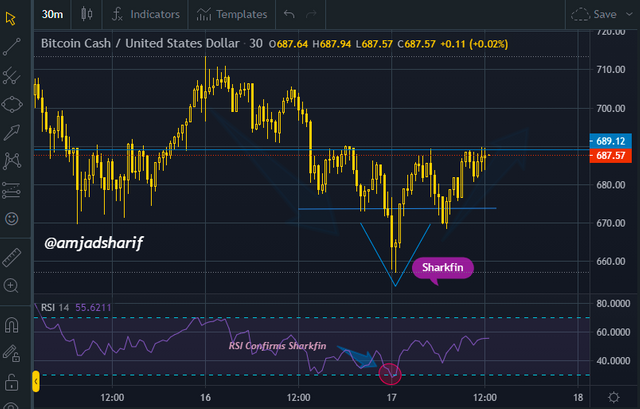
In the above example of BCH/USD M30 chart we can see that RSI confirms Sharkfin pattern as well the level of 30.
On the other hand, the Bearish Reversal Pattern is formed after the end of the uptrend of the market. This is called a bearish reversal pattern when the market is constantly moving upwards and suddenly starts reversing downwards and appears in the inverted V shape on the chart.
Here the line of RSI should be above 70 and when it crosses below 70 after reversal, it will be considered as a correct signal and the trade can be placed here by the Traders.
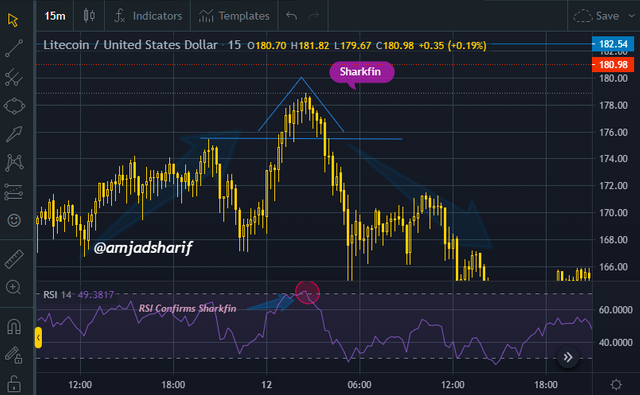
In the above example of LTC/USD M15 chart we can see that RSI confirms Sharkfin pattern as well the level of 70.
3- Write the trade entry and exit criteria to trade sharkfin pattern (Clear Charts Needed)
In order to improve the quality of trade, it is important to explain the criteria of any trade before entering it. One important thing to keep in mind is that cryptocurrency exchanges only have the option to buy. The option to sell crypto assets is available on MetaTrader 4 and Margin Trading platforms.
Entry Criteria for Buy Position:
- The RSI should be added with its default setting. ( Bands 30 - 70, Length 14)
- When the price move is in clear direction and then reverse back quickly to make V shape.
- Confirm that RSI has gone below 30 level and then reversed back above to 30 level by rapidly forming a V shape.
- When RSI gone above 30 level, If it clear then place your buy order.
Entry Criteria for Sell Position:
- The RSI should be added with its default setting. ( Bands 30 - 70, Length 14)
- When the price move is in clear direction and then reverse back quickly to make inverted V shape.
- Confirm that RSI has gone above 70 level and then reversed back below to 70 level by rapidly forming an inverted V shape.
- When RSI gone below 70 level, If it clear then place your sell order.
Trade Exit Criteria:
This criteria is very important for traders to book profit and to prevent loss of assets.
Buy Trade Exit Criteria:
- Stop loss level should be set if the trade goes in wrong direction after entry.
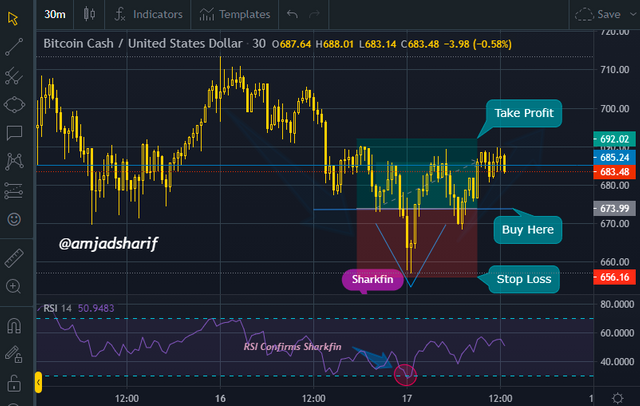
- If you are in a buy position you should place your stop loss level swing low of sharkfin pattern.
- If the price didn't move in our favour and hits the stop loss level, it means our trade setup is invalid and should wait for another.
- Take profit level should be set if the trade goes in our favour and hit the take profit, so we can book profit.
- Take profit level should be 1:1 Risk Reward Ratio. It can be 1:2 or 1:3.
Sell Trade Exit Criteria:
- Stop loss level should be set if the trade goes in wrong direction after entry.
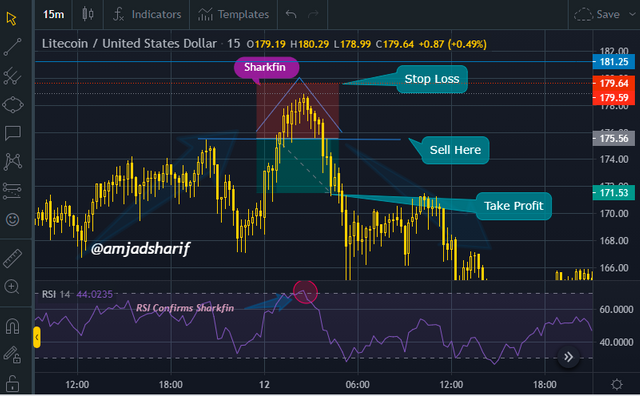
- If you are in a sell position you should place your stop loss level swing high of sharkfin pattern.
- If the price didn't move in our favour and hits the stop loss level, it means our trade setup is invalid and should wait for another.
- Take profit level should be set if the trade goes in our favour and hit the take profit, so we can book profit.
- Take profit level should be 1:1 Risk Reward Ratio.
4- Place at least 2 trades based on sharkfin pattern strategy (Need to actually place trades along with Clear Charts)
I will show you the trades that will take by sharkfin pattern strategy.
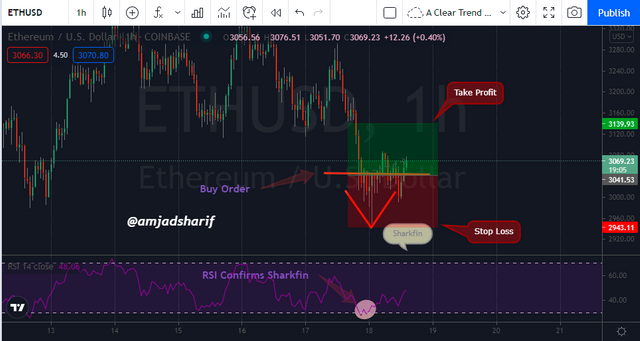
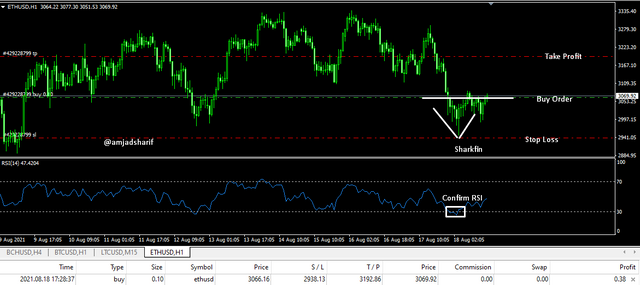
In above chart ETH/USD H1, I have placed buy position after forming sharkfin pattern confirmed by RSI and set take profit and stop loss with the ratio 1:1
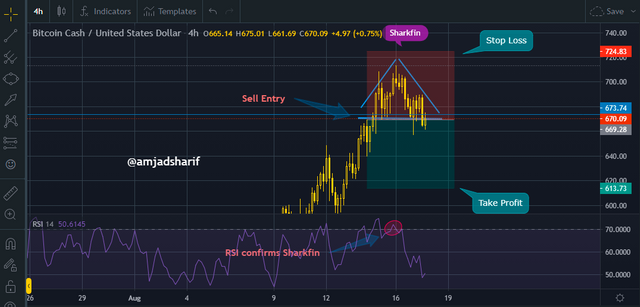
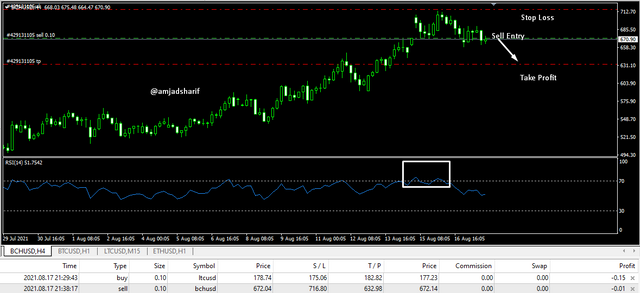
In above chart of BCH/USD H4, I have placed another position of sell after making the inverted V shape on the graph and confirmed RSI. I also set stop loss and take profit to exit the trade if the position is in favour or against.
Conclusion
In this lecture, we have learned a lot about this simple strategy and its entry and exit criteria in both buy and sell. Sharkfin pattern is more reliable with the help of RSI as the professor recommended.
Please add "Trading Sharkfin Pattern" in title of homework post.
Ok done it sir.