[ Highly Profitable Trading Strategy with VuManChu Cipher B ]-Steemit Crypto Academy | S5W6 | Homework Post for @reddileep
Image edited by me in Powerpoint
1. Define VuManChu Cipher B Indicator in your own words.
2. How to customize the VuManChu Cipher B Indicator according to our requirements? (Screenshots required)
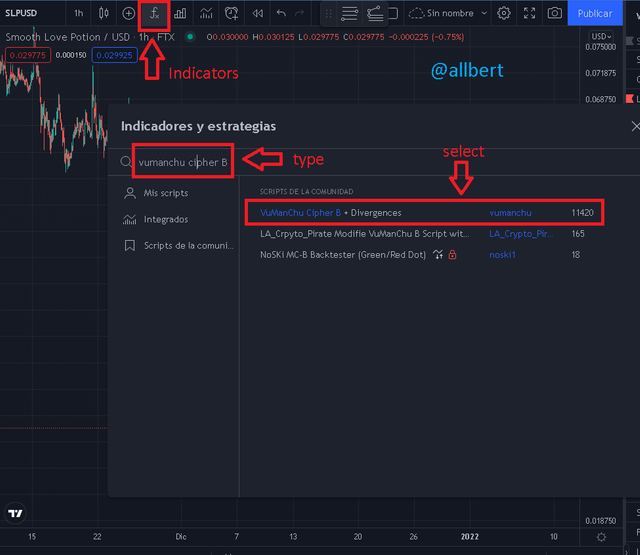
Image taken from: Source
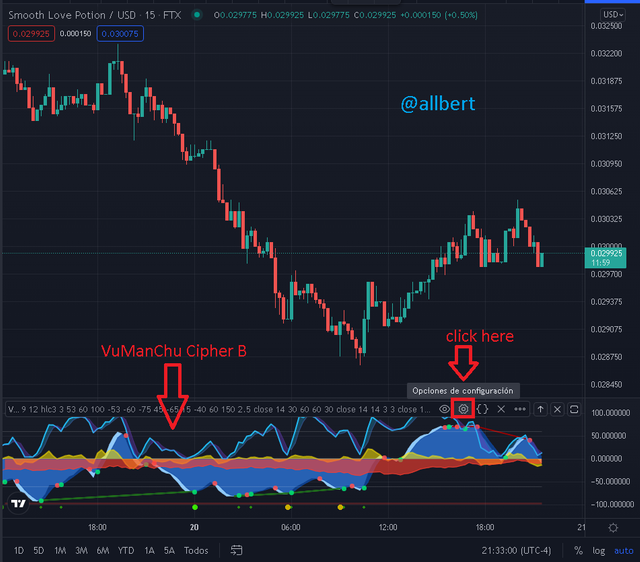
Image taken from: Source
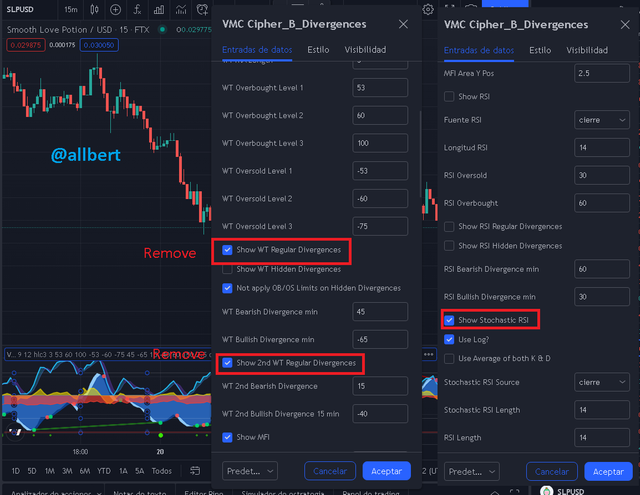
Image taken from: Source
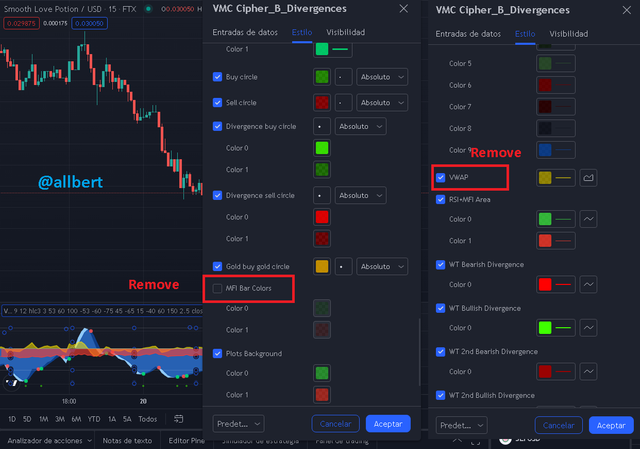
Image taken from: Source
Finally, the VuManChu Cipher B indicator will be clean, with the indicators we need for this trade, which are the Wave Trend indicator and the always useful Money Flow Index, which I will explain in the next question.
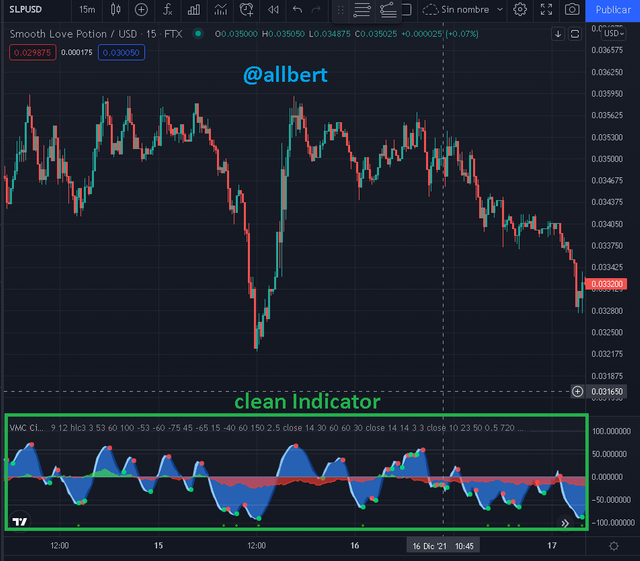
Image taken from: Source
3. Explain the appearance of the VuManChu Cipher B Indicator through screenshots. (You should Highlight each important part of this indicator by explaining their purpose)
Wave Trend indicator
On some sites, I have also seen it as Waves and Dots. This indicator shows us the momentum (bullish or bearish) which is represented by a chart in the form of waves (dark and light blue color) moving around a central zero line. The importance of this indicator is that it shows us the direction of the market as well as buy or sell signals depending on the interaction of the waves to 5 important levels which are: zero line, lines (-60, 60), and lines (-100,100).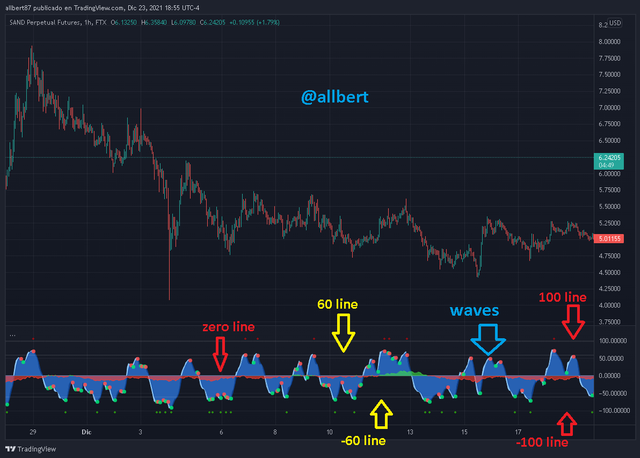
Image taken from: Source
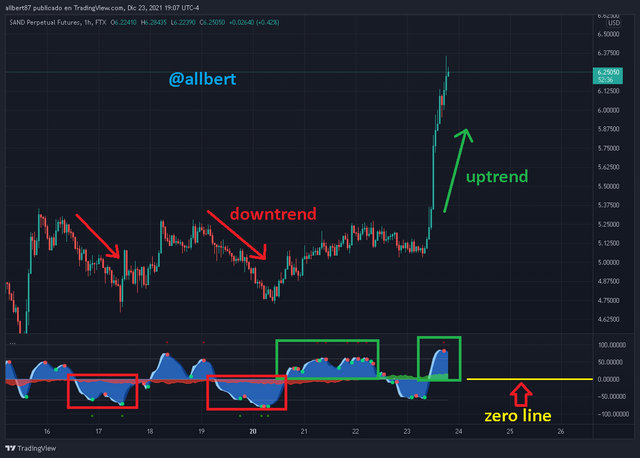
Image taken from: Source
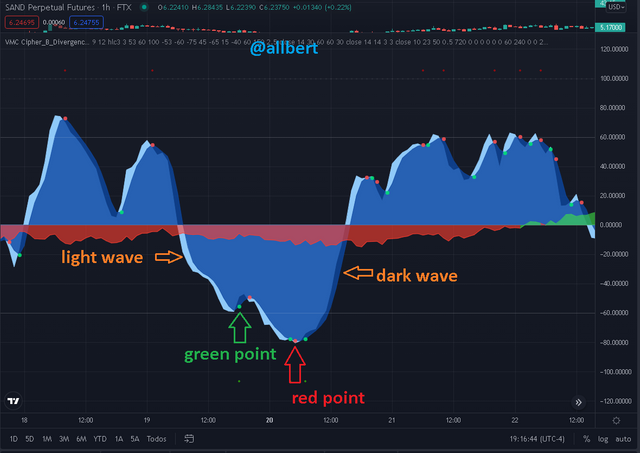
Image taken from: Source
The crossovers between these two waves mark an impending trend change, which in turn are highlighted by the red and green dots that function as indicators of crossovers between the two and signals to place positions.
The red dot signals a trend change from bearish to bullish. On the other hand, the green dot signals a trend change from bullish to bearish. The change of waves will always be from light to dark on both sides of the zero line.Money Flow Index
This element simply represents the money that enters and leaves the asset. This metric as simple as it may seem follows the basic principle of the market, which indicates that when money enters a project, its cryptocurrency starts to become scarce therefore its value increases, and on the contrary, if money leaves, the supply of the crypto asset will increase and its price will fall, hence its importance as an indicator. The money flow index is represented as a curve whose area changes color (between green and red) according to the position in which it is concerning the zero line. This position determines the inflow or outflow of money. So if the curve is above the zero line it will take on a green color and indicate that there is money entering the currency. Interestingly this should be accompanied by an increase in price.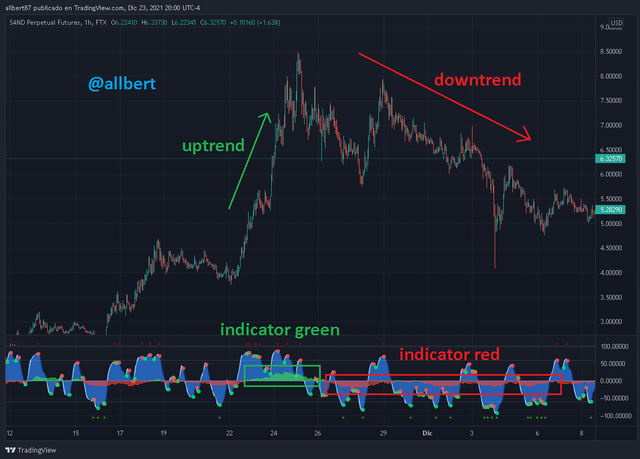
Image taken from: Source
On the other hand, if the curve is below the zero line, it will turn red and indicate that money is leaving the currency. This is usually accompanied by a fall in the price of the asset.
From a practical point of view, the money flow index will serve as an early confirmation in our trading strategy to place entries. An interesting fact that I discovered during my research on the money flow index is that we can anticipate trend changes by studying the behavior of the slope of the curve.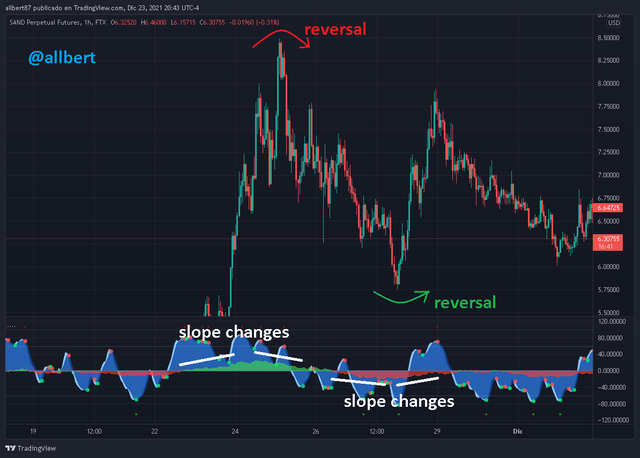
Image taken from: Source
4. Demonstrate your preparation for the Trading Strategy by combining other indicators. (Instead of showing the addition of indicators to the chart, you should explain the purpose of each indicator for this trading strategy.)
We will use the classic EMA crossover strategy where one of the EMA's will be 55 periods and the other 200 periods, where the EMA (55) will behave as a fast curve and more sensitive to market movements, while the EMA (200) will behave like a slow curve more stable.
By using both we achieve a balance in the signals where the crossover between the two represents a trend change and therefore a first entry signal. We will use a 5min timeframe which is optimal for this type of strategy.
First, we must place two EMA's on our chart, and then we must adjust them in the "setup" button to modify their periods. As already said one EMA will be set to 55 periods and the other to 200 periods.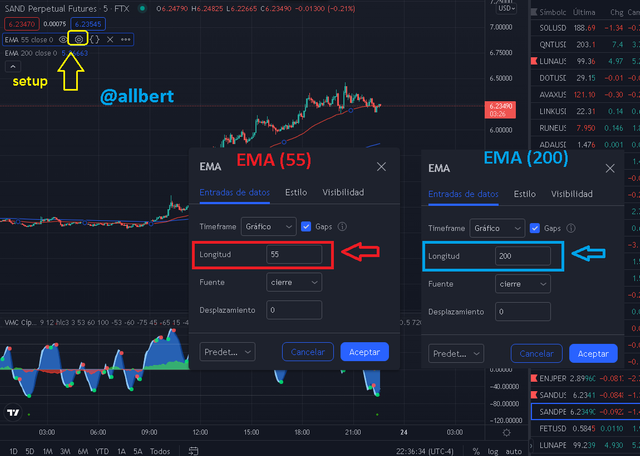
Image taken from: Source
In this way, we can see the interaction of the EMAs with each other and the way they interact with the price. So when the 55 EMA crosses the 200 EMA in an upward direction it represents the beginning of an uptrend. As long as the 55 EMA remains above the 200 EMA it means that the uptrend is sustained.
On the other hand, when the 55 EMA crosses the 200 EMA in the downward direction it will represent the start of a downtrend.
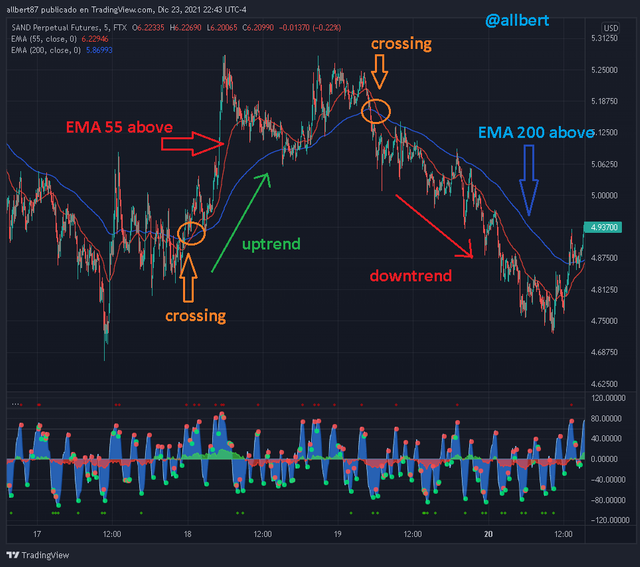
Image taken from: Source
5. Graphically explain how to use VuManChu Cipher B Indicator for Successful Trading. (Screenshots required)
ENTRY
1-First we must wait for the crossing of the EMA's to occur. In this case, as we are looking for a buy it is expected that the EMA 55 crosses in an upward direction the EMA 200.
2-After the first confirmation is given we should start looking for signals on the VuManChu Cipher B Indicator, specifically on the money flow index indicator, which should be above the green zero line, which indicates that money is entering the currency and the price of being rising. At this point we have not yet placed our entry, we have only followed confirmations. 3- The last signal and trigger will be the waves and dots, which occur just at the moment when the light wave becomes dark. Just at that moment is generated in the crossing place a green dot which indicates us to buy. Just at that moment, we place our long entry. Note that the entry point has been exceptional, as the green point of the wave has occurred below the zero level.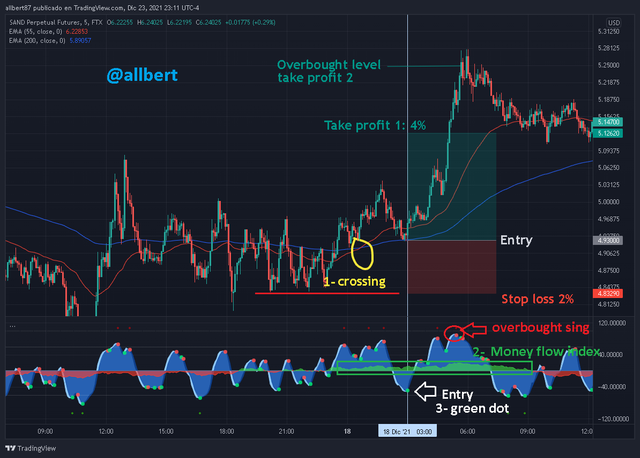
Image taken from: Source
EXIT
For exit, there are several options.
1-First we set the stop loss, which can be placed below the most immediate support level experienced by the price. 2- Based on the stop loss set we can place a take profit with a reward ratio of 1:1, 1:2, 1:3. In my case, I used one of 1:2. 3-On the other hand we can use a take profit strategy based on the waves of the VuManChu Cipher B Indicator, selling our position just when it indicates an overbought point at the 100% level. 4- In fact, if I think about it better, another option could be to use both strategies, dividing our profits into a take profit 1 and a take profit 2. Both would be valid and would complement each other very well.6. Using the knowledge gained from previous lessons, do a better Technical Analysis combining this trading Strategy and make a real buy or sell order in a verified exchange. (You should demonstrate all the relevant details including entry point, exit point, resistance lines, support lines, or any other trading pattern)
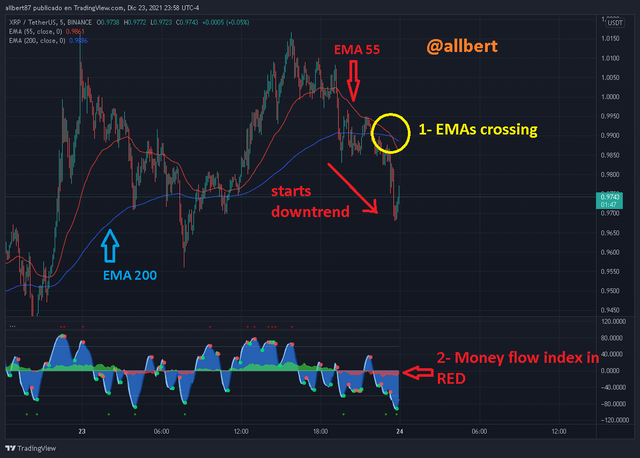
Image taken from: Source
2-As you can see, the VuManChu Cipher B Indicator confirms the bearish phase, as we see the Money flow index in red and below the zero line, indicating that money is flowing out of the currency.
One thing I am very aware of is that the wave trend indicator has marked an oversold point, so I expect a pullback in the price which could be a good entry point before continuing the downtrend. At this point most would be wrong to assume that the downtrend has come to an end only because of the oversold in wave trend indicator, however, both the money flow index and the EMAs confirm the bearish phase. 3- Having the first two confirmations, I head to my verified FTX account.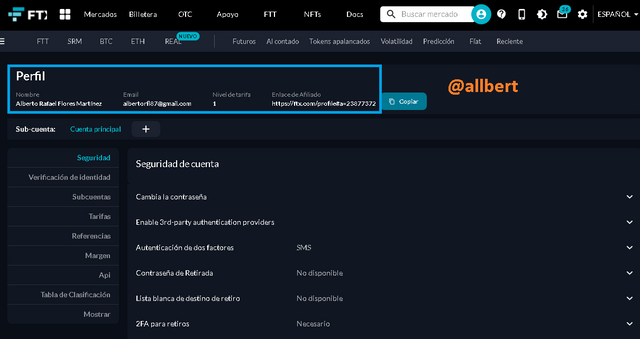
Image taken from: Source
Perpetual assets use the amount of dollars you hold in the account as collateral. In my case, due to some trades that went wrong, I am in a negative balance of -2.9 USD. However, due to the other assets I have in the account I am allowed to continue making trades buying and selling perpetual assets.
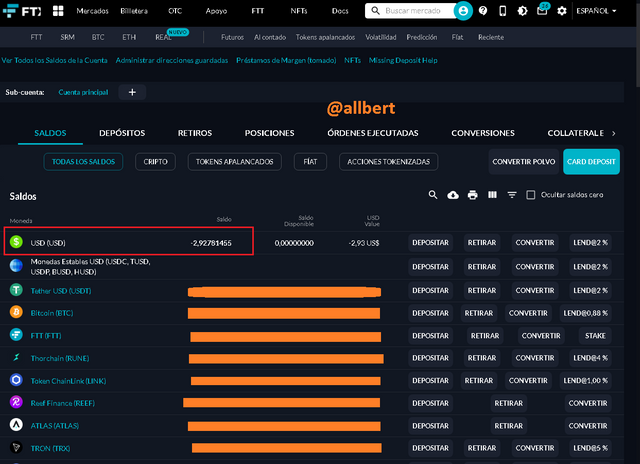
Image taken from: Source
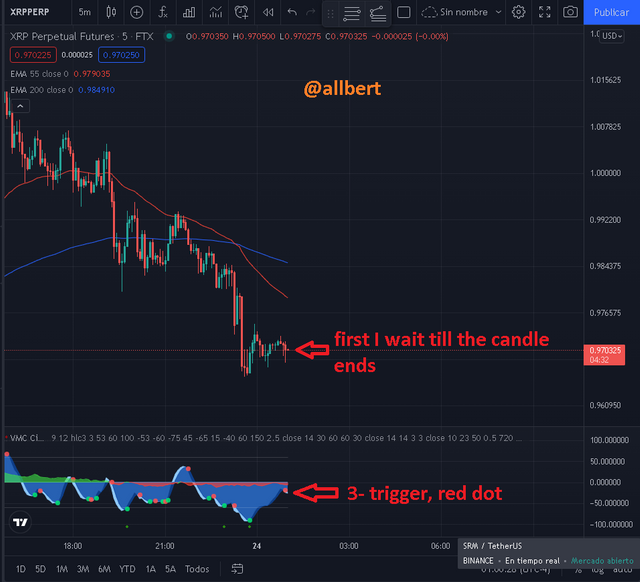
Image taken from: Source
5- Upon confirmation of the wave trend, I go to the XRP-Perpetual trading interface and prepare a sell at market price (no leverage) and using only 25% of the maximum total I am allowed. This is to control the risk.
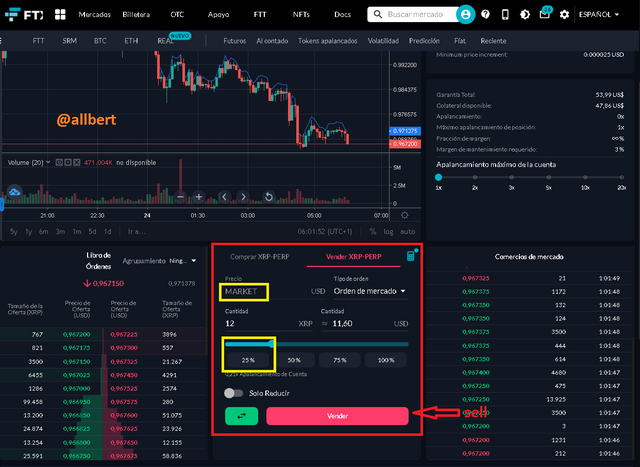
Image taken from: Source
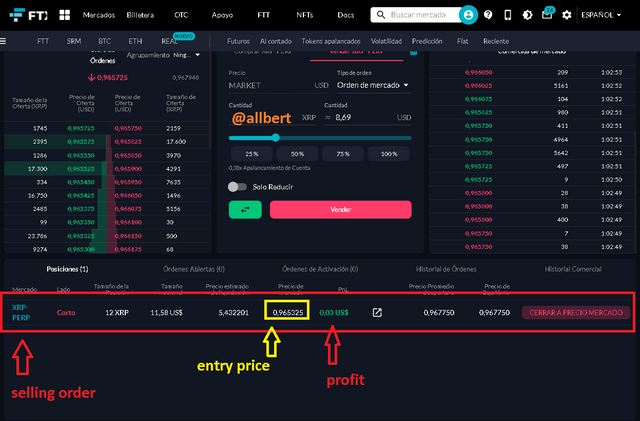
Image taken from: Source
I now set up my exit strategy.
6- First of all, for the stop loss I will use nearby resistance which held the price twice. This level is at 0.973 USD. For such reason, I will place my stop loss above that value, just at 0.975 USD.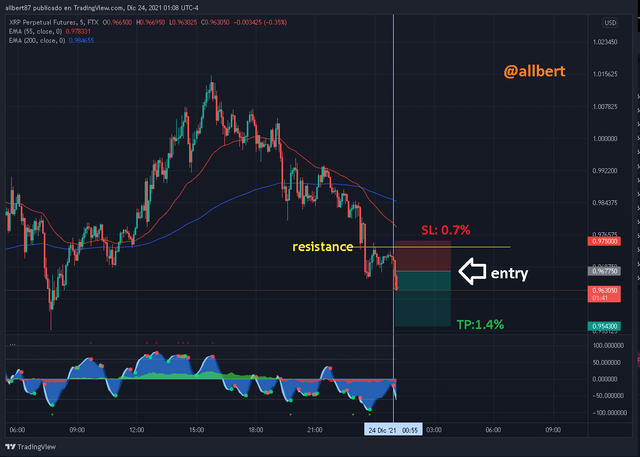
Image taken from: Source
7- For the Take profit I will use a conservative strategy of a reward ratio of 1:2. Therefore my take profit will be at the level of 0.9543 USD. Obtaining a 1.4% profit.
8-After setting the exit points in Tradingview I go to my Exchange account and place them on the trade as pending orders. For the stop loss, I use the buy with a market stop at 0.975 USD and for the take profit, I use a buy at take profit at 0.9543 USD. Both trades with the same lot I used at the beginning.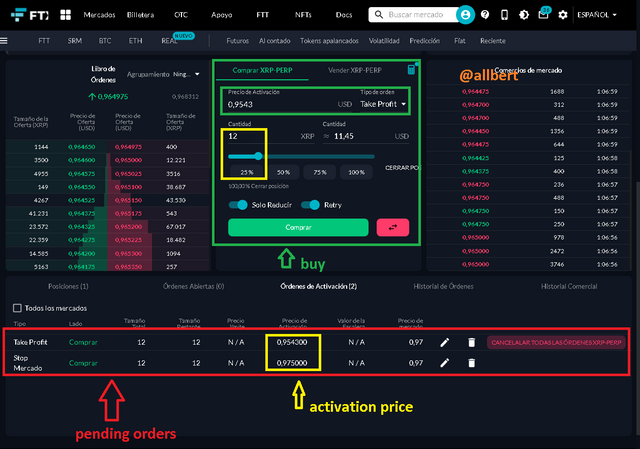
Image taken from: Source
9-The trade could not have gone better, as 30 minutes later it gave me the expected profit, triggering the take profit buy order at 0.9543 USD level.
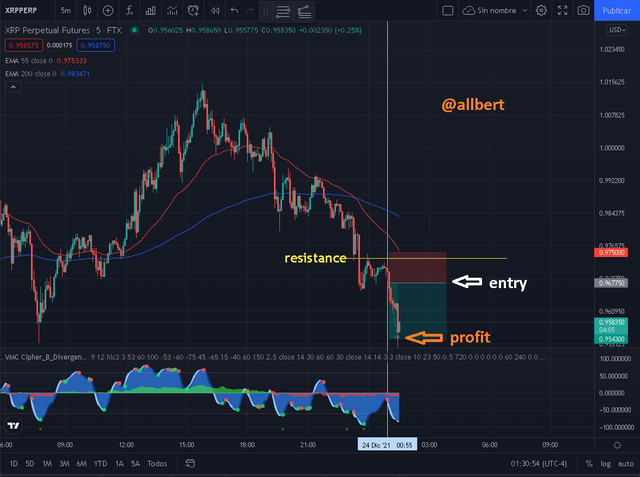
Image taken from: Source
Here you can see the Exchange proof along with the link: https://ftx.com/shareable-pnl/published/934642
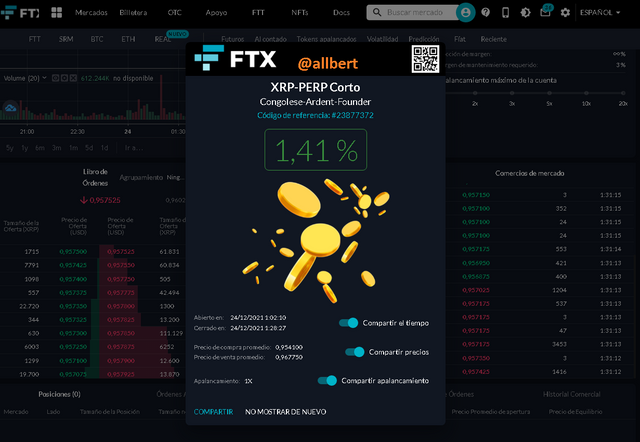
Image taken from: Source
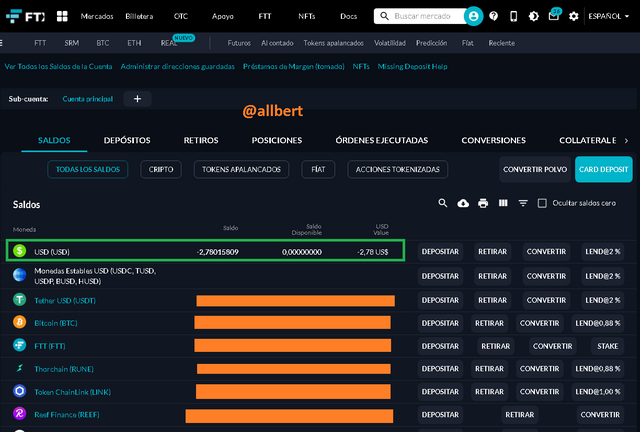
Image taken from: Source
CONCLUSION
One thing I really liked about the indicator is the relationship between the money flow index and the variation in the waves, which do not offer wonderful entry points.
However, like many other authors who talk about it, it is advisable not to use this indicator as to the main strategy, but rather as a confirmation of the main strategy.
In addition, it is recommended to be careful with the risk management and the amounts of money used in the use of this strategy.