Crypto Academy Week 16 - Homework Post for [@kouba01].Cryptocurrency Trading with Bollinger Bands
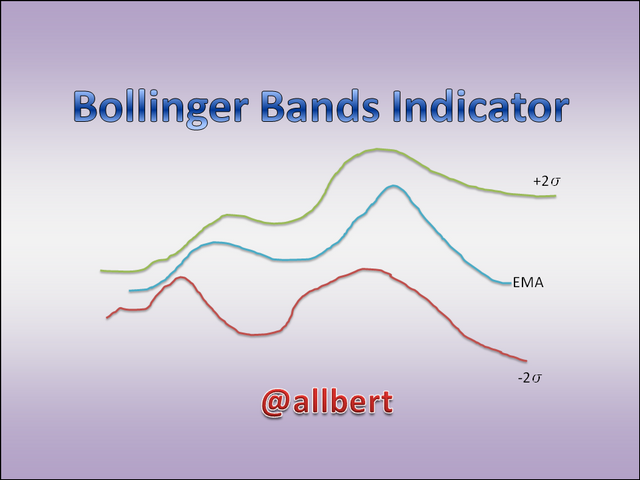 Image edited by me in Powerpoint
1- Define the Bollinger Bands indicator by explaining its calculation method, how does it work? and what is the best Bollinger Band setup?
Bollinger Bands is an indicator based on a moving average EMA around which bands are drawn that narrow and widen depending on the volatility of the market. It seeks to incorporate statistical knowledge around the moving average to create a band that better adapts to the volatility of the market. In fact, this indicator was originally designed to solve the problem of reading volatility, which at the time (the 1970s) was considered constant. Today we all know that volatility changes in cycles.
The Bollinger Bands calculation method revolves around a concept borrowed from statistics called "Standard Deviation", with this the creator of this indicator named John Bollinger came to the conclusion that the bands can adapt faster to volatility changes.
The Standard Deviation (which we will represent with the Greek letter "sigma") is simple to understand since it measures the dispersion of the results in relation to its average. For example, if we perform a demographic study of the age of all the inhabitants of a region, we could obtain a graph like the one below (Gaussian curve), where most of the ages would be very close to the average of all ages and only a few individuals would have very high or very low age.
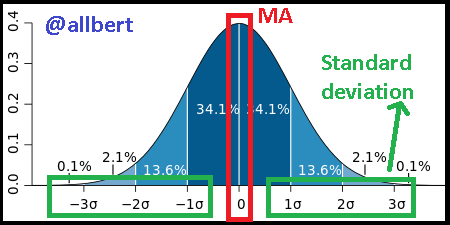
If we take any age of the graph we can see if it is far away or not from its MA (the MA is the highest part of the curve), we can see if it is very deviated... that's where the name standard deviation comes from.
So if we draw a MA and we add and subtract (n) standard deviations, there will be some bands around the MA and we will be able to measure when the price has moved too far away from its MA, that is, when we are at an extreme of the price of the asset.
The calculation is as follows:
Upper Bollinger Bands= MA + (n) sigma
Lower Bollinger Bands= MA - (n) sigma
Now, the million-dollar question is: what value of (n) is the best to set our bands. Again we must look at our gauss curve.
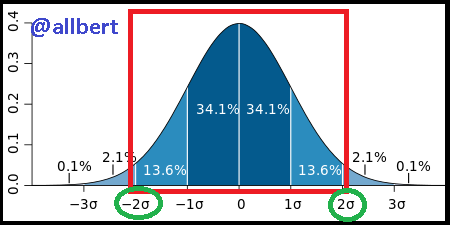
There we realize that more than 95% of the time the results are within the zone delimited by -2sigma and 2sigma, so we concluded that the best setup for the bands was 2 standard deviations from the MA or n=2. So most of the time, prices should lie within the bands, in other words, the bands envelop the vast majority of prices, but not all of them.
On the other hand, according to the creator of the indicator the MA = 20 fits perfectly. However, if you want to use a faster MA it is recommended to use a deviation of 1.5. On the other hand, if you want to use a slow MA, a standard deviation of 2.5 is recommended.
So when the volatility increases the bands separate because the dispersion has increased and therefore the standard deviation increases as well. And just the opposite happens when volatility decreases, the bands get closer together.
2- What is a breakout and how do you determine it?
The breakout is the phenomenon that occurs when the price of an asset that was within a horizontal trend suddenly explodes and moves outside the Bollinger Bands.
During a horizontal, low volume, low volatility trend the bands narrow, however as I mentioned before, volatility is cyclical and periods of low volatility will be followed by periods of high volatility, i.e. low volatility is the prelude to high volatility.
As Bollinger bands are very sensitive to volatility changes they detect them quickly, however, the breakout signal occurs when the price suddenly exceeds the bands.
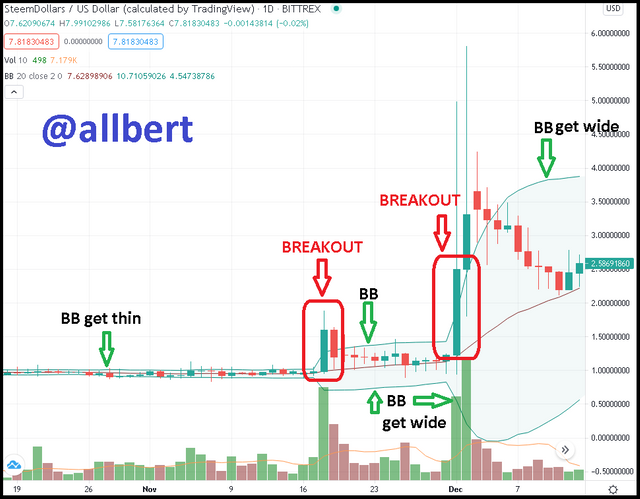 SBD/USD chart, 1D. Image edited by me and taken from my Tradingview account Source
Then, as volatility increases the bands separate quickly, so the opposite band is drawn away from the price in a marked way. In this case, it could be a good entry signal in the same direction as the price.
3- How to use Bollinger bands with a trending market?
The Bollinger Bands give us a useful frame of reference to know if the price is high or low, so during the impulses of a trend, the price will approach or overshoot the band on the side of the trend.
Therefore in an uptrend, for example, the price will approach or overshoot the upper band, and whenever there is a trend pullback or momentary consolidation the price will approach the MA or the opposite band, thus giving us a good entry or buy signal to then hold position when the uptrend resumes.
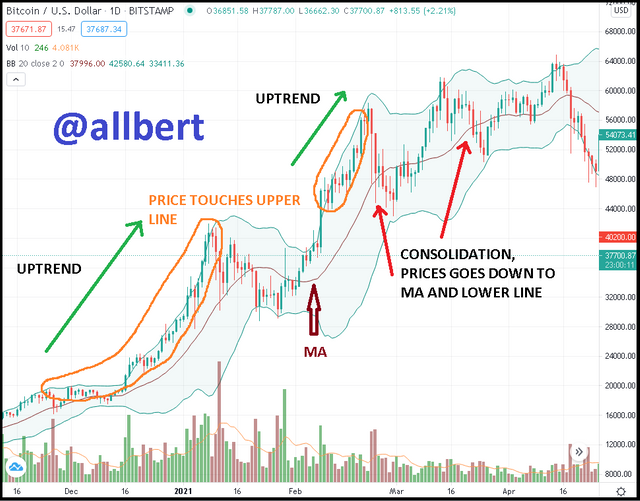 BTC/USD chart, 1D. Image edited by me and taken from my Tradingview account Source
It can also be applied in the opposite direction. If we are in a downtrend, the price will approach or exceed the lower band, but whenever a momentary rise occurs, the price will approach the MA or the upper band, giving us a good signal to exit or sell before the price continues to fall.
4- What is the best indicator to use with Bollinger Bands to make your trade more meaningful?
As I always say, indicators are tools, so I do not think there is one better than another, however for my case I will use the RSI indicator (14) in conjunction with the Bands.
I can not give certainty that it is the best duo, but it really is one of the simplest to understand, (so it was in my case), and often in trading is preferable to make things simpler.
The RSI indicator in theory will give us an additional confirmation of oversold or overbought that will alert us the right time to enter or exit a position in the market.
As stated in class, when the price approaches one of the bands there is a possibility that the price direction will change shortly thereafter. When the RSI indicator is added a filter is added to improve the certainty of the signals generated by the bands.
These RSI confirmation signals we will look for at the end of the uptrends or downtrends that the BBs help us identify, so in summary, the signals for both would be:Buy signal: Price breaks out below the lower band, but only if the RSI is below 30, i.e. in oversold conditions.
Sell signal: Price breaks out the upper band, but only if the RSI is above 70, i.e. in overbought conditions.
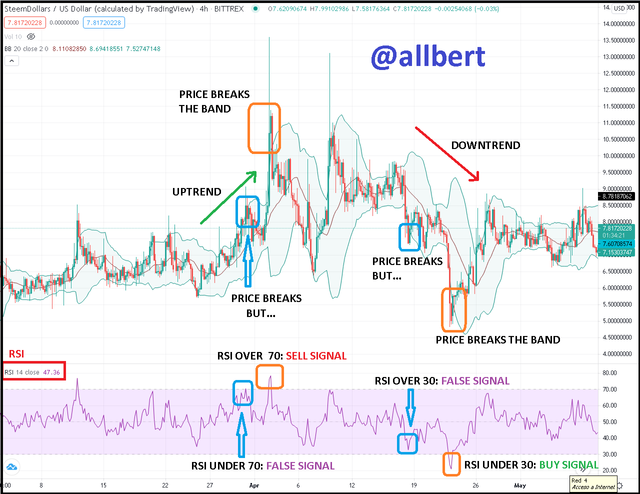
SBD/USD chart, 4H. Image edited by me and taken from my Tradingview account Source
I do not want to miss the opportunity to say that the Volume Indicator is always a good option to combine with any other indicator, as it shows us the number of people trading a selected asset and as we have seen it moves in relation to volatility.
5- What timeframe does the Bollinger Bands work best on?And why?
Using them at a higher timeframe means that we will not be able to track the market fast enough to identify possible entry and exit points for trading.
On the other hand, using lower timeframes causes the indicator to behave erratically and generate too many false signals of buy, sell, trend reversal, breakout, etc.
For example, we can see in a 4-hour timeframe chart. During that period the BB only showed three significant signals.
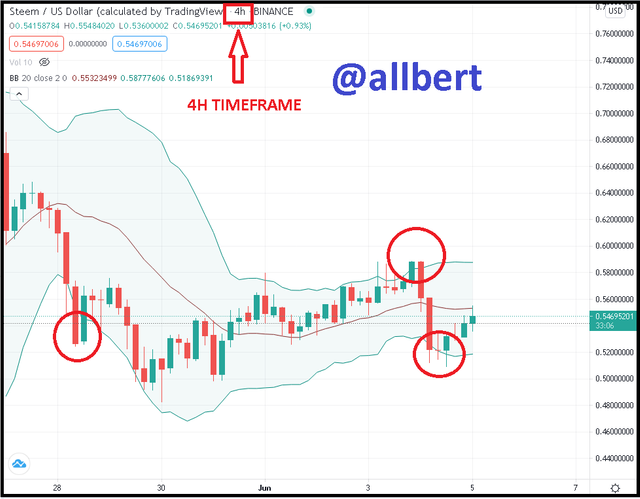
Steem/USD chart, 4H. Image edited by me and taken from my Tradingview account Source
However, in a 15-minute timeframe, the indicator showed a much higher number of signals (mostly false) during the same time period, as well as more erratic behavior.
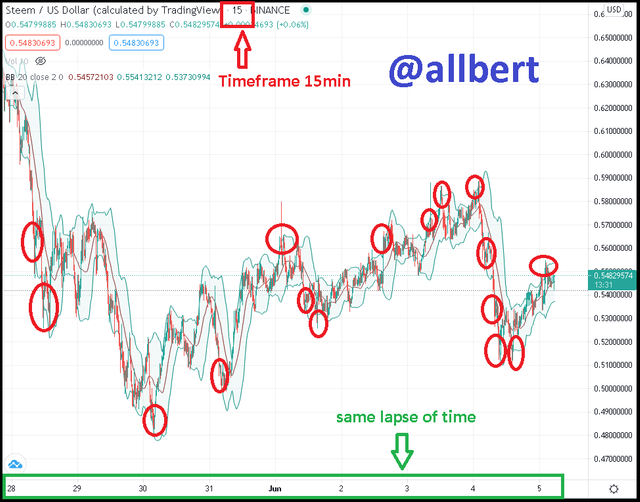
Steem/USD chart, 15m. Image edited by me and taken from my Tradingview account Source
6- Review the chart of any pair and present the various signals giving by the indicator Bollinger Bands.
The selected pair is ETH/USD, timeframe 4H.
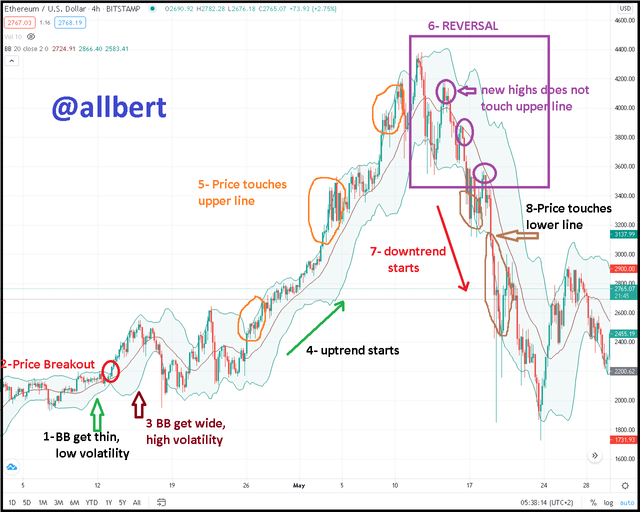
ETH/USD chart, 4H. Image edited by me and taken from my Tradingview account Source
1- The first thing you notice is that the market has been in a period of low volatility indicated by the BBs are very close together.
2- Then around April 13th a bullish breakout occurs, breaking the upper band.
3- This breakout produces a period of high volatility indicated by the bands separating sharply.
4- All this serves as a prelude to the beginning of a bullish phase.
5- This bullish period is confirmed by the BBs since as can be seen, the new highs of the price touch the upper line and are in line with the trend.
6- The price reaches its highest point and then starts to go down. The indicator shows us a change of the current trend, confirmed by the change of price direction, where its new highs do not touch the upper line again.
On the other hand, the new lows do touch the lower line steadily.
7- The bearish phase begins.
8- This bearish phase is confirmed by the BBs since as can be seen, the new lows of the price touch the lower line and are in line with the trend.
CONCLUSION
The BB is a good complement to the MA as it adapts very quickly to changes in volatility and provides us with a relative framework to assess whether the price is very different from its average.
Therefore it is very useful to complement any trading system, but as with any indicator we should always use it as an additional confirmation element to the price, we should never use it alone.
Hi @allbert
Thanks for participating in the Steemit Crypto Academy
Feedback
Excellent content. Thanks for demonstrating such a clear and well-detailed understanding of the Bollinger bands trading indicator.
Homework task
10
Thanks to You Professor!!!
Hi again Professor @yohan2on. Could You please help me a little out. I don't know the reason why My posts haven't been curated yet. Thanks