Crypto Academy Week 15 - Homework Post for [@yohan2on]. The Swing trading style
Greetings Professor @yohan2on. For today's assignment, I confess that I am a bit nervous and anxious because, in my opinion, the moment of truth has arrived. The moment to demonstrate in practice all the tools we have learned in class during the last weeks.
Naturally, it is still a test, but personally, this shows me at what level of knowledge I am.
So, Let's start.
 Image edited by me in Powerpoint
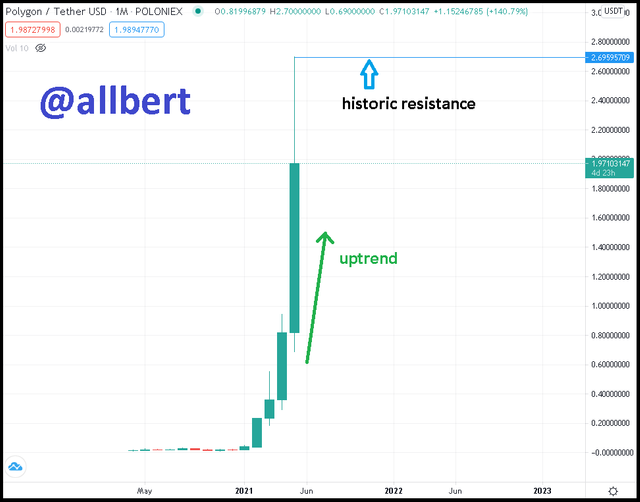 MATIC/USDT chart, 1M. Image edited by me and taken from my Tradingview account Source
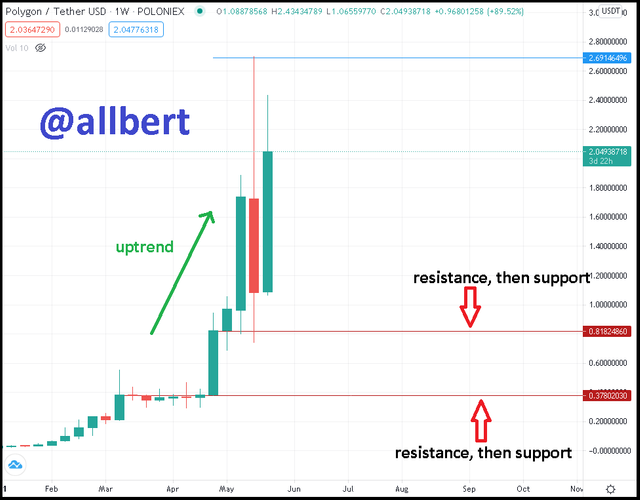 MATIC/USDT chart, 1W. Image edited by me and taken from my Tradingview account Source
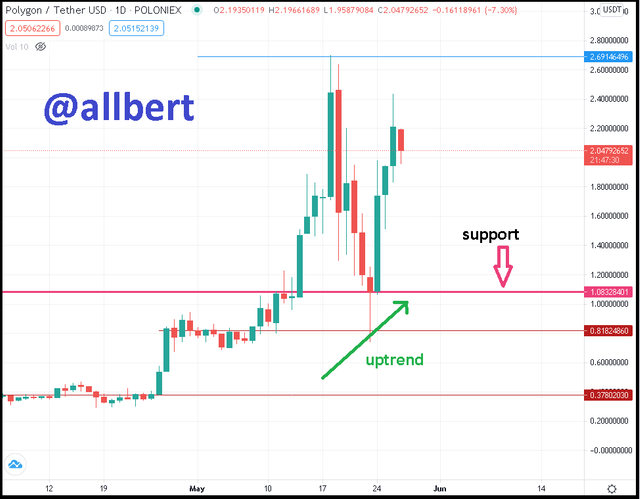 MATIC/USDT chart, 1D. Image edited by me and taken from my Tradingview account Source
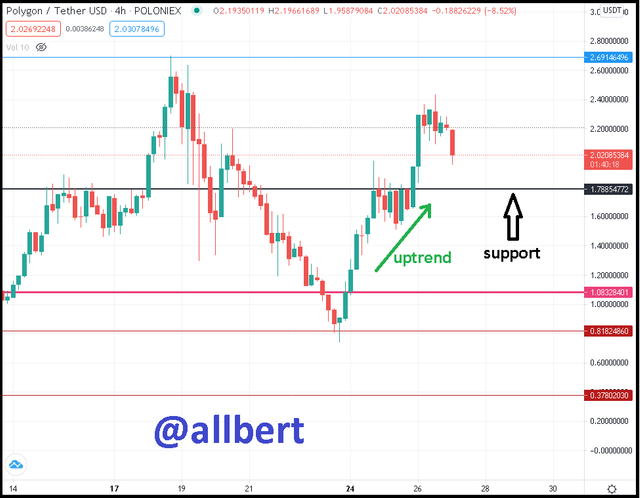 MATIC/USDT chart, 4H. Image edited by me and taken from my Tradingview account Source
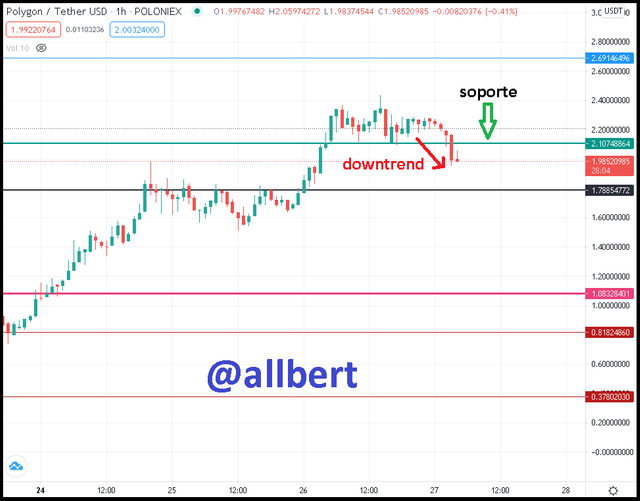 MATIC/USDT chart, 1H. Image edited by me and taken from my Tradingview account Source
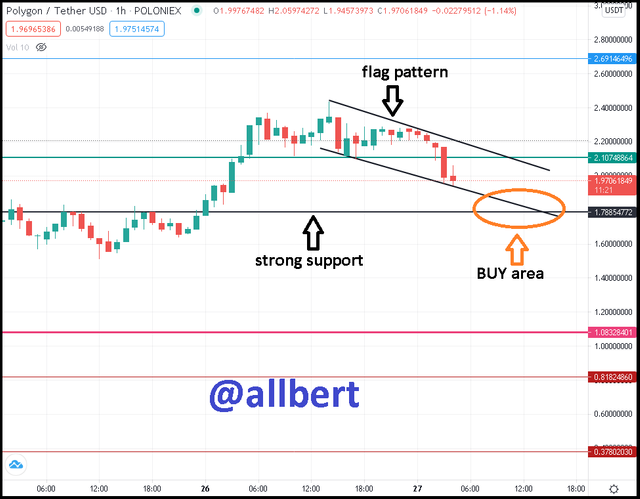 MATIC/USDT chart, 1H. Image edited by me and taken from my Tradingview account Source
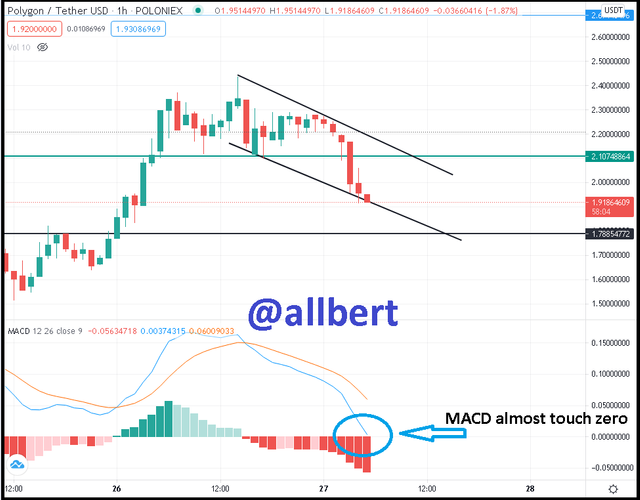 MATIC/USDT chart, 1H. Image edited by me and taken from my Tradingview account Source
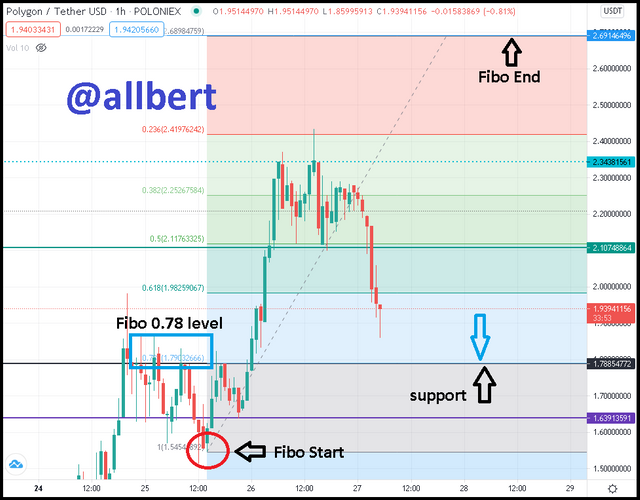 MATIC/USDT chart, 1H. Image edited by me and taken from my Tradingview account Source
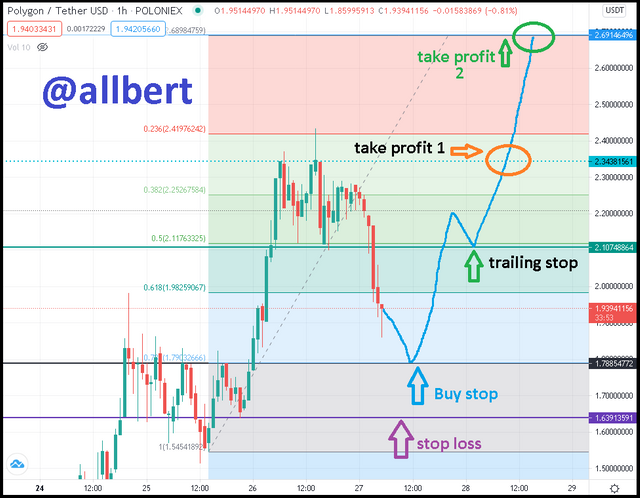 MATIC/USDT chart, 1H. Image edited by me and taken from my Tradingview account Source
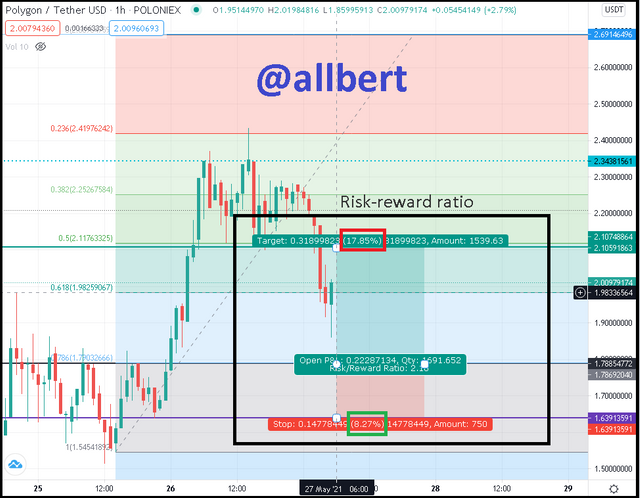 MATIC/USDT chart, 1H. Image edited by me and taken from my Tradingview account Source
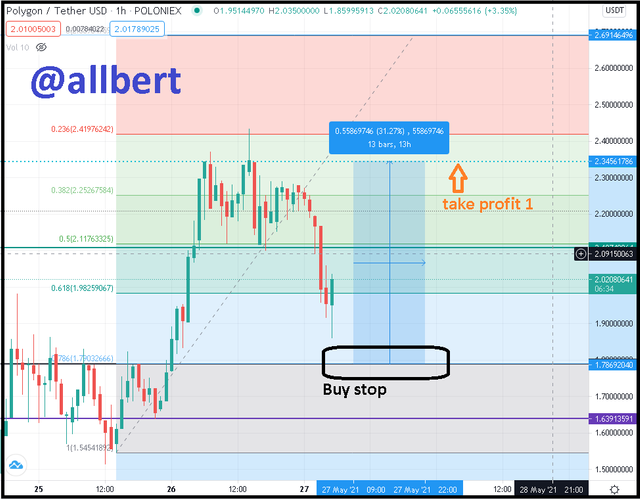 MATIC/USDT chart, 1H. Image edited by me and taken from my Tradingview account Source
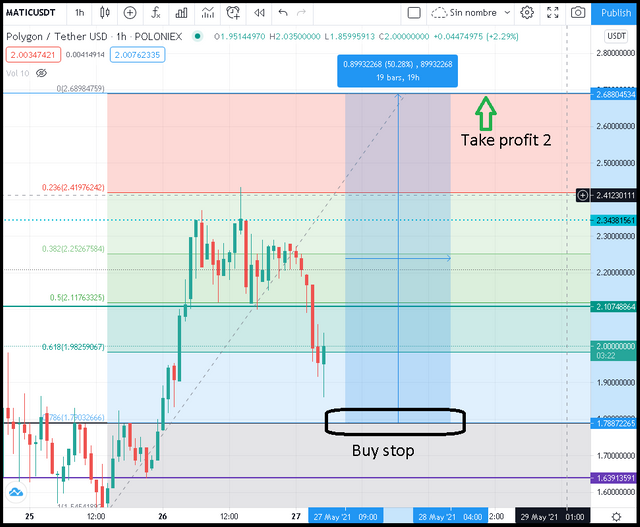 MATIC/USDT chart, 1H. Image edited by me and taken from my Tradingview account Source
Image edited by me in PowerpointSwing trading development
MATIC/USDT chart, 1M. Image edited by me and taken from my Tradingview account SourceMATIC/USDT chart, 1W. Image edited by me and taken from my Tradingview account SourceMATIC/USDT chart, 1D. Image edited by me and taken from my Tradingview account SourceMATIC/USDT chart, 4H. Image edited by me and taken from my Tradingview account SourceMATIC/USDT chart, 1H. Image edited by me and taken from my Tradingview account SourceMATIC/USDT chart, 1H. Image edited by me and taken from my Tradingview account SourceMATIC/USDT chart, 1H. Image edited by me and taken from my Tradingview account SourceMATIC/USDT chart, 1H. Image edited by me and taken from my Tradingview account SourceMATIC/USDT chart, 1H. Image edited by me and taken from my Tradingview account SourceTrade management
-Buy stop: 1.78
-Stop loss: 1.63
-Trailing Stop: 2.10
-Take profit 1: 2.34
-Take profit 2: 2.69
Later I could move the trailing stop to the level of 2.34 (dotted cyan line). In fact, I have studied that some traders do not set take profits, but constantly move the trailing stop. This is not my case. A curious fact is that the percentage of loss of my stop loss is 8.27%, while the percentage of gain up to the first trailing stop is 17%, fulfilling the 1:2 risk-reward ratio.MATIC/USDT chart, 1H. Image edited by me and taken from my Tradingview account SourceMATIC/USDT chart, 1H. Image edited by me and taken from my Tradingview account SourceMATIC/USDT chart, 1H. Image edited by me and taken from my Tradingview account Source
Hi @allbert
Thanks for participating in the Steemit Crypto Academy
Feedback
This is excellent work done. Thanks for practically demonstrating your understanding of the Swing trading style in a clear and well-detailed way.
Homework task
10
Thank You so much Professor. I really enjoyed this assigment.