Crypto Academy Week 13 - Homework Post for [@yohan2on]. The Scalp trading style, FINGER-TRAP
Greetings Professor @yohan2on. I admit that this week's assignment was difficult for me, it required a lot of research, reading and studying. However I am happy for the new knowledge learned.
So let's started.
 Image edited by me in Powerpoint
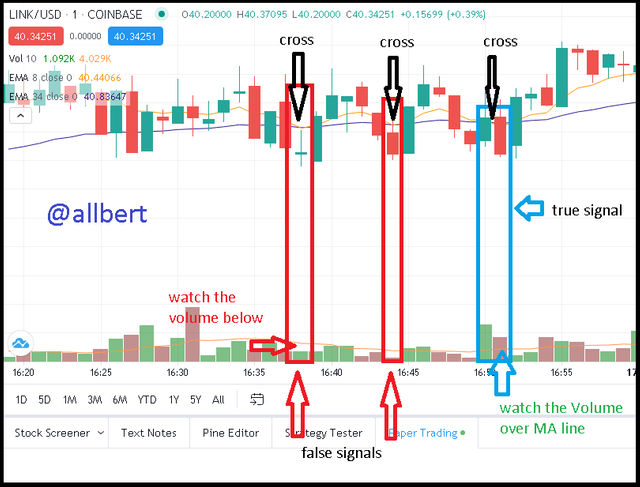 True and False signal example. Image edited by me and taken from Tradingview.Source
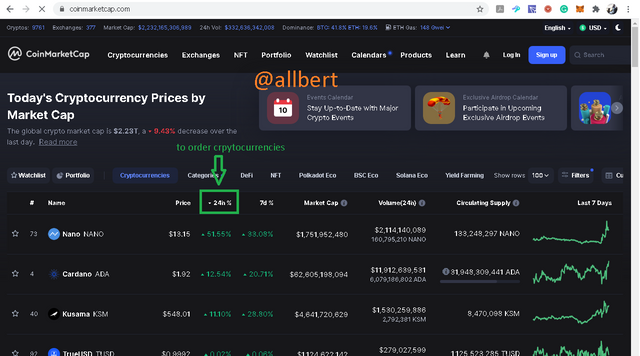 Image taken from Coinmarketcap.Source
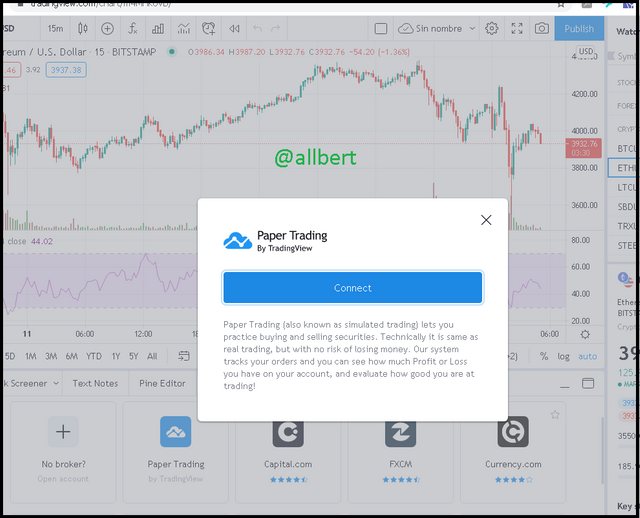 Image edited by me and taken from Tradingview.Source
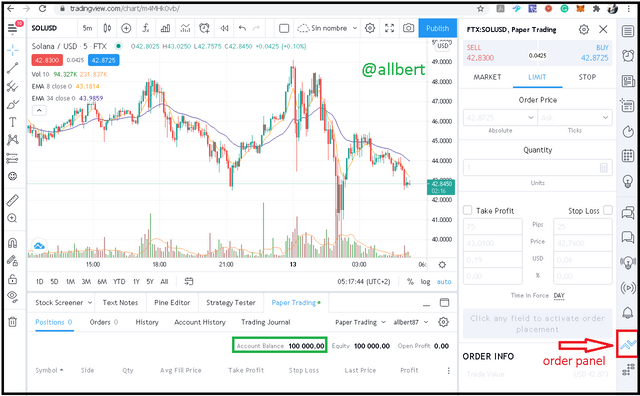 Image edited by me and taken from Tradingview.Source
1- Review the SOL/USD chart 15-minute time frame to observe its trend, which indicates the beginning of an uptrend. Start time 12:29 am, however, the pair was chosen a few hours earlier. 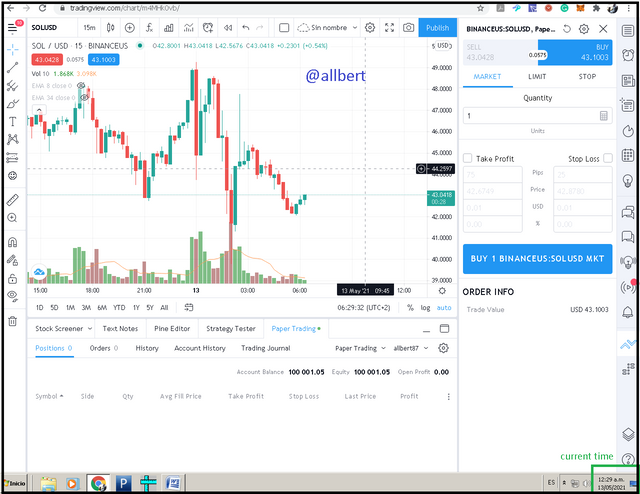
2- After 38 minutes of waiting, Once the EMA crossing occurs, we verify that the Volume value is above the MA to avoid a false signal. As both cases occur, we proceed to place the position with a Lot size of 1. In this case, since it is an uptrend, the yellow line EMA 8 moves above the purple line EMA 34... this means that we should place a Buy order.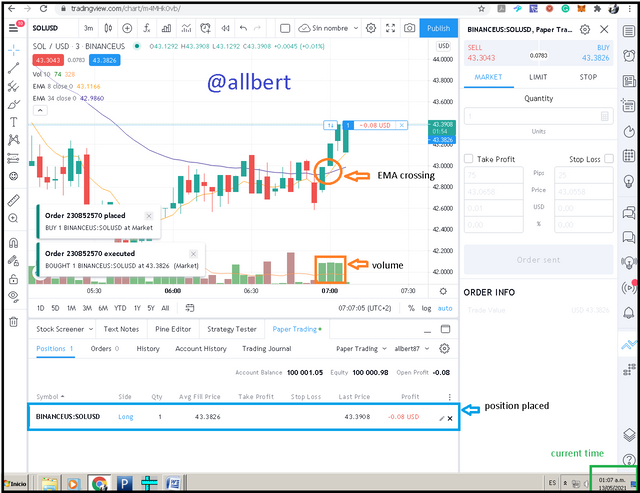
3-There are two options for closing the position: The first is to wait for the EMA lines to come together again, this gives the signal to close. Or as in my case, close when the expected Profit is reached. I closed the trade after 22 minutes.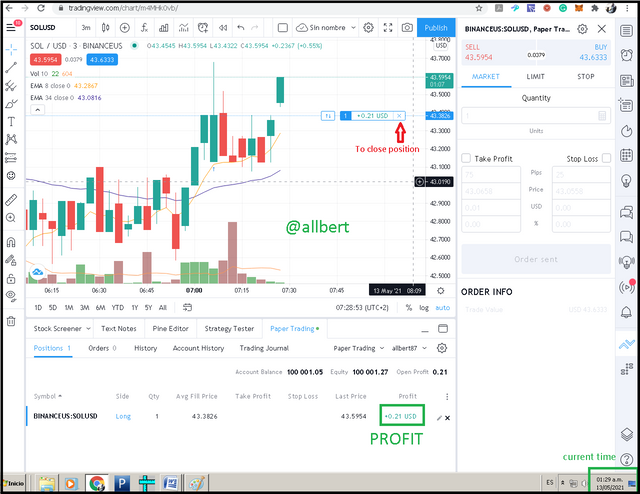
4-To close the position the system will ask for confirmation.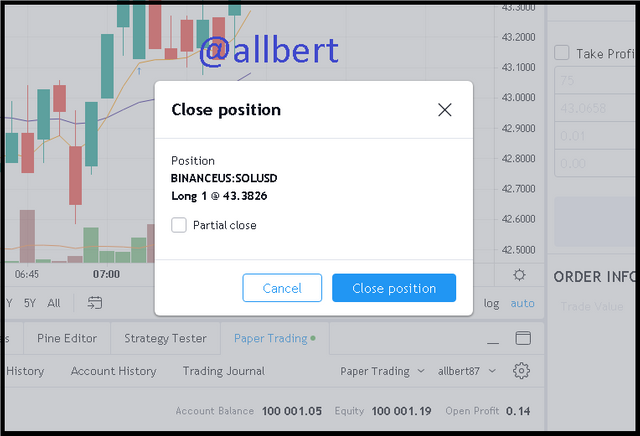
5- Finally, we can observe the closing of the operation in the account history.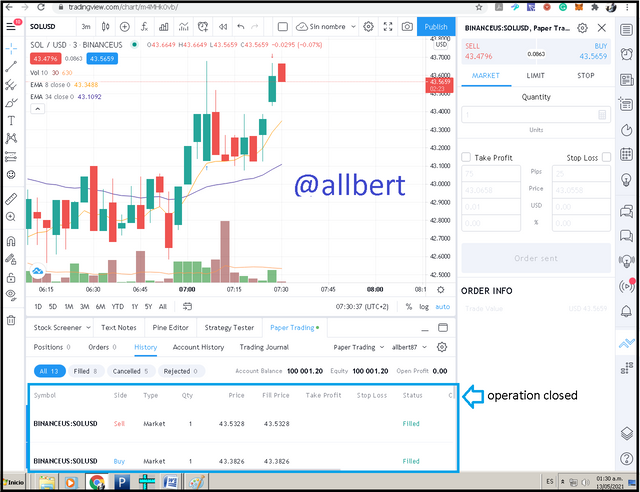
1- Review the LINK/USD chart 15-minute time frame to observe its trend, which indicates the beginning of a downtrend.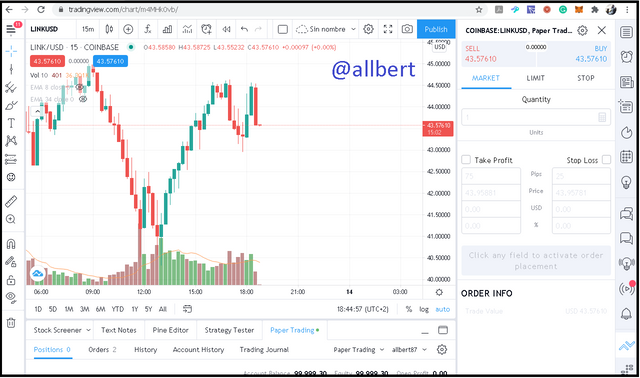
2- Once the EMA crossing occurs, we verify that the Volume value is above the MA to avoid a false signal. As both cases occur, we proceed to place the position with a Lot size of 10. In this case, since it is a downtrend, the purple line EMA 34 moves above the yellow line EMA 8... this means that we should place a Sell order.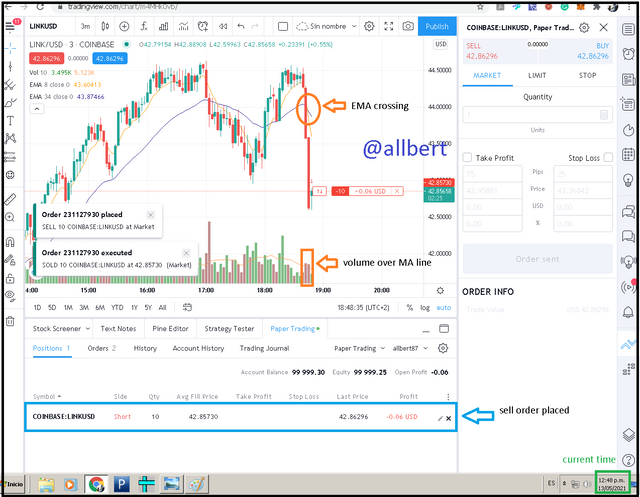
3-In this case again I closed when the expected Profit is reached. I closed the trade after 2 minutes.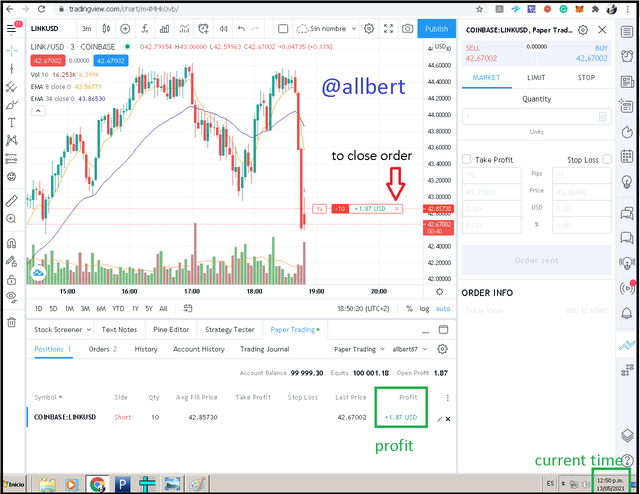
4- Finally, we can observe the operation in the account history.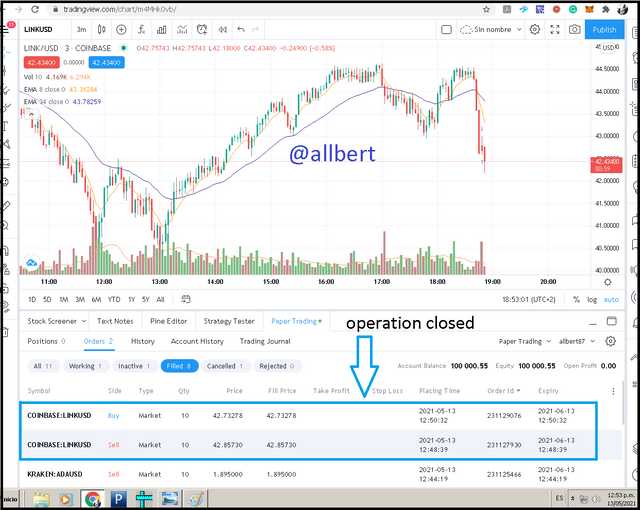
5- We also can see its profit.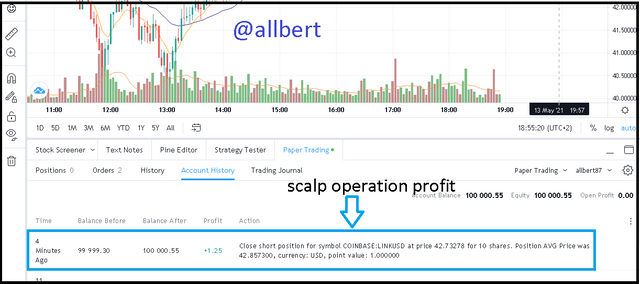
Image edited by me in PowerpointLET'S KNOW THE FINGERTRAP
It is a Scalp trading strategy that allows us to identify certain signals and patterns that will guide us to make quick and correct decisions during the operation.
First of all, two EMA indicators are configured on our candlestick chart. The EMA 8 (some traders use 13) will be the fast pattern and the EMA 34 will be the slow pattern. The EMA 8 line will closely follow the price of the asset and the EMA 34 will be used to find the trading signal. In essence, the two EMA lines will indicate the behavior of the chart, so when the two lines cross a trend change is expected. If, on the other hand, the two lines move away from each other, it indicates a continuation of the existing pattern (bullish or bearish). This trend reversal signal will be the key to indicate when it is the right time to place a position in our scalping operation. However, the two EMA lines are not enough, as they can sometimes give us false signals, so it is necessary to accompany our strategy using the Volume indicator, ideally with an MA line of 10. Volume and Fingertrap work together as follows: When the two EMA lines cross you should check at that moment if the Volume value is above its MA line, if so this corroborates the trend change, so you should put your position. If on the contrary, if the volume value is below its MA line, this means a false signal. False signals occur a lot in markets with sideways movement.True and False signal example. Image edited by me and taken from Tradingview.SourcePreparation:
Image taken from Coinmarketcap.SourceDemonstration 1. SOL/USD pair.
Image edited by me and taken from Tradingview.SourceImage edited by me and taken from Tradingview.SourceDemonstration 2. LINK/USD pair.
Hello @allbert,
Thank you for participating in the 5th Week Crypto Course in its second season and for your efforts to complete the suggested tasks, you deserve a 7/10 rating, according to the following scale:
My review :
Article with good content. A clear effort is being made to find and provide information to explain the "Finger-trap" trading strategy. Supporting this strategy with a volume indicator may be a good tool for identifying false signals as this indicator measures the intensity of price action. By monitoring price and volume, you are actually using two different tools to gauge the same thing: market pressure.
You had to analyze the results of the two examples presented of this strategy to understand the benefit of using it.
Thanks again for your effort, and we look forward to reading your next work.
Sincerely,@kouba01
Thanks a lot @kouba01. I can't wait for next class!!!