Crypto Academy Week 12 - Homework Post for [@kouba01]. Cryptocurrency Trading with RSI
Hello again @kouba01. Let me say that I really like this kind of class with technical content. I take advantage of them a lot as they have information that I can then use as tools in my trading. This is not the first time I talk about RSI, however today I will give an extended, different, and fresh perspective.
Let's start
 Image edited by me in Powerpoint.
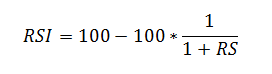
Image oh the RSI Formula edited by in me Word, and taken from Wikipedia.
Naturally, the platform performs this operation for us at a rate of several times per minute.
The key point is to determine the RS factor. This results from the relation of the average or (exponential moving average) of the closing prices in an uptrend period divided by the average of the closing prices in a downtrend period.
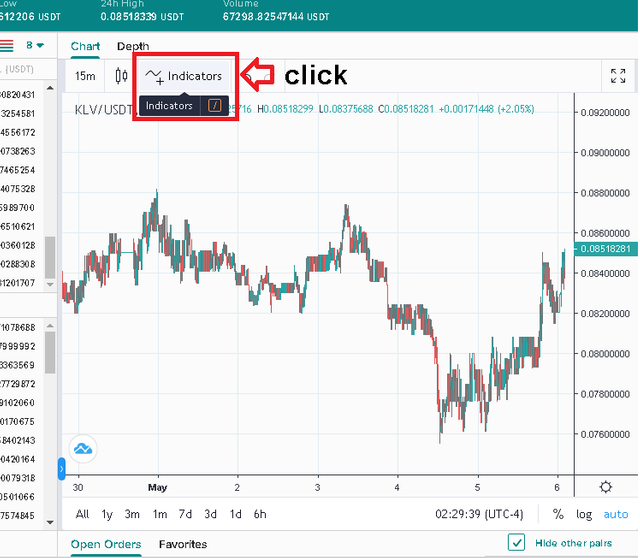 Image edited by me and taken from my Poloniex account.
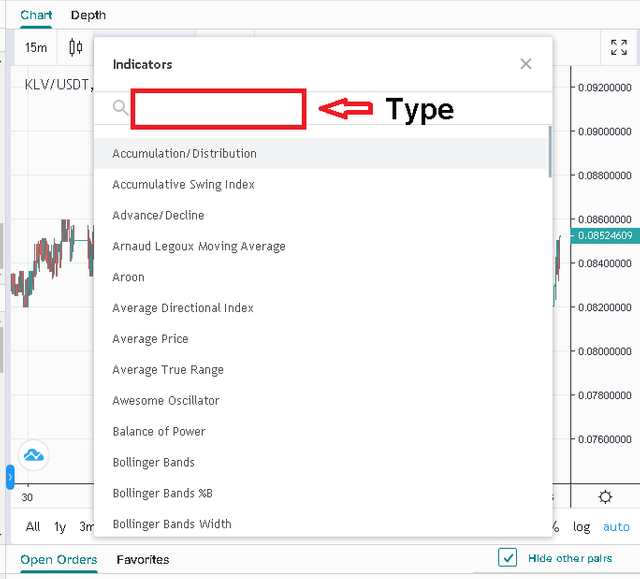 Image edited by me and taken from my Poloniex account.
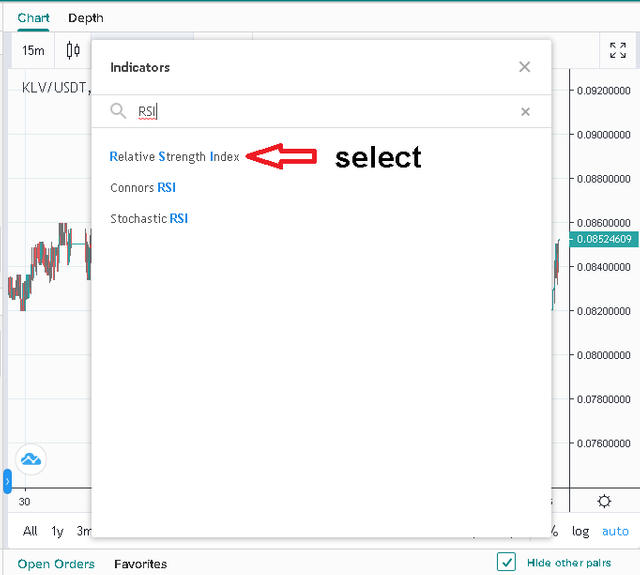 Image edited by me and taken from my Poloniex account.
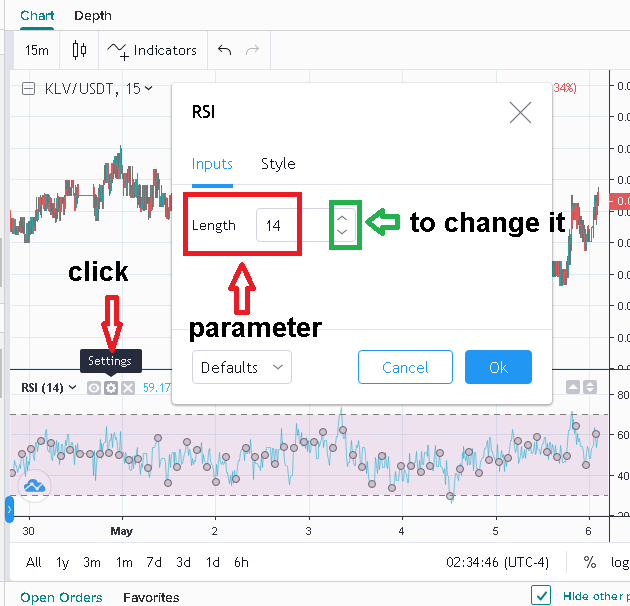
Image edited by me and taken from my Poloniex account.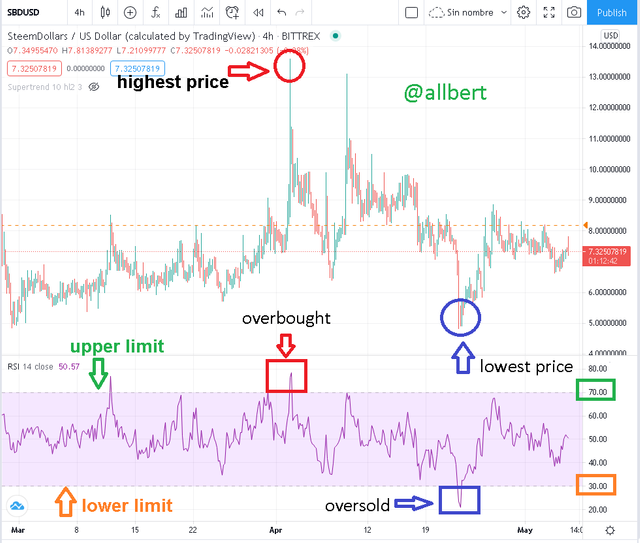 SBD/USD chart, RSI indicating overbought and oversold areas. Image edited by me and taken from Tradingview. Source
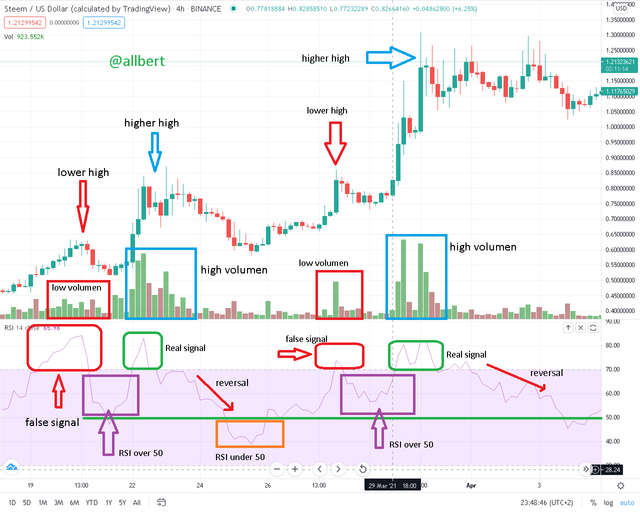 STEEM/USD Chart. Real and false signals. Image edited by me iand taken from Tradingview. Source
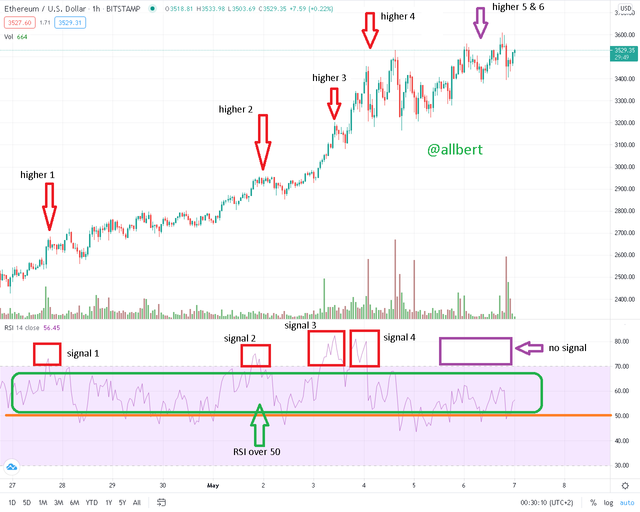 ETH/USD chart. Image edited by me iand taken from Tradingview. Source
Image edited by me in Powerpoint.1- RSI Indicator
2- Can we trust the RSI on cryptocurrency trading and why?
3- How do you configure the RSI indicator on the chart and what does the length parameter mean? Why is it equal to 14 by default? Can we change it?
Image edited by me and taken from my Poloniex account.Image edited by me and taken from my Poloniex account.Image edited by me and taken from my Poloniex account.Image edited by me and taken from my Poloniex account.
4- How do you interpret the overbought and oversold signals when trading cryptocurrencies?
SBD/USD chart, RSI indicating overbought and oversold areas. Image edited by me and taken from Tradingview. Source
5- How do we filter RSI signals to distinguish and recognize true signals from false signals.?
STEEM/USD Chart. Real and false signals. Image edited by me iand taken from Tradingview. Source
6- Review the chart of any pair and present the various signals from the RSI.
ETH/USD chart. Image edited by me iand taken from Tradingview. Source
Hi @allbert
Thanks for participating in the Steemit Crypto Academy
Feedback
This is good content. Well done with your research study on the RSI trading indicator.
Homework task
9
thanks professor, I appreciate it