[ Advanced Technical Analysis Using Fractals ]-Steemit Crypto Academy | S5W8 | Homework Post for @reddileep
Image edited by me in Powerpoint
1. Define Fractals in your own words.
Fractals in trading, on the other hand, refer to patterns of candlestick structures that repeat in a reiterative manner throughout the evolution of the price chart. As in theory, these patterns repeat at different scales and in different cycles, they can help us in some way to predict the future of a price just by studying past behavior.
From a practical point of view we can see fractals as zones of exhaustion of a trend or breakout of a structure; for example in an uptrend when we see higher and higher highs until suddenly a lower high occurs, we are in the presence of a bearish fractal.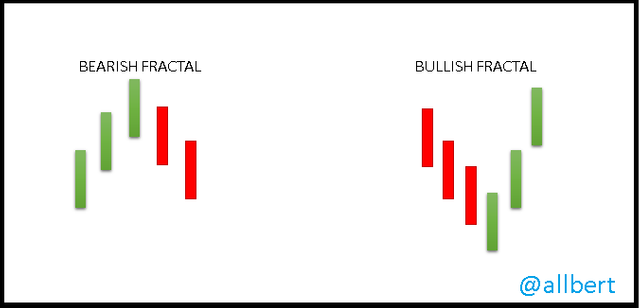
Image edited by me in Powerpoint
2. Explain major rules for identifying fractals. (Screenshots required).
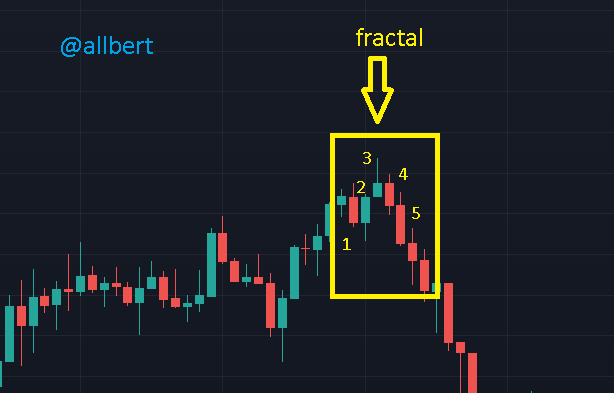
Image taken from: Source
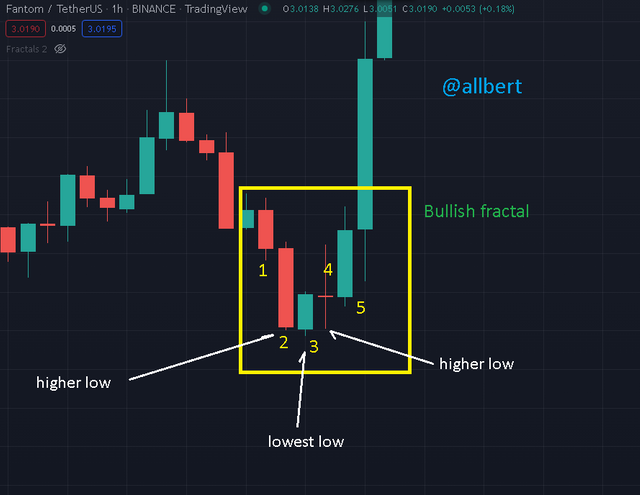
Image taken from: Source
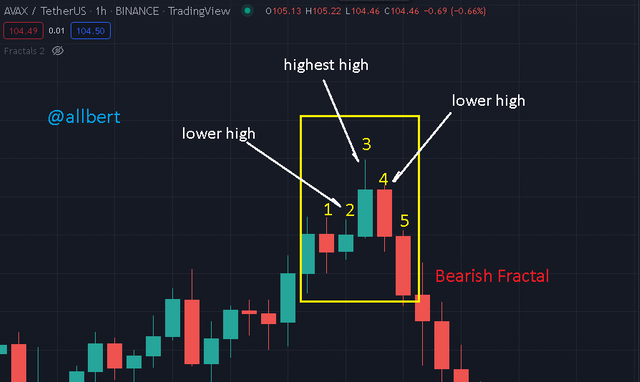
Image taken from: Source
3. What are the different Indicators that we can use for identifying Fractals easily? (Screenshots required).
William Fractal Indicator
As we saw in class the first indicator is the William Fractal Indicator, named after Bill Williams who studied fractals as applied to financial markets.
This indicator is one of the easiest to use since it shows you graphically (through red and green arrows) the inflection points or fractals that are generated in the price. In other words, the indicator detects and makes visible bullish fractals and bearish fractals patterns and points them out.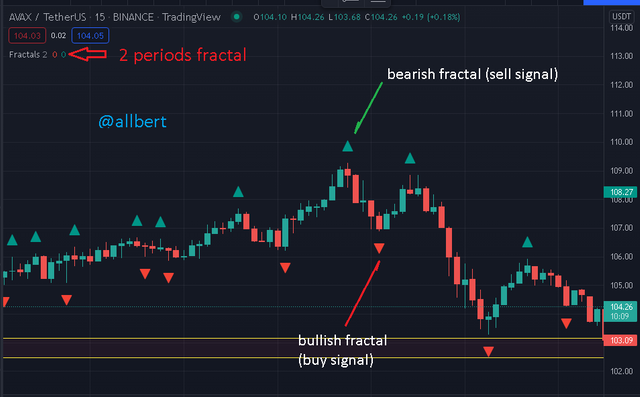
Image taken from: Source
Fractal Support Resistance
This indicator takes fractals to another level, as it is responsible for detecting fractals and then marking lines of Resistance and support based on those fractals. This indicator is based on the principle I discussed in questions 1 and 2, which stipulates that fractals are signals of trend exhaustion, so they can easily function as relevant new supports and resistances. However, the indicator does not take into account all fractals, but only the latest fractals from different higher time frames.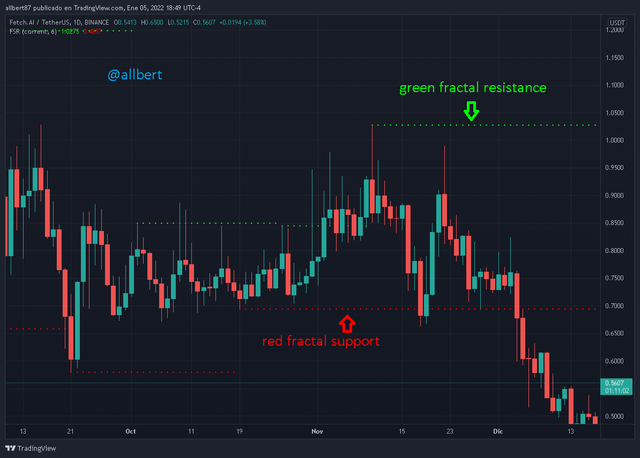
Image taken from: Source
Fractal Breakout
In this indicator, the level goes even higher, in fact, more than an indicator it is a trading strategy that only works to place buy entries. This indicator detects the last fractal top and shows a buy signal when the price breaks it. The buy signal is through a blue arrow and the word "Long". The exit signal occurs when the average of the fractal tops falls and is represented by a magenta arrow and the text: "close entry order long".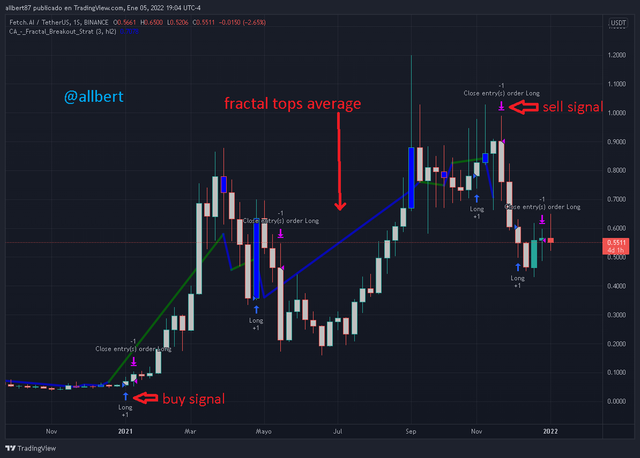
Image taken from: Source
Additionally, the indicator shows a blue (sometimes green) line representing the average price of the last fractal tops.
As relevant data (I say this from experience) do not forget that the most important data that can be configured is the exit condition delay, which is 3 candles by default.
Fractal Alligator
Again this is not just one indicator, but a joint strategy between two indicators, both developed by Bill Williams in which the fractal detection indicator is joined with the moving averages of the Alligator Indicator. In this case, the fractals will function as primary buy or sell signals which will then be confirmed by the alligator. As we already know the alligator is made up of 3 moving averages of different periods. Actually, this indicator is complex and it would require a whole class to explain it, so I will just say that the buy and sell signal will be when the three lines cross. This is the indication of a change in the trend.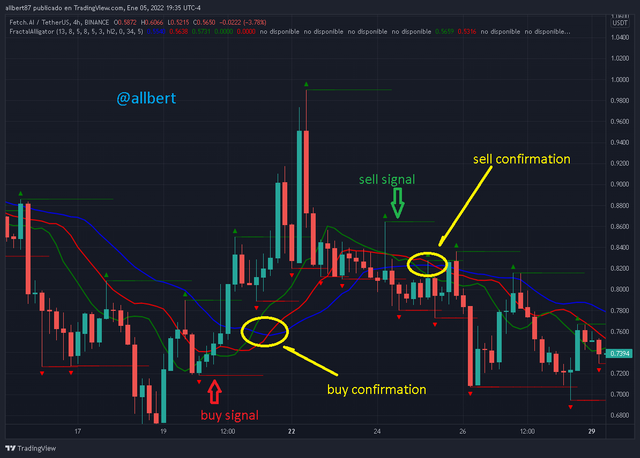
Image taken from: Source
As you can see, all these indicators have one thing in common: they are all based on identifying when fractals are generated in the candlestick structure, and interpreting what they represent for the current trend.
4.Graphically explore Fractals through charts. (Screenshots required).
Image taken from: Source
Image taken from: Source
Image taken from: Source
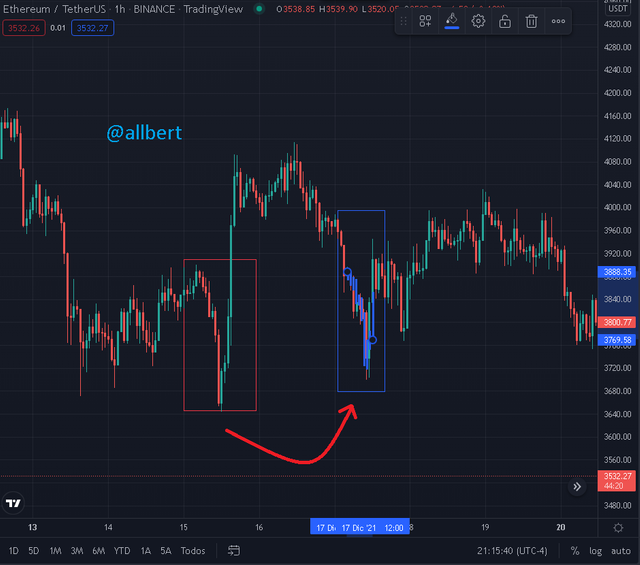
Image taken from: Source
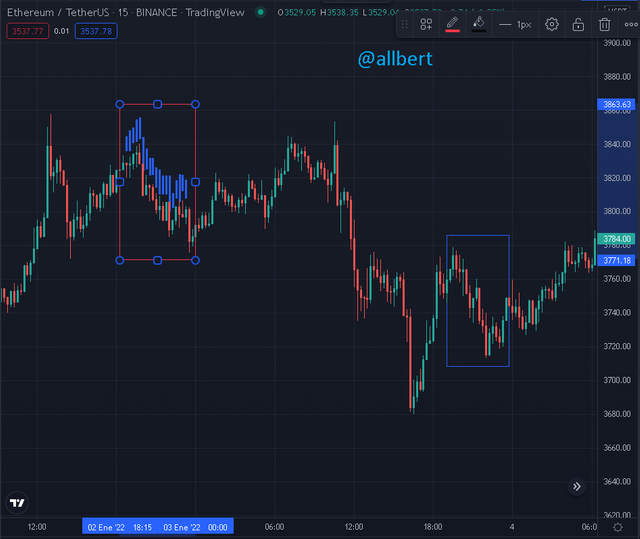
Image taken from: Source
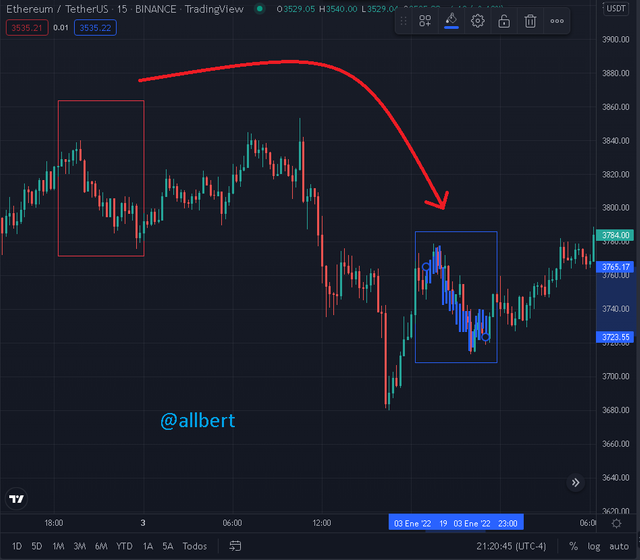
Image taken from: Source
5. Do a better Technical Analysis identifying Fractals and make a real purchase of a coin at a suitable entry point. Then sell that purchased coin before the next resistance line. Here you can use any other suitable indicator to find the correct entry point in addition to the fractal. (Usually, You should demonstrate all the relevant details including entry point, exit point, resistance lines, support lines, or any other trading pattern).
I placed this trade on Monday, January 3, 2022, at 10 PM UTC. The asset to trade was Bitcoin Perpetual Futures, which as I said in my previous assignment is an asset type that allows trading the Exchange FTX. Through it, you trade (with REAL MONEY) through price variation.
As I stated before, the collateral that the Exchange allows you to use is the USD stored in the account. By the way, although I recovered, I am still in a negative balance from last time. However thanks to my other assets in the account, the system allows me to continue trading up to a certain negative balance.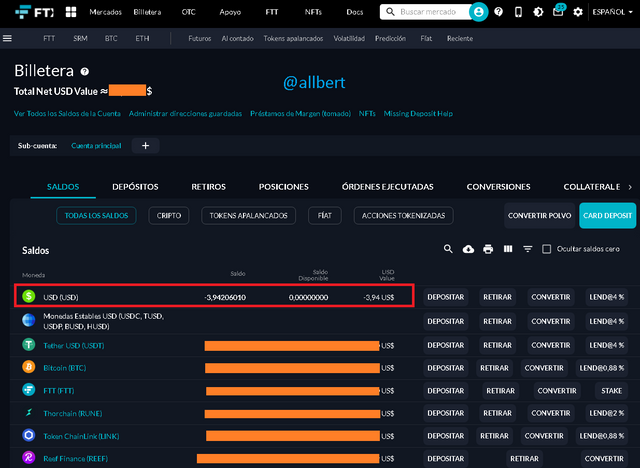
Image taken from: Source
Analysis
1-I start by analyzing the 4-hour BTC chart. In it, I can see 2 areas: 1 key support area and 1 key resistance area during the last week, between the levels of 48000 USD and 45500 USD. These two areas will be my support and resistance.
As you can see, the price has reacted up to 5 times on that support. In fact, the price has just reacted to the support.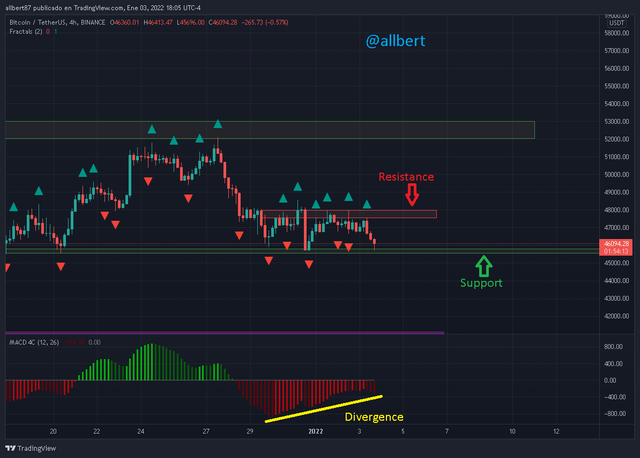
Image taken from: Source
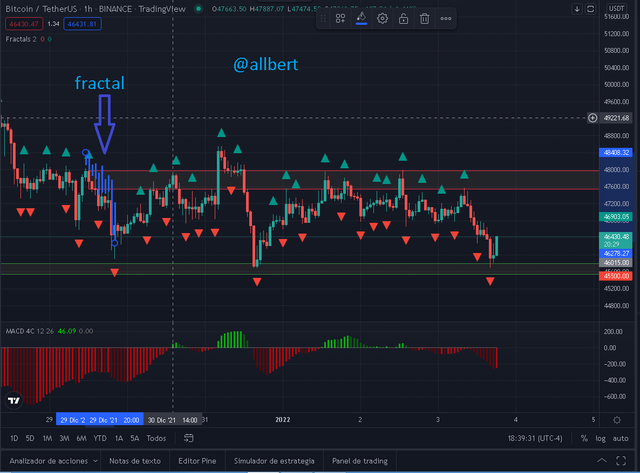
Image taken from: Source
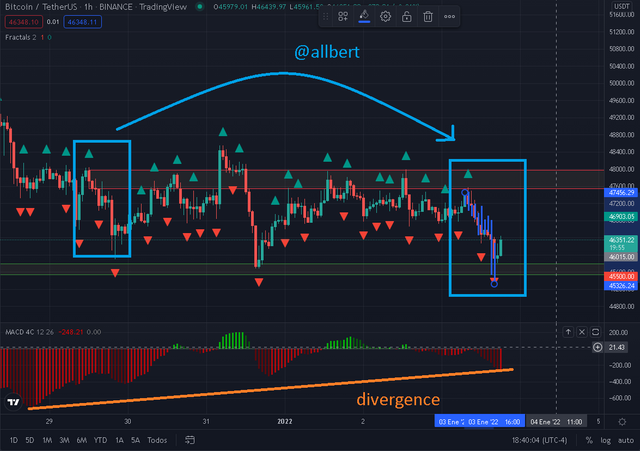
Image taken from: Source
ENTRY
2-When I switch to a 1-hour timeframe I see what I was looking for, the William Fractal indicator Buy signal with the red arrow below the lowest point of the fractal.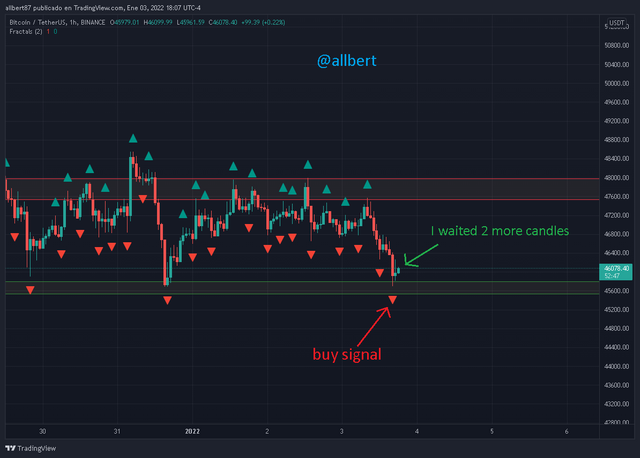
Image taken from: Source
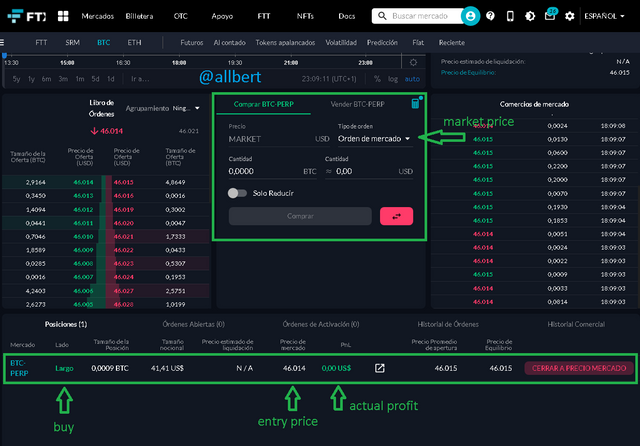
Image taken from: Source
EXIT STRATEGY
For the exit, in theory, I should choose the support level that I set at the beginning between 48000 and 47500 USD. However, I wanted to try something else. So I used the Fibonacci Retracement tool to look for an additional exit level.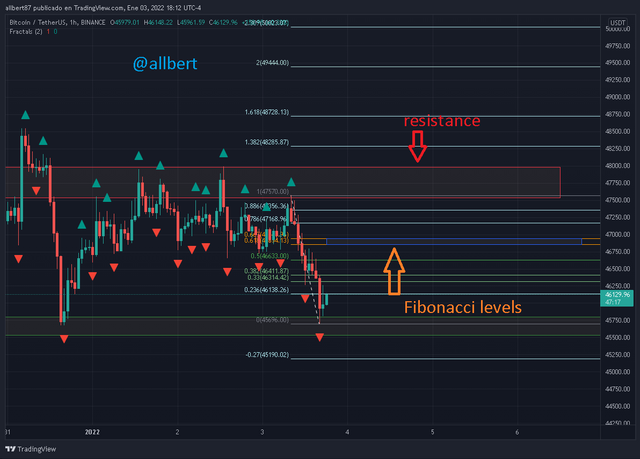
Image taken from: Source
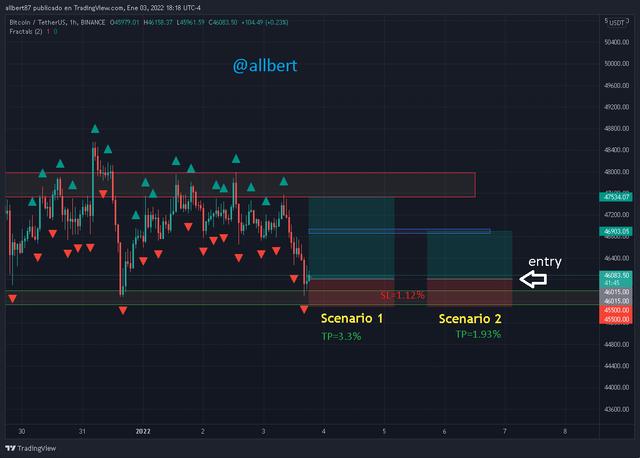
Image taken from: Source
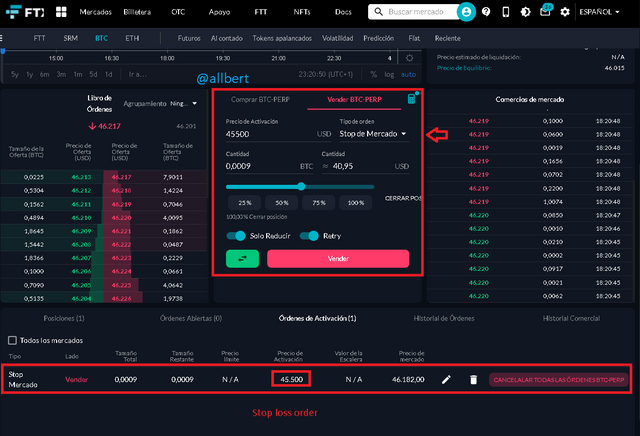
Image taken from: Source
Final Development
Throughout January 4th the uptrend developed as I had foreseen in my initial analysis. First, the William Fractal indicator showed 3 sell signals, before reaching the Fibonacci level of scenario 2. The funny thing is that at the Fibonacci level (46900 USD) there was no sell signal, so I did not sell. The magic happened later.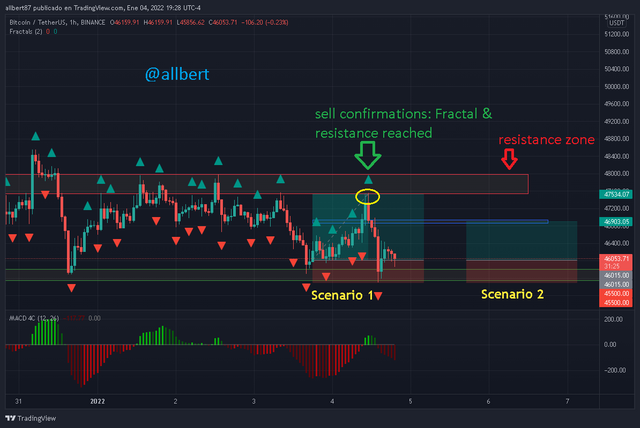
Image taken from: Source
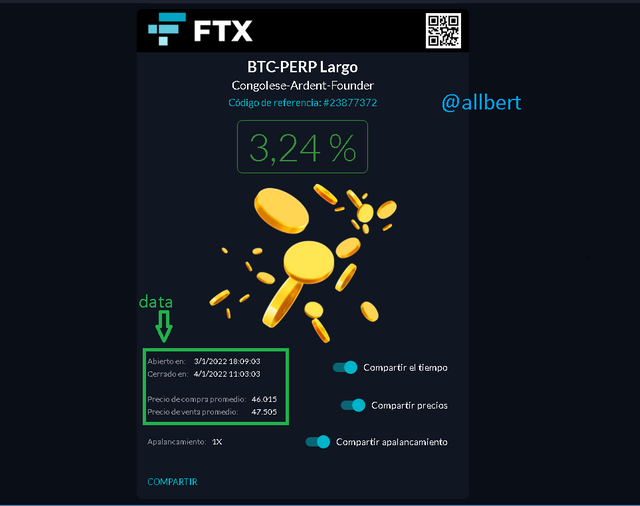
Image taken from: Source
Again we can see the change in the USD balance of my account due to this winning trade.
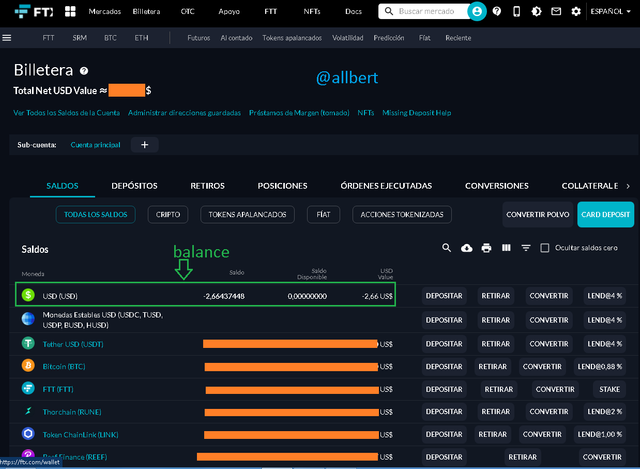
Image taken from: Source
CONCLUSION
I have tried many indicators and many strategies, but understanding the concept of Fractals has helped me to understand trading from another perspective.
In fact, thanks to this assignment, I have learned that fractals are not just random repetitive patterns, but to some extent, they show us exhaustion in the trends that can be used to take advantage of a great position in the market.
On the other hand, the William Fractal indicator has proven to be an invaluable tool to easily identify fractals and possible entry and exit points.
As a final comment, I must say from experience that we should never leave the responsibility of decision making to the indicator, but our entries and exits should be supported by a more robust analysis between reading other indicators, divergences, and market interpretation... the indicator should only work as a confirmation of what is already known previously in the analysis.