Crypto Academy / Season 3 / Week 8 - Homework Post for [@asaj] //Random Index (KDJ) INDICATOR
Hello Crypto Prof @asaj !
I am profoundly pleased to join the academy this week , i have learnt a lot from the post made by the professor , learning new indicators each week will help me improve my trading skills ,below is my homework task for this week :
In your own words define the random index and explain how it is calculated
Random Index is a popular technical indicator that is used to determine and compare the price movement of a particular coin in an exchange or trading platform, it is known to make trade well structured, accurate and efficient which is good in determining trends as well.
Just like the stochastic Oscillators the Random Index also knows as the KDJ indicator is known to many traders as a good trend determining platform. And KDJ was built as a clone of the Stochastic just that it has a line called the J-line, from my explanation you can clearly see why the Random Index is also known as the KDJ Indicator , the name was driven from the Lines that constitute it .
When the indicator is launched the K and D lines will show up their value when they reach the overbought or oversold point , usually some traders set it to 70% and 30% respectively and others also use 80% and 20% respectively , the J line also is use to determine the divergence of the K and D line.
Usually traders are advice to buy or sell when the line K and D crosses the overbought and oversold and the indicator is good when used within time frames of, 15m, 30m, h1, h4 it is not advisable for short time traders.
Is the random index reliable? Explain
If you ask a trader if about the reliability of an Indicator you won’t expect the same answer from everyone, Indicators cannot be used as a 100% confidential when trading, all you have to do is to consider risk management when it comes to risk management.
On the other hand Random Index will go a long way to assist you to get best results during trading you only have to combine it with other indicators for a trusted signal ,during my research I tested it with other indicators like the supertrend and it working perfect and giving good trend to follow.
How is the random index added to a chart and what are the recommended parameters?
In this part of the assignment I will be using TradingView platform to explain how to add the Random Index to a chart when trading.
- Launch the TradingView site and select the crypto pairs you want to trade in my case I am choosing STEEM/BTC.
- After the chart is opened click on the indicator button to open the indicator menu
.png)
- Search for the indicator KDJ Indicator
.png)
- After you find it click on it and it will be launched automatically on the chart, now we can format it by changing the colour of the lines or formatting the input to select good parameters for a good trade.
- Click on the format button as show below
.png)
- At the Style you choose the colours that you prefer
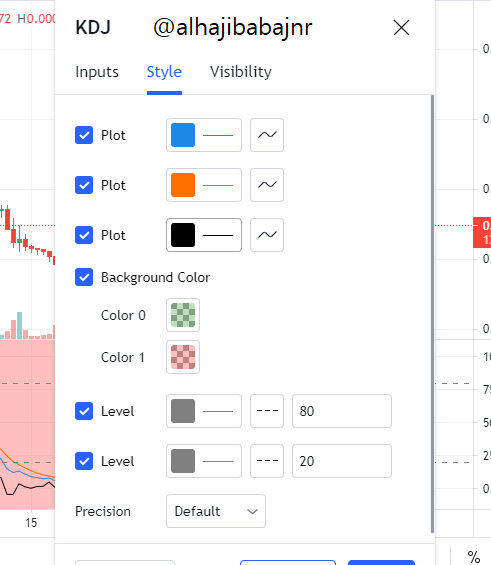.png)
- At the input you can change the period and the signal
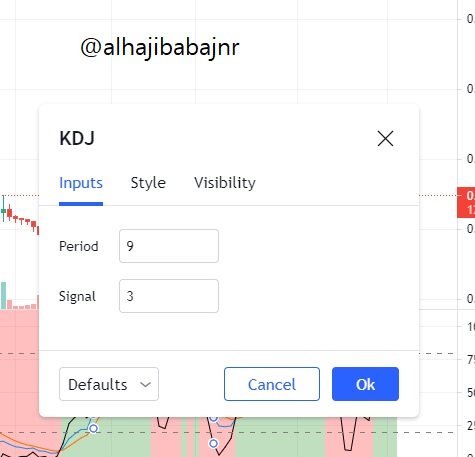.png)
- Visibility will also help you to determine the time frame
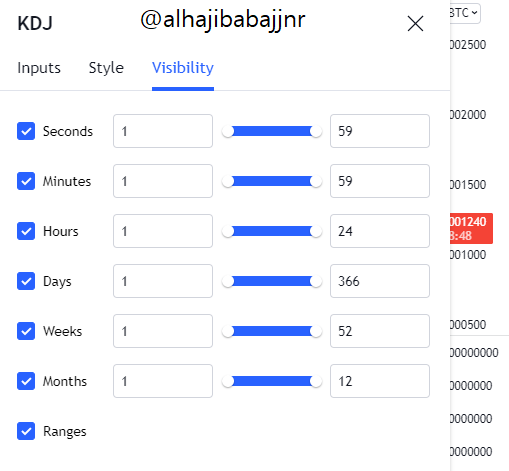.png)
WHAT ARE THE RECOMMENDED PARAMETERS OF THE KDJ INDICATOR
The default parameters at the input for all the lines are:
- K ,9
- D,3
- J,3
Some traders goes with the default way but it is known to record so many wrong signal so traders prefer to change the K-line input to 5,19 or 25.
Depending on the time frame you set at the visibility and the asset you are trading once can chose any of the K-line value stated above.
Differences between KDJ, ADX, and ATR
| KDJ | ADX | ATR |
|---|---|---|
| This is an indicator used to determine how an asset is overbought or oversold, it has three line where it got it name KDJ from The K and D line usually determines trends, there are ranges set like 80% so when it goes beyond it indicate that the asset is been overbought and another point can be set at 20% when it goes below it indicate that the asset is overbought hence there is likelihood for trend reversal. | This indicator help us determine the strength pushing a trend usually there is a range from 0-100 , depending on where the line falls a trader will determine the strength of the trend as to either they remain bullish or bearish will be decided. | This is used in measuring the market volatility of a particular crypto asset during trading, it comprises of a line that uses the space between the price movements to tell a trader how volatile whatever coin they want to invest in is. |
| It has a default input format of 9,33 and it has three (3) lines | It also has a default set up of 14,14,14 and has one line but it can be combine with other lines | It has default set of 14 with just one line |
Use the signals of the random index to buy and sell any two cryptocurrencies.
I will be buying GPBUSD using a demo account in MT4, I actually used the TradingView chart and the KDJ is showing an uptrend sign, I can see from the above the chart that the J line is below the K and D indicating an Uptrend and the K and D line is almost down halve the range of 70% I used as shown below:
.png)
So I am set to buy with my MT4 DEMO account , someone will ask if both platform are on the same real time , yes I used both for trial several time let apply the indicators and compare them.
In MT4 I used the Moving Average indicator to confirm if the coin is actually oversold and it showed a long bearish movement indicating that indeed there is an oversold market as shown below
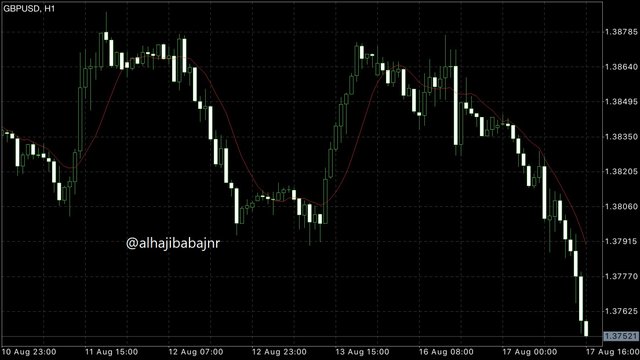
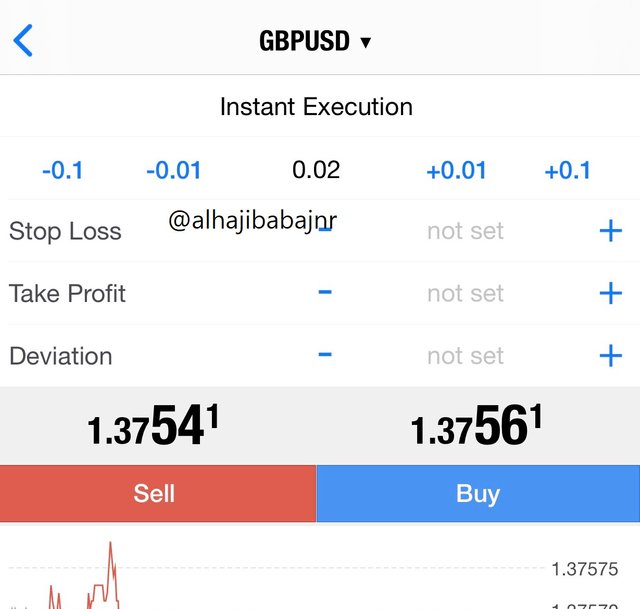
Hence likelihood of a trend reversal, so I bought the trading pair GBPUSD.
so let buy the pair :
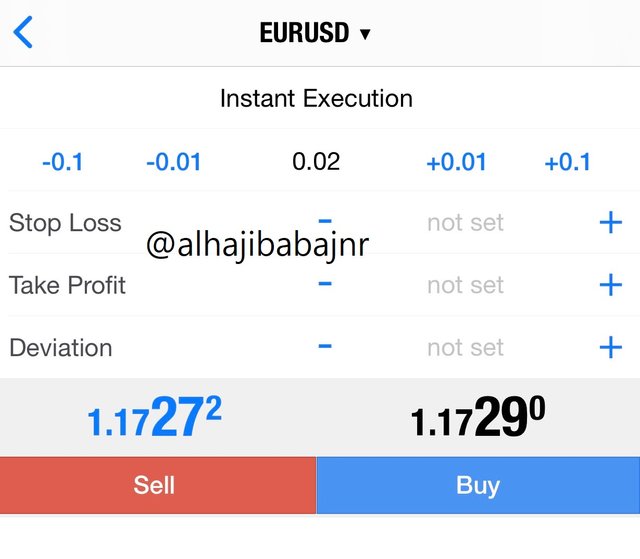
LET SELL EURUSD
First of all let go through the chart of the EURUSD and see what the indicator KDJ and Supertrend is telling us.
.png)
From the chart above KDJ is saying we should sell our asset it even started showing a red background and we can see the J L-line above the K and D , confirming this I will use the supertrend which is also telling us to sell it showed a red line now.
Let check if my MT4 indicator will confirm this at this moment:

From the chart above we can see that the Moving Average is actually below the price indicating a sell hence I will place a sell order as show below:
In conclusion I will like to thank the entire crypto academy team for their hard work in bringing to us this post every week, I am becoming a crypto person week after week, and let me thank @asaj for his marvellous work put to bring us this lesson in fact the KDJ indicator will go a long way to help me during my trading.
Good job @alhajibabajnr!
Thanks for performing the above task in the eighth week of Steemit Crypto Academy Season 3. The time and effort put into this work is appreciated. Hence, you have scored 7.5 out of 10. Here are the details:
Remarks
You have displayed a good understanding of the topic Alhaji Baba junior. You have completed the assigned task. Your answer to the second task most especially stood out.
Your work could have been better if you had paid more attention to the lexical structure of your sentences. As a suggestion, you can use the Grammarly plugin to improve your article.
thank you professor @asaj your remarks is noted