Steemit Crypto Academy Season 3 Week 4 - homework post for @reminiscence01 | Candlestick Patterns by @alexanderpeace
Greetings.
This is my homework post for Crypto Academy/season 3 /week 4- for @reminiscence01 | candlestick patterns.
Thank you professor for the lecture. Your style of delivery made it easy to comprehend.
QUESTION 1
In your own words, explain the psychology behind the formation of the following candlestick patterns.
Bullish engulfing Candlestick pattern
Doji Candlestick pattern
The Hammer candlestick pattern
The morning and evening Star candlestick pattern.
Candle stick pattern are important trading tools that show us the direction of price of a commodity in the market. Knowing how to read them will help a trader make good trading decisions. There are different psychologies behind various candlestick pattern formation and they play important roles in technical analysis. We are going to consider these candlestick patterns and the psychology behind them.
There are different types of candlesticks patterns and some of them includes;
• Engulfing Candlestick pattern. This is divided into bullish engulfing and bearish engulfing Pattern.
• Doji candlestick pattern. We have about five types of Doji. The long legged Doji, Dragonfly Doji, gravestone Doji, 4 price Doji and standard Doji
• Hammer candlestick patterns. This has an opposite called inverted hammer which is a bearish pattern of the hammer.
• Morning star candlestick pattern
• Evening star candlestick pattern
• Piercing line pattern
• Three white soldier's
• Hanging man Pattern
• Shooting star Pattern
• Spinning top pattern
• Falling three method and
• Rising three method and etc.
Having listed the types of candlesticks patterns, we are going to consider the psychology behind the formation of
• Bullish Engulfing Candlestick pattern
• The Doji candlestick patterns
• The hammer
• The morning star and evening star candlestick pattern
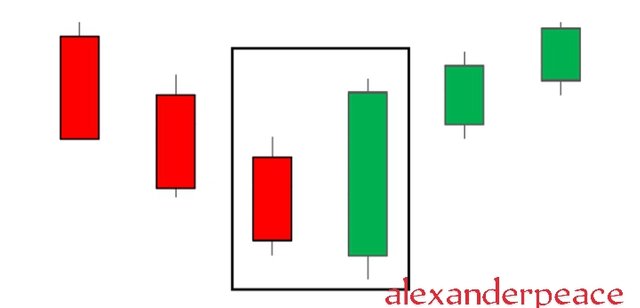
The bullish Engulfing Candlestick pattern is seen at the bottom of a downtrend and it signifies an increased in buying pressure. This pattern often brings about a reversal in trends because more buyers came into the market to move the price further.
The bullish Engulfing Candlestick pattern involves two candles with the second candle totally engulfing the body of the previous red candle. The opposite of this is bearish engulfing candlestick pattern
The Doji candlestick pattern is very easy to identify and they signify indecision in the market price. When the market price opens and closes at almost the same level within the time frame on a trade chart, the Doji is formed. Since the open and close takes place at almost the same price, it shows that the buyers and sellers are indecisive on which way to push the price.
There are 5 types of Doji but the first three are the commonest.
• Long legged Doji
• Dragonfly Doji
• Gravestone Doji
• 4 price Doji and
• Standard Doji
Let's take a look at their anatomy
Long legged Doji
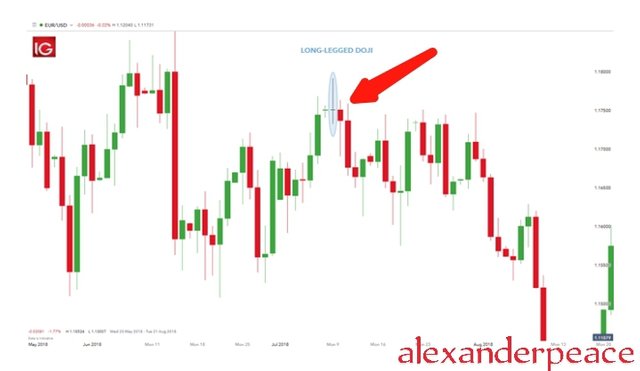
In long legged Doji, the vertical line extends above and below the horizontal line. This shows indecision between the buyers and sellers because within the time frame, the price action moved up and down but closed at almost the same level that it opened.
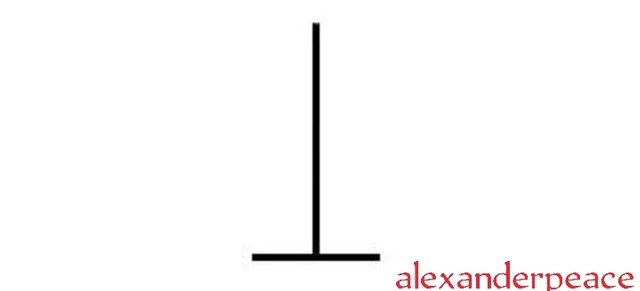
Dragon fly Doji

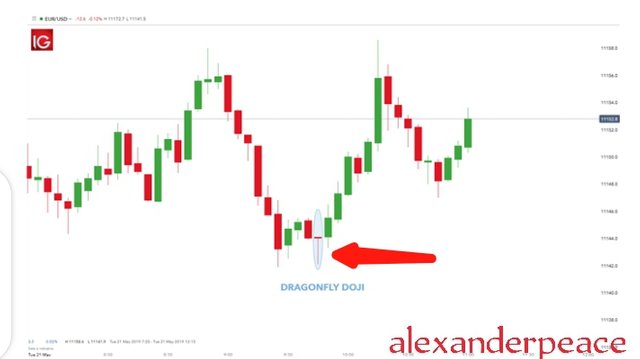
This shows a potential for a change in price direction. It can appear at the bottom of a downtrend or at the top of an uptrend. A line is above the horizontal bar forming a 'T' shape showing that price didn't move above the opening price. When this forms at the bottom of a bearish move , it's Bullish signal
Gravestone Doji
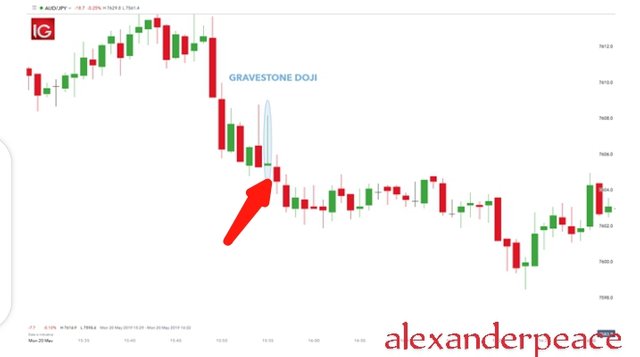
This is a reverse of the dragon fly Doji. When the price opens and closes at the lower end of the trading range, a gravestone Doji is formed. If it forms at the top of a bullish move, it's a bearish signal.
4 price Doji.

This candle stick pattern shows an extremely quiet market. It's just a horizontal line with no vertical below or above it. All the four points are the same signifying utmost indecision in market price.
Standard Doji
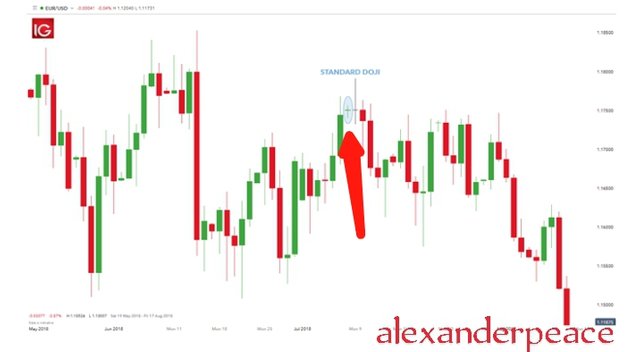
This doesn't mean much on its own. It a simple single candlestick. To understand it's meaning, the reader should observe the former price action that let to it's formation. If poses to be continuation of the trend it forms in.
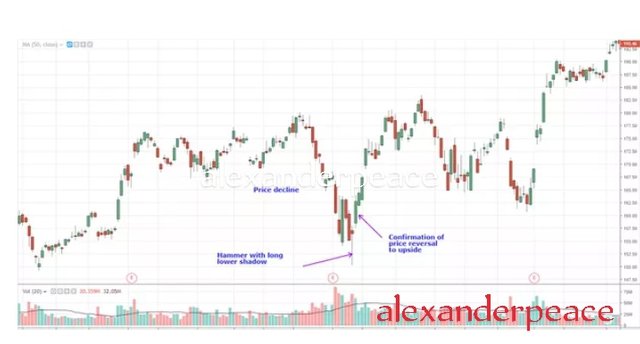
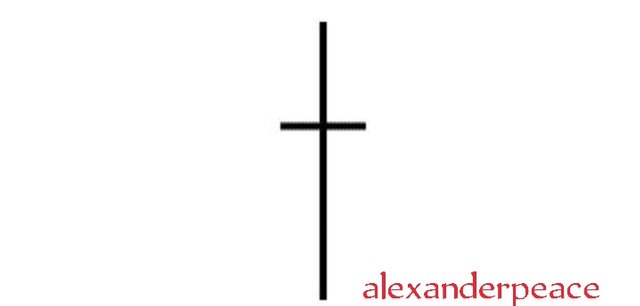
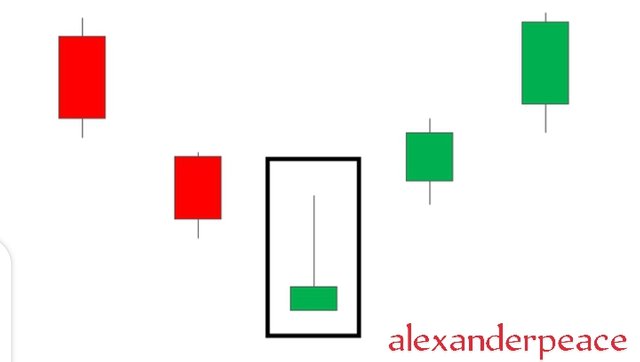
The hammer candlestick pattern looks like a hammer, hence the name. It has a short body at the top of the candle stick and a long lower wick with little or no upper wick. It's a single candle. The hammer candlestick pattern occurs after a decline in price. When the hammer is formed, it's a signal of a reversal of price to the upside. The price is expected to start moving up after the hammer. This is known as confirmation. The hammer looks like a 'T'. The psychology behind the hammer is that sellers were pushing down the price but later the number of buyers were more hence causing the price to go up.
Hammers even with confirmation are not used alone but alongside with other trend analysis tools and technical indicators.
The hammer has an opposite known as inverted hammer.
The inverted hammer is usually seen after a downtrend and also signifies that
buyers were initially in control of the price pushing it upwards but sellers took over.
The morning start candlestick pattern.
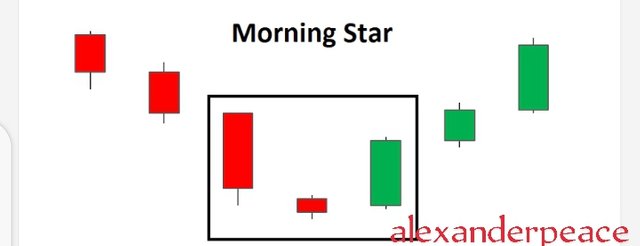
This consists of three candlesticks. It's a bullish reversal candle.
The first candlestick is a strong bearish candlestick that shows that the price is controlled by sellers.
The second candlestick is a small Doji candlestick which indicates that the sellers are weak and unable to further push the price down. This indicates that's there's a potential for price reversal because the present trend is weak.
The third candle is a bullish candle stick indicating that the price of the market is been controlled by the buyers. The psychology behind this candle stick pattern is that sellers were controlling the market price until they were over taken by the buyers. The morning star signifies a bullish reversal especially if it is formed at a support area.
The evening star candlestick pattern
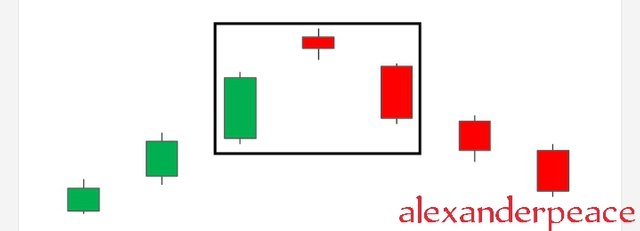
This too is made up of three candlesticks and it's the opposite of the morning star. It's a bearish reversal pattern.
The first candlestick is a bullish candle indicating that the price is controlled by buyers.
The second candlestick is a small Doji candlestick showing that buyers are unable to push the price up further.
The third candlestick is a long bearish candle engulfing the Doji candle. It indicates that the price is been controlled by sellers and these results to a profound selling pressure.
The evening star is a strong bearish reversal pattern especially if found at a resistance level. The psychology behind it is that the price of the market was initially controlled by the buyers but later the price was taken over by the sellers.
QUESTION 2
Identify these candlestick patterns listed in question one on any cryptocurrency pair chart and explain how price reacted after the formation. (Screenshot your own chart for this exercise)
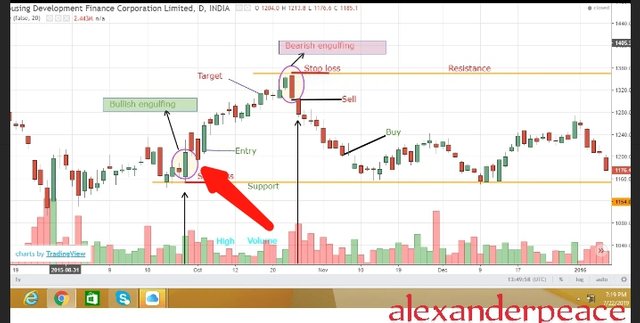
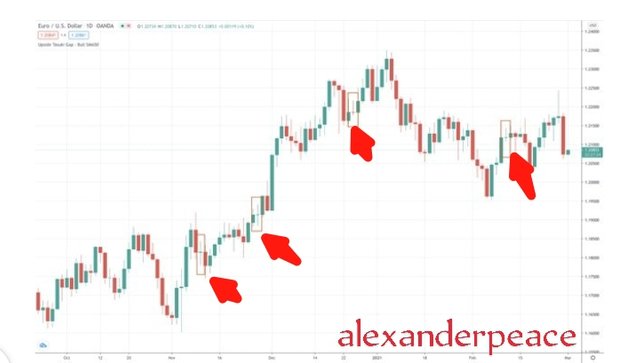
The Bullish Engulfing Candlestick pattern.
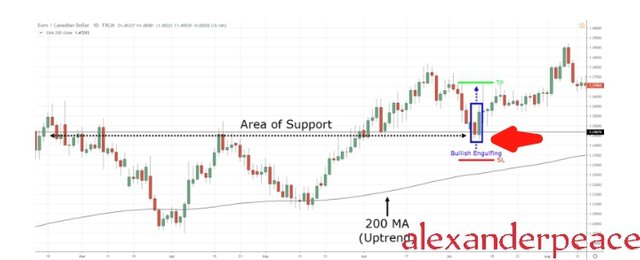
After the formation of the bullish engulfing pattern which was seen at the bottom of a downtrend in the chart, there was a reversal up the tree and price went up.
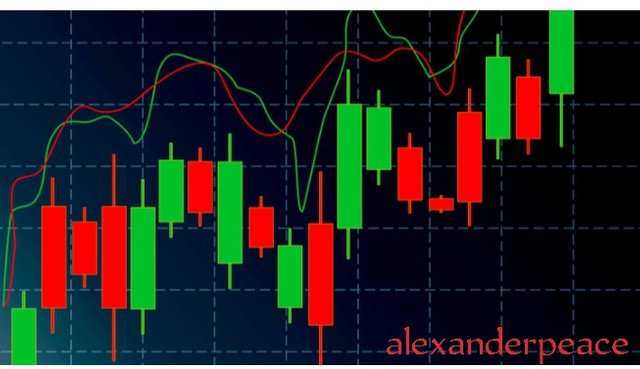
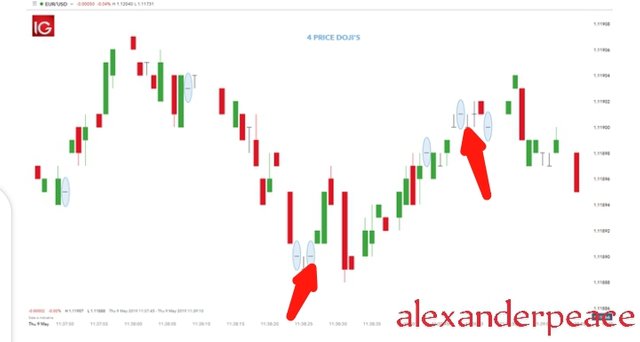
Doji candlestick pattern.
The chart comprises not just one type of Doji. Doji candle stick Pattern we know signifies indecision in price direction. At some Dojis formation, price went up while in some it came down.
The hammer candlestick pattern.
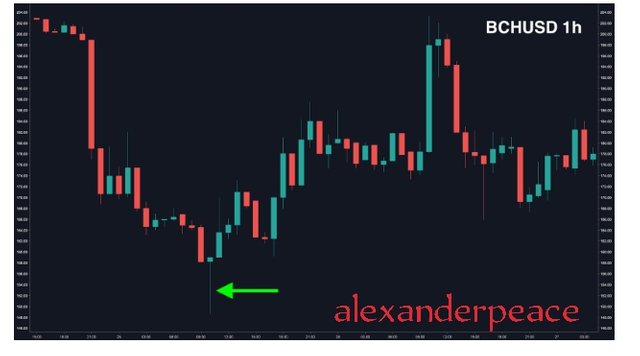
After the formation of the hammer below the price decline, there was price reversal in price. The price stated moved upwards as expected when the hammer is formed.
Morning star and evening star.
The morning star
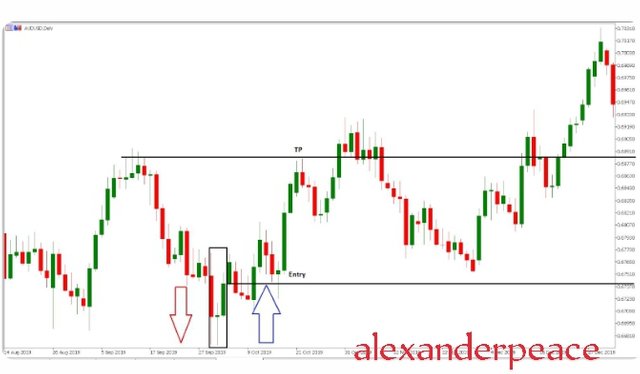
After the formation, we saw an increase in price which shows the bulls are gaining control.
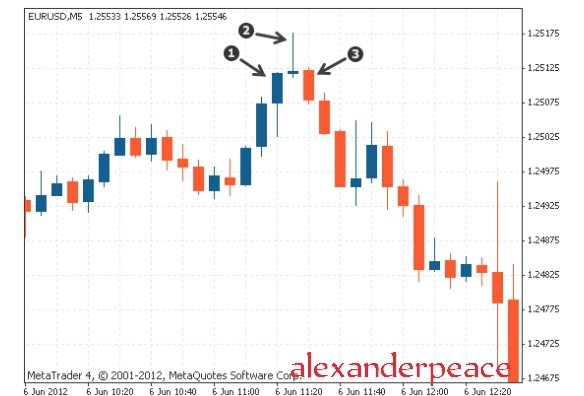
Evening star
We see the evening star candlestick pattern formation depicted by the three arrows. It appeared after an uptrend and hence a decrease in price followed.
QUESTION 3
Using a demo account, open a trade using any of the Candlestick pattern on any cryptocurrency pair. You can use a lower timeframe for this exercise.(Screenshot your own chart for this exercise).
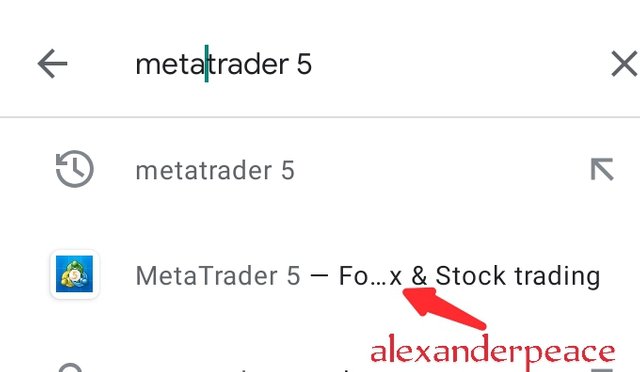
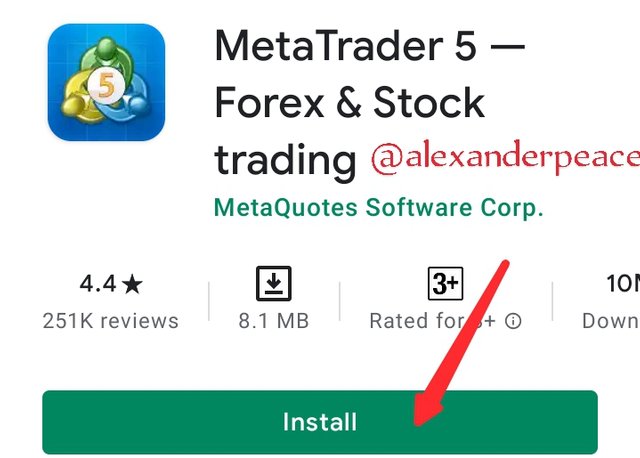
In order to carry out this exercise, I had to download a trading app as I didn't have one. So I went to google play and downloaded a the metatrader 5 app as advised by a senior steemian.
I installed the app and opened a demo account
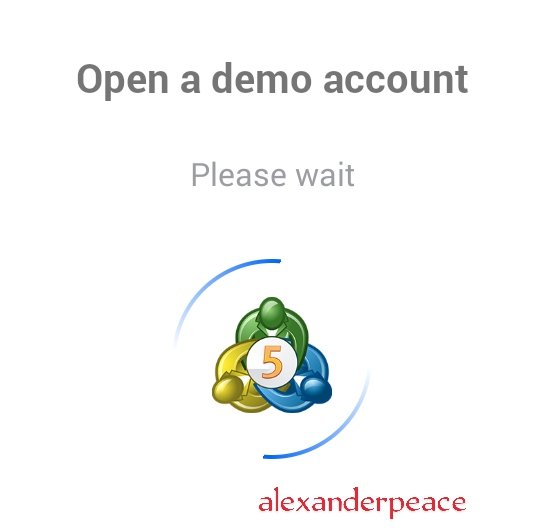
But I wasn't able to place a trade because metatrader 5 has closed trading for the weekend. I wasn't feeling well through the week. Just had this weekend to do this but this is where I got stuck. I couldn't explore other options because I was already out of time but I hope to do better next time.
Conclusion
Candlestick patterns are very important tools for technical analysis. To have better trading decisions, every trader must learn how to read candlestick charts.
Having see the most common candlestick patterns and understood the psychology behind them, I'd say that I'll be able to identify them in any chart. Thank you once more professor for the knowledge imparted.