Crypto Academy / Season 3 / Week 3 - Homework Post for @lenonmc21; All about Trends, Supports and Resistances and simple chart patterns by @alexanderpeace.
I want to first thank the professor @lenonmc21 for the lecture. It was eye opening and comprehendable. Having gone through the lectures, this is my submission post for the home work.
Define in your own words what is a "Trend" and trend lines and what is their role in charts?
I'll define trend as the common direction which the price of a commodity or an asset takes. A trend can be bullish or bearish. A bullish trend is an upward trend while a bearish trend is a downward trend. A bullish trend is represented by higher highs and higher lows while a bearish trend is represented by lower lows and lower highs.
To know more about trends, we employ the use of trend lines. Price directions are identified using trend lines. Trend lines are the lines that are drawn over high points and below low points that shows the predominant direction of price.
Trend lines optically shows support and resistance in a given period of time. They reveal the direction and how fast price moves and also shows price contraction. When two or more price points are joined, a trend line is formed.
Trend lines in chart are used to know price movement, it also shows support and resistance level. When you connect the high prices and low prices on a price chart, the outcome is a trend line. To construct a trend line, you need basically two points but the trend line becomes stronger if you connect more points. There are two types of trend lines. The ascending trend lines or uptrend lines and the descending trend lines or the downward trend lines.
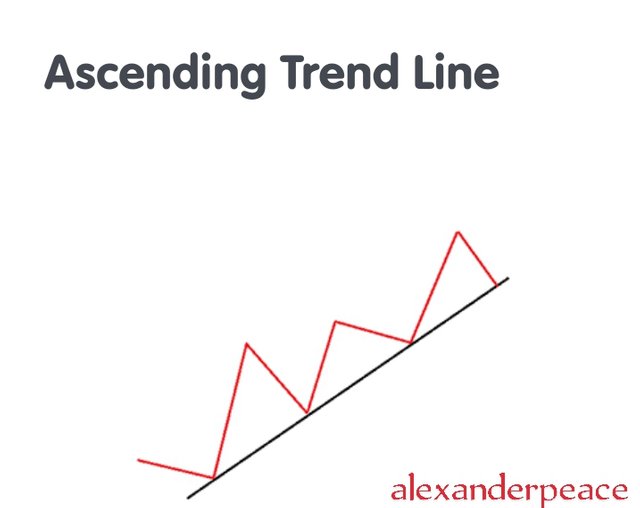
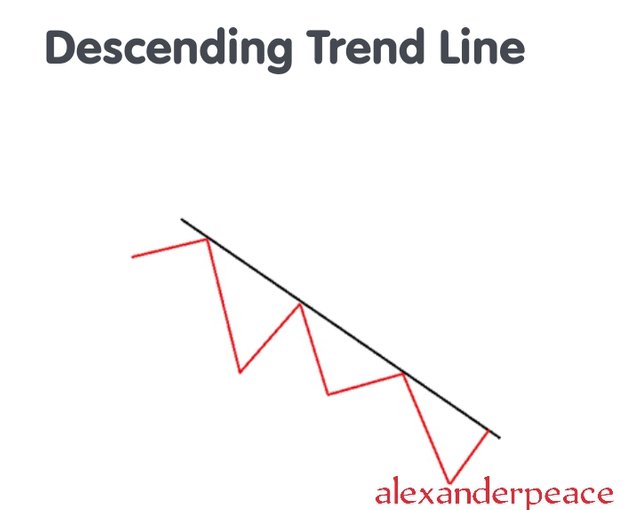
Explain how to draw an uptrend line and a downtrend line (Show a screenshot of each).
An upward trend line also known as ascending trend line is drawn when the lows are connected. Here the latest low price is higher than the prior low price, this shows support. The upward trend line has a positive slope that support price action showing that there are more buyers than sellers. A bullish trend forms as long as the price action remains above this line.
Source
The downward trend line also called descending trend line is drawn when the highs are Connected. Here the latest high is lower than the prior high, this shows resistance. It has a negative slope that acts as resistance to the price action, showing that there are more sellers than buyers. A bearish trend is form as long as the price action remains under his line.
Define in your own words what "Supports and Resistances are and how we can identify both zones (Show a screenshot of each one).
Support and resistance are popular trading concepts. Market prices we know always goes up and down. As the market price keeps increasing, the highest point which it reaches before it pulls back is resistance. In resistance level, there are plenty of sellers. When the price starts going up again, the lowest point which is gets to before it starts back is support. In support level, there are plenty of buyers. So as the price keeps going up and down, resistance and support is continually formed. So resistance seizes the price from going upwards while support stops the price from going downwards.

Identifying resistance and support
Resistance and support can be identified in various ways which includes;
• Peaks and lows
• using previous time frame
• Fibonacci levels
• Moving averages
• Trend lines
I'll explain how to identify resistance using peaks and lows.
Using peaks and lows
We'll use the screenshot below as an example.

The chart's highest point is marked as All time high (ATH) While the lowest point is marked as All time low (ATL).
The chart shows that the prices are in a downward trend. A short horizontal line is used to mark each peak and low. The lower high in the downtrend is resistance While the lower low is support.
The reverse is the case in the uptrend ad we see in the screenshot below.
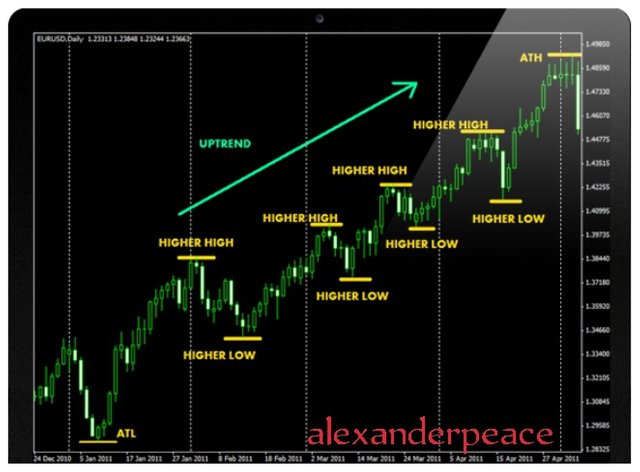
The higher low is support while the higher peak is resistance.
Explain in your own words at least 2 simple chart patterns with screenshots.
The two simple chart pattern I'll explain is double top and double bottom.
Double top
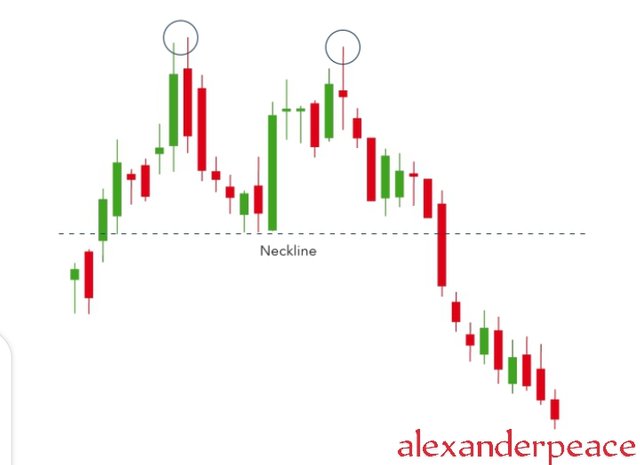
Double top charts shows trend reversals. Normally,the price is a commodity will always experience a peak before starting back to support level. It will go up again before going back more permanently this time against the trend that is prevailing.
Double bottom
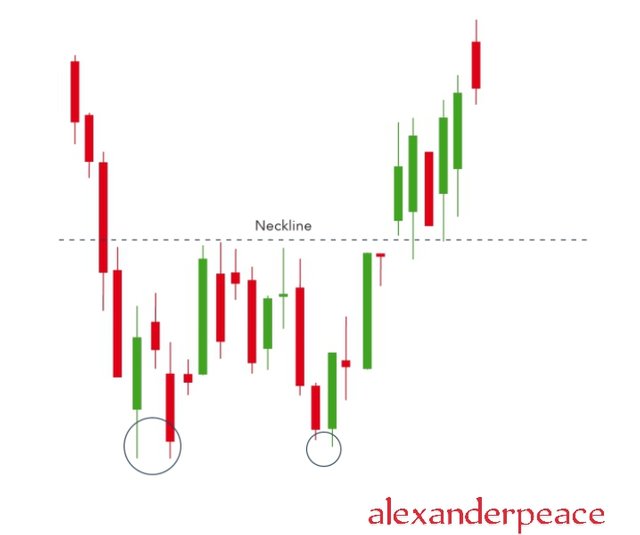
Double bottom charts shows a period of selling which causes the price of an asset to drop below support level. The price will then rise to resistance level and drop again. Finally the trend will change and start going up and the market will become bullish.
Double bottom shows the end of a down trend shifting towards an uptrend hence is a bullish reversal pattern.
Conclusion.
Trend helps us know the direction of price of an asset or commodity. Trend line is an important technical tool in trading analysis. It helps us to know the present direction of prices in the market. Just like the professor said
Trend is our friend.
If you want to make a good trade, identifying trend is the first step.