Crypto Academy / S4W2- Homework Post for @reminiscence01: Technical indicators by @alexanderpeace
Greetings, This is my homework post for the lecture. Thank you professor. It was educating.
The cryptocurrency world we know is very volatile in the sense that the prices of assets can change in seconds. These swinging up and down of prices and trends in the market needed to have a way in which they can be predicted so that traders can make good trading decisions hence making profits. These decisions are done by technically analysing the market and technical indicators are tools which help in technical analysis.
Technical indicators are mathematical patterns gotten through studying the past behaviours of price and trends in markets and then used as graphical representation to help give future clues on market prices and trends.
Trading analysts after studying past data of the market prices, volumes, traders psychology etc are able to forecast the movement of price in the future through the use of the technical indicators. Some traders use technical indicators alone for predictions but it's advisable to use technical indicators alongside other technical analysis tools.
Technical indicators are good technical tools because of the role they play in technical analysis. Some of those roles includes;
• Helping traders to ascertain the present state of the market.
Through technical indicators, the trader can know whether the Market is trending or not. One can also know the movement of the price of an asset and this can help the trader to make good trading decisions.
• Technical indicators can be used to manage a trade through the signals they give.
They show areas of resistance and support. An investor can know where to place the stop loss and take profit when placing the trade hence reducing losses.
• Technical indicators are good trading support tools and when combined with other indicators can provide trading signals.
Technical indicators are good for cryptocurrency trading because of the following reasons;
They are used for prediction of future price of an asset.
Technical indicators are basically used to forecast the future price of an asset. If the trader can be able to ascertain future movement of price through the indicators when used with other technical analysis tools or through the use of more than one indicator, he can be able to make good trading decisions and on time too.
Used for trade confirmations.
When other analysis tools are used alongside with technical indicators, it helps them work better and serve as tools for confirmation of price signals. They can also aid the trader detect signals that are not true hence avoid loses.
They serve as alert tools
The technical indicators can alert the trader on when the price is going down and which could mean to be at alert for a support break or when the price is going up which could mean to be at alert for a break in resistance.
To add technical indicators to my charts, I took the following steps.
Step 1
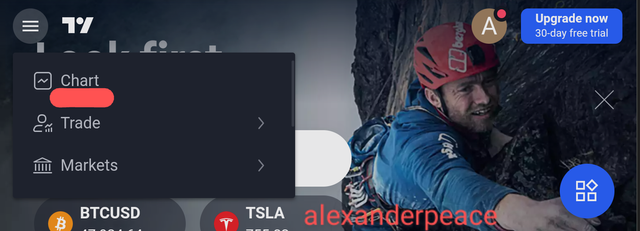
I opened the tradingview platform on my phone and clicked on charts.
Step 2
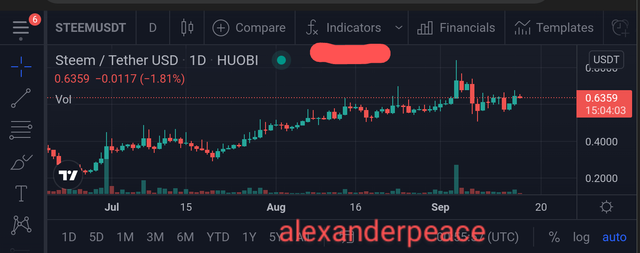
I proceeded to click on the indicator icon on the screen as shown in the screenshot below.
Step 3
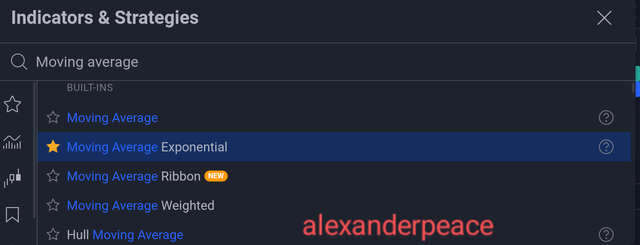
I searched for moving average and clicked on moving average exponential as it's already saved in my favourites. When I clicked on it, it was added to the chart.
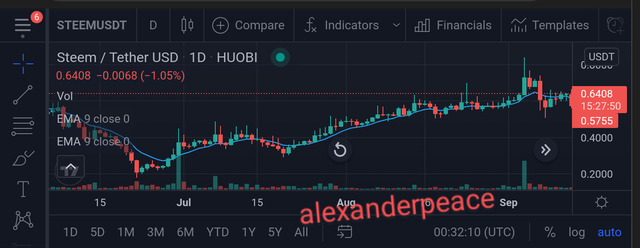
Step 4
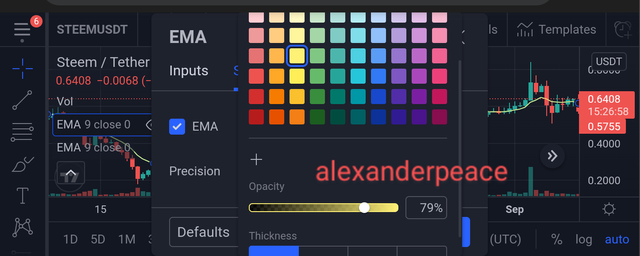
To configure it, I clicked on the setting and edited the incicator colour to yellow and and it opacity to 78% and click on ok and the configuration was put in place.
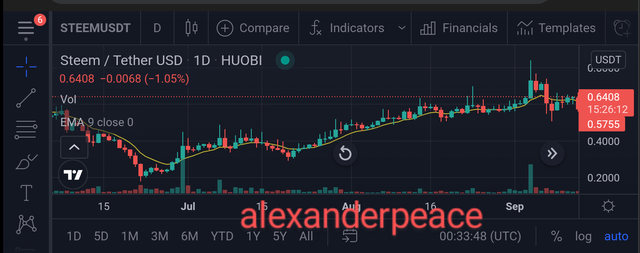
My configured chart
The categories of technical indicators includes:
•Trend based indicators
• Oscillator based indicators
• Volatility based indicators
Lets consider them individually with their examples.
The trend based indicators as their name implies are indicators that shows the trend in the market. They show whether the trend is moving up or down. They show trend direction and let the trader know if the trend really exists. The trend we know is our friend hence we can't trade against it. These indicators are useful to keep a tab on current market trends. Examples of trend based indicators are moving average, ichimoku, ADX (Average directional index).
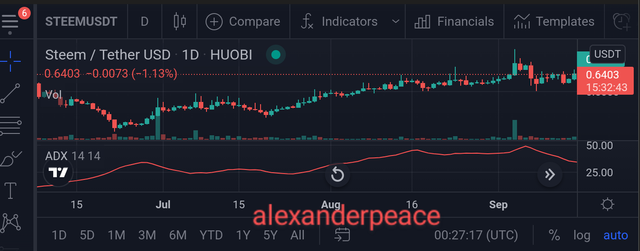
Screenshot of ADX on my chart: STEEM/USDT
The Oscillator indicators shows the momentum of the market. It helps the trader to know how fast the price of an asset is moving and also whether the price is going up or down. They show the momentum and direction of price movement of an asset. They show when an asset is over bought or over sold. An asset is said to be over bought when it's trading at a level that is believed to be higher than it's presumed value while it's oversold when it's selling at a level lower then it's presumed value.
Moving average indicators are used alongside with oscillator indicators to know when there's a breakout or change in a trend.
Examples of oscillator based indicators are stochastic, relative strength index (RSI), commodity channel index, moving average convergence divergence (MACD) and awesome oscillator (AO).
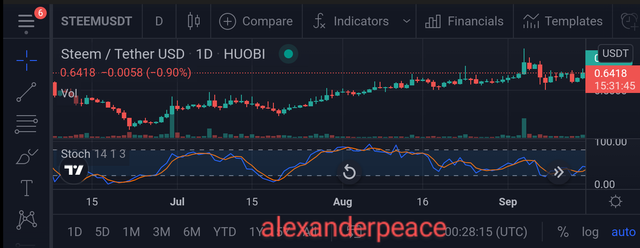
Stochastic indicator on my chart: STEEM/USDT
Crypto assets always experience swing in prices. One minute they are high and the other minute they are low. Hence volatility indicators shows when asset prices are high and low. When the market price swing is high, it serves as good opportunity for traders to sell while the low price swings are opportunities to buy. They therefore they show the transition periods from high volatility to low volatility of asset prices. Examples of volatility based indicators are Bollinger bands, keltner channel, Donchain channel, average true range.
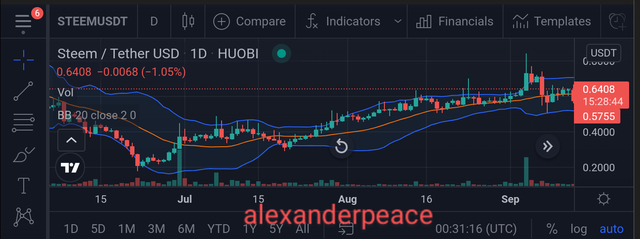
*Bolinger band on my chart: STEEM/USDT
Indicators are not advisable to be used as standalone tools for technical analysis because no indicators is 100% accurate hence they cannot be totally relied on alone to make good trading decisions. The Market changes can happen in split seconds and the indicator may be slow to reflect the change in market trend which may lead to losses if trading decisions are taken within this sensitive timing. Their efficacy is better when they are used along side with other technical analysis tools as support tools and for confirming signals in the market.
An investor can increase the success rate of a technical indicator signal by first understanding technical analysis and how technical indicators work as technical analysis tools. Some technical indicators are complex hence the investor should work with the indicator that works best for him and the one he understands it's mechanism of operation and the calculations behind it. Furthermore the investor should not use indicators as standalone tool but should combine it with other technical analysis tools or other indicators for optimum results. Having done these, there should be considerable success in the rate of the the indicator signal
Technical indicators are part of the technical analysis tools and play important roles in enabling the investor to make good trading decisions. The investor should understand different technical indicators and how they are used and he should use the indicator that bests suits him. The investor should also learn to combine technical indicators with other technical analysis tools to increase chances of profits and shouldn't not use indicators as standalone tools for trading because no singular technical indicators is 100% accurate.
Thank you for this lecture professor. I enjoyed the class.