Crypto Academy / Season 3 / Week 8 - Homework Post for @asaj | Random Index (KDJ)
Definition of the Random Index (KDJ) and calculation
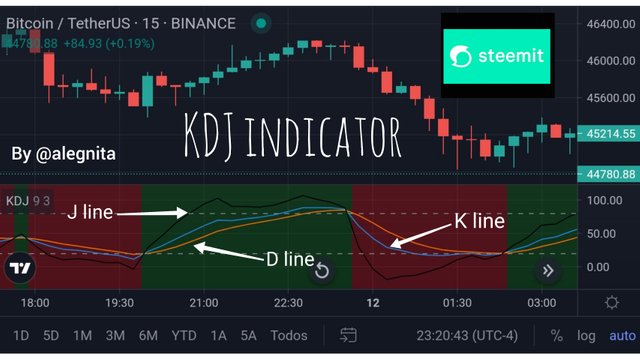
The Random Index (KDJ) is one of the new trading tools that serves to look for price's trending changes and it was developed in base of the stochastic indicator features: It has a pair of limits to measure the impulse of price behavior and three lines where two of them are the same %K and %D lines from the stochastic itself and the J line is the divergent result of D line from K line. Take a look on the following table.
| Line | Color | Formula |
|---|---|---|
| K | Blue | (Current Closing - Lower Low)/ (Higher High - Lower Low)*100 |
| D | Orange | Moving Average of K's 3 periods |
| J | Black | Divergence of D from K |
Like in the stochastic oscillator case, this analysis tool is excellent to look for overbought and oversold moments that will help to make excellent entries at the market, confirming all these with the simultaneous crossing of the three lines over the areas that are located outside from the bands of 20 and 80 or 30 and 70.
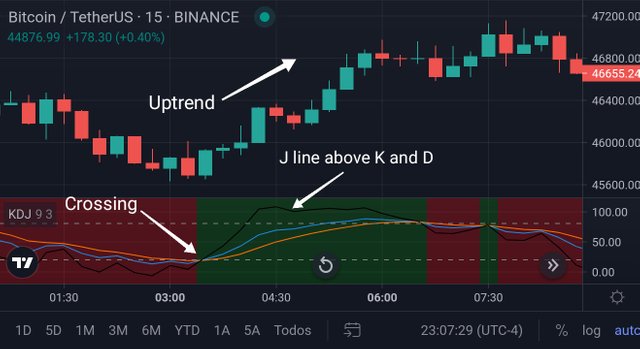
🔺 Sample for a Buy Position
The three lines must be starting to get crossed each other in the chart with J being above K and D. This crossing needs to take place ideally in the oversold area of indicator (0-30 or 0-20) to get a good buy entry due to the enough impulse of market and not resulted in an invalidated position by standing in the middle of the movement or a ranging.
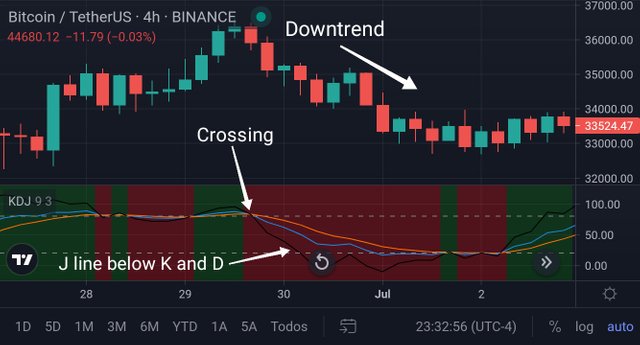
🔻 Sample for a Sell Position
The three lines must be starting to get crossed each other in the chart with J being below K and D. This crossing needs to take place ideally in the overbought area of indicator (70-100 or 80-100) to get a good sell entry due to the enough impulse of market and not resulted in an invalidated position by standing in the middle of the movement or a ranging.
Reliability of the Random Index (KDJ)
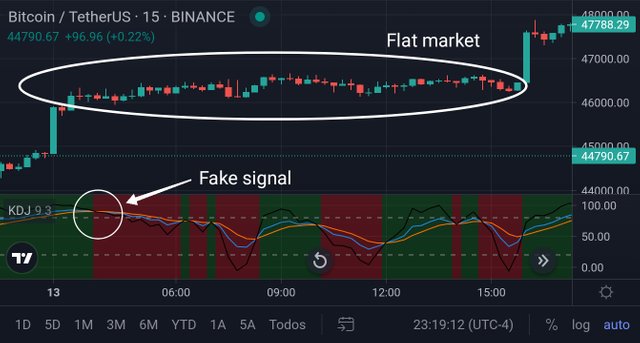
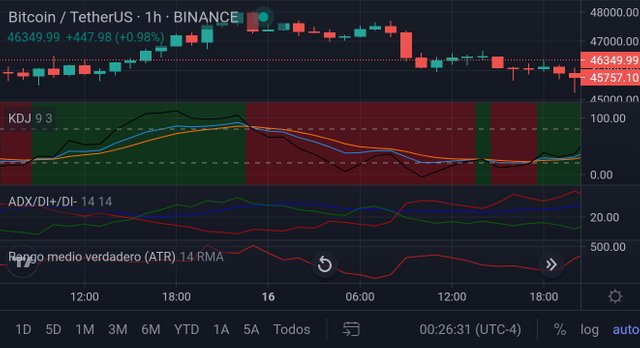
Like any indicator, this one is not 100% reliable so we have to sharp the scope and learn how to filter the fake signals that we might find easily on the charts. At this point, it's advisable to take in count the ones that are located in the overbought and oversold stages to ensure a good entry in the market due to the high possibility of a soon reversal, but must be entering soon at the limit bands' area because if not, we're in front of a ranging situation as we can see in the following example. It's also useful to add another indicator moreover of the KDJ to confirm signals with enough confidence. The ATR or ADX can be combined with the KDJ indicator when we apply our trading strategy.
Adding the Random Index (KDJ) at the chart with recommended parameters
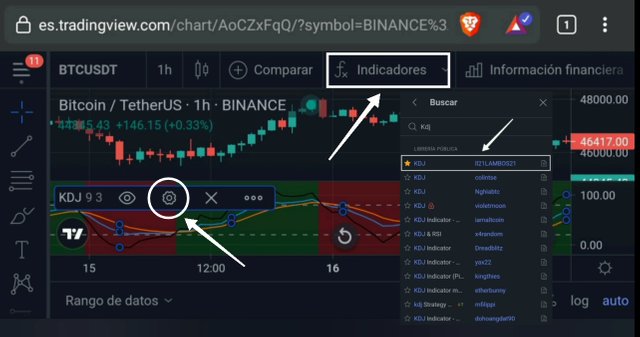
Located in the chart section of Trading View platform, select the Indicators button of main interface to look for the KDJ, configured by the advanced +Pro user ll21LAMBOS21. With this one we can have a color change of background every time the lines are crossing among them (green for Uptrending; red for Downtrending). Now we're ready to reach the parameter's icon that is also highlighted in the image.
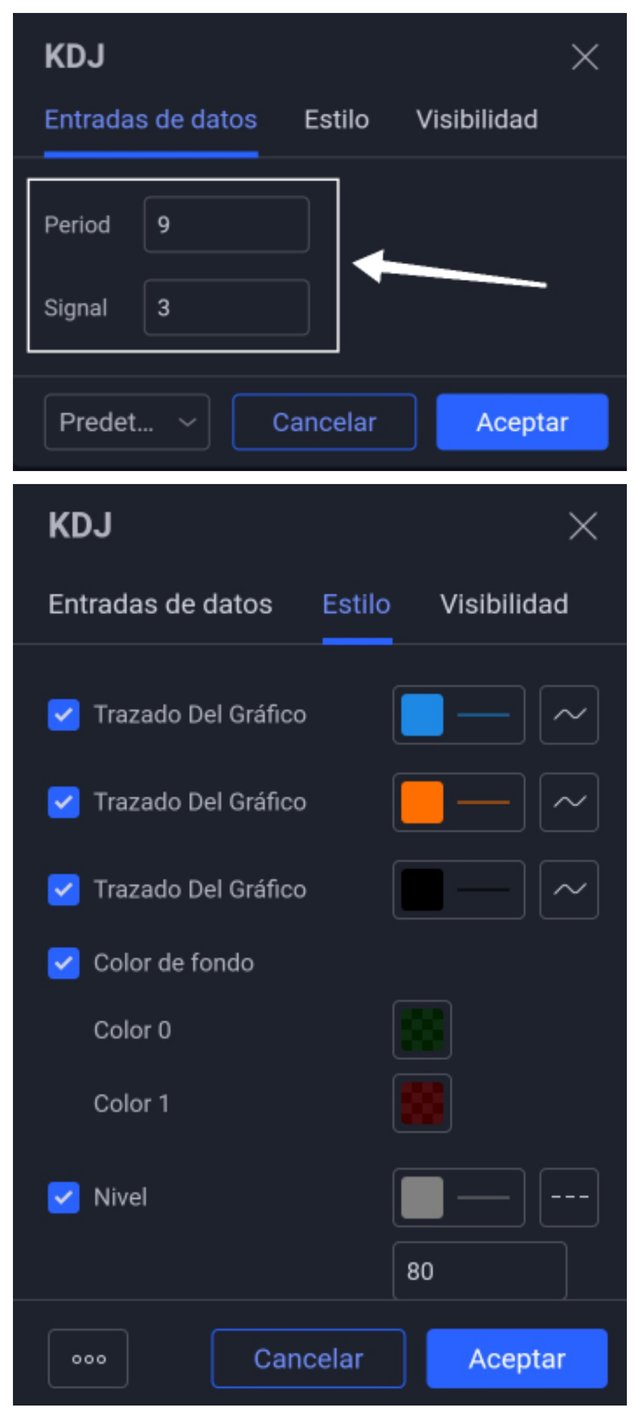
After making click over the settings option, we can set a period of 9 and signal of 3 as parameters of default and choose for the desired lines' colors.
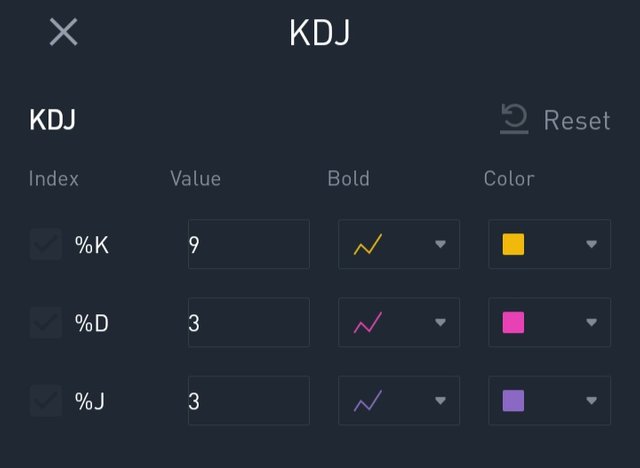
In Binance exchange, you can set the same values as we just did in Trading View.
Differences between KDJ, ADX, and ATR
Maybe we can find some similarities between these indicators, but each one has a particular characteristic that distinguishes one from another, so let's see:
✳️KDJ is based on the stochastic oscillator, so it acts like this one as a good one to measure overbought and oversold stages of price by seeing the location of crossing lines over 20/30 and 80/70 value respectively, moreover of indication of trending reversal.
✳️ADX is excellent to figure out when there's enough strength of the price's behavior to have an idea about when trending is gonna be keeping in that way, although it doesn't provide signals about current direction, if it's going uptrend or downtrend. So it needs the DI+ and DI- lines as extras for this purpose.
✳️ATR gives information about volatility and helps to predict price with certain margin because it takes in count the closing price of last period and the current maximum plus minimum values.
Using the signals of the Random Index to buy and sell cryptocurrencies
📈 Long position example
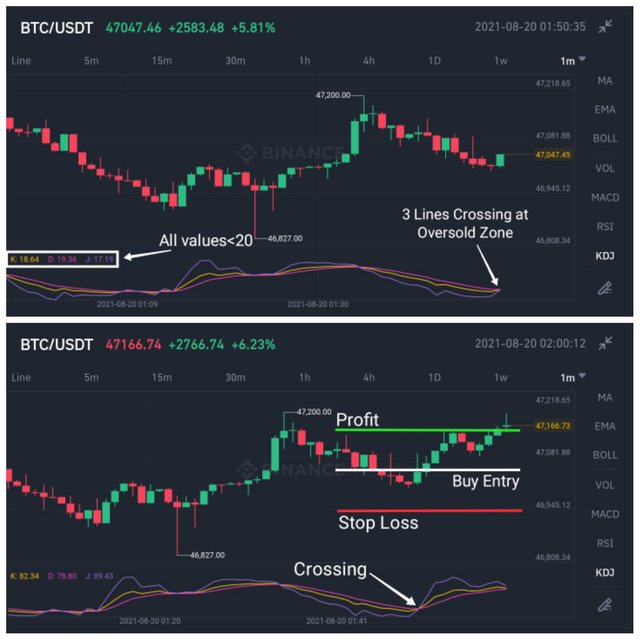
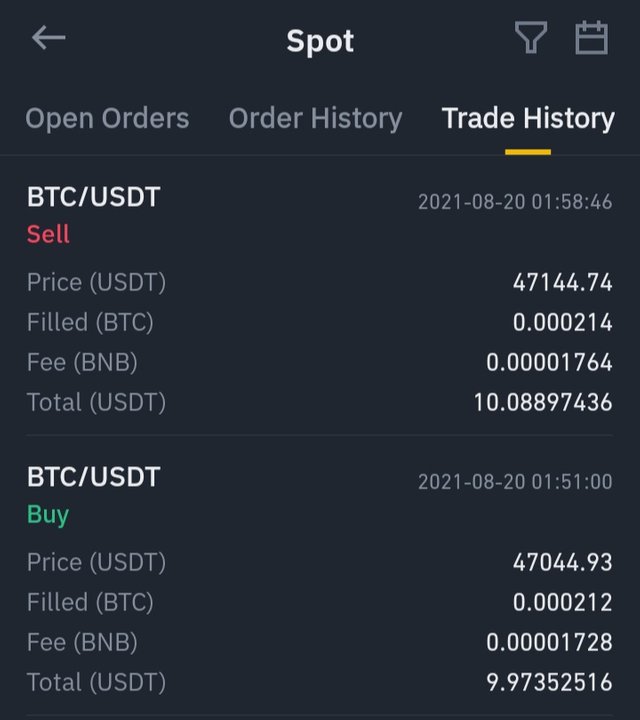
In the BTC-USDT pair from Binance (1minute), let's wait for the location of three lines' crossing over the oversold zone of the indicator (0-20). This was possible for the values of 18.64 for K, 19.36 for D and 17.19 for J approximately. Of course J line must be above the K and D lines. Once this crossing takes place and these three lines will start to divergence by leaving the oversold zone, it's the perfect moment to set a Buy Position of 47.044,93 with a 1:1 Radio Reward to get 46.945,12 as Stop Loss and 47.144,74 as Profit.
📉 Short position example
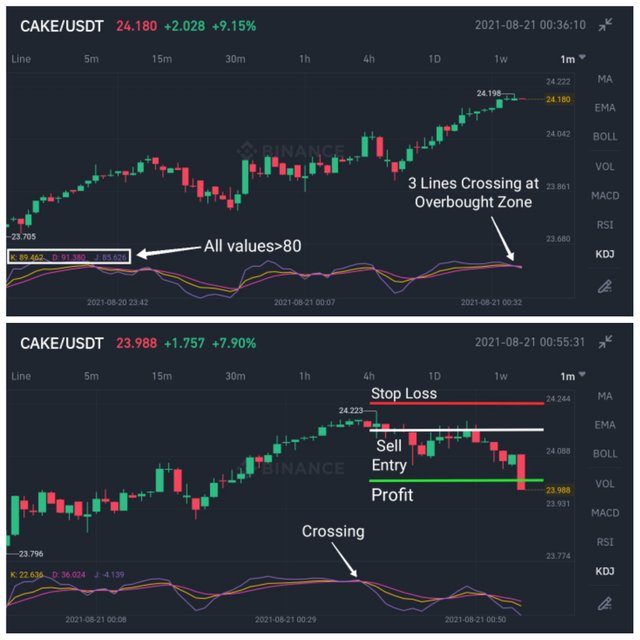
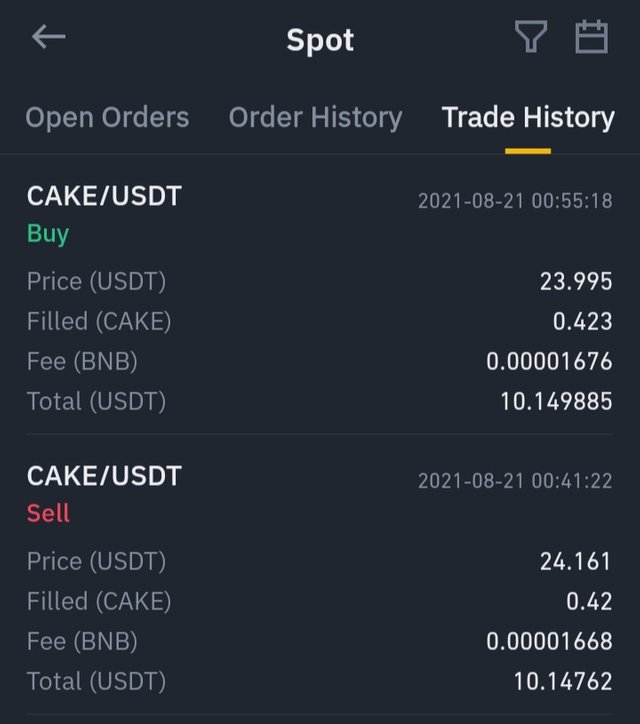
In the CAKE-USDT pair from Binance (1minute), let's wait for the location of three lines' crossing over the overbought zone of the indicator (80-100). This was possible for the values of 89.462 for K, 91.380 for D and 85.626 for J approximately. Of course J line must be below the K and D lines. Once this crossing takes place and these three lines will start to divergence by leaving the overbought zone, it's the perfect moment to set a Sell Position of 24,161 with a 1:2 Radio Reward to get 24,244 as Stop Loss and 23,995 as Profit.
👷🏻♀️>>~•Alegn@•~>🎶
*** See you in next post *** 📝
Hi @sputnik1, thanks for performing the above task in the eighth week of Steemit Crypto Academy Season 3. The time and effort put into this work is appreciated. Hence, you have scored 4.5 out of 10. Here are the details:
Remarks
Overall, you have displayed a good understanding of the topic. You have performed the assigned task. However, you did not provide new information to this course, as most of the points mentioned have been indicated by several participants. You answer to the second task could have been more original and clearer.
Thank you professor. Maybe I should have done an extra research: due to the novelty of this indicator I wished to figure out for instance why 9 and 3 are the best settings and I couldn't get something useful for my task. My best regards then. It was a great time to know about KDJ thanks to your lesson.
P.D.: Is that my real grade? Can you check your observation? You're mentioning another person by the way.
#venezuela #affable