Crypto Academy / Season 3 / Week 6 - Homework Post for @cryptokraze | Liquidity levels
Liquidity Levels' Definition and Examples
Liquidity Levels are those values of price where is most likely to fulfill practically with all the orders that were set in a determined moment at the market space. In other words and cases, I'm talking about levels that will execute an important number of Triggered Profits/Stopped Losses, guaranteeing liquidity in the market so that's why the name of Liquidity Levels. These ones used to be characterized by hammers or pinbars of candlesticks with a fast reversal of trending and it's usual to notice a higher volume of transactions during the standing of these levels, so they also get completed quickly once these points are reached.
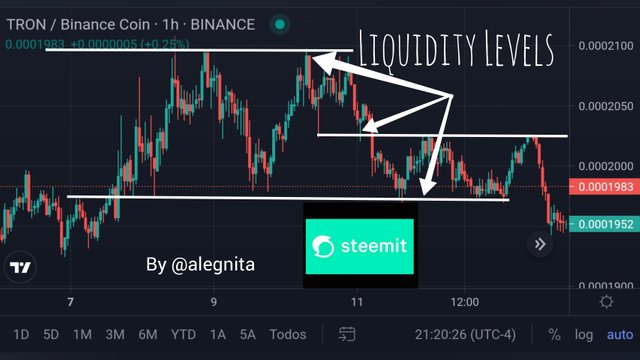
According to the presented image from the TRX-BNB (1h frame), we can ensure these Liquidity Levels acting like supports or resistances too in the values of 0.0002096, 0.0002025 and 0.0001974, respectively.
Main reasons by getting trapped in fakeouts
When some traders are beginners without enough experience, it's expected to easily think that they would be gaining a lot in a sudden bullish/bearish trend, then set an order expecting that behavior to still continue, but it might be presented the fact of certain whales (I mean important holders of assets) that decide to manipulate this price by trading a higher volume than usual, making to soar it and getting rid of the order profit/stop loss of many traders with an average amount of money (retailers). Let's see the following examples for the opposite cases.
📈Typical fakeout at Buy Scenario
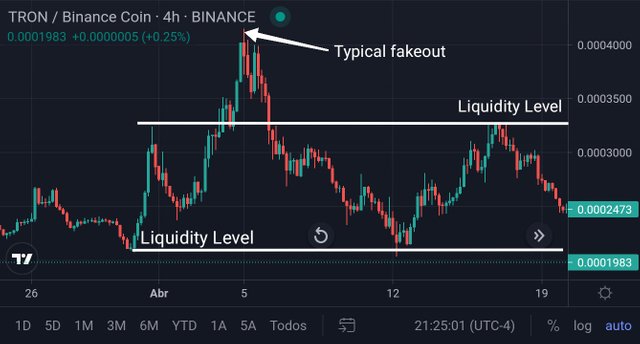
The value of Tron has a certain range of price that doesn't usually change too far, so we might consider by the moment the cypher >0.0004000 as something like taking place in a sudden and "surprising" raising for experienced people, but newbies that hasn't no idea about the possibility of a temporary scene, can be buying at the highest peak, thinking would be still rallying until they'll realize it was a wrong decision. Instead, they should wait for the reaching of 0.0003300/0.0002000 (Liquidity Levels) to apply the strategy of MSB or BRB, depending the market's situation.
📉 Typical fakeout at Sell Scenario
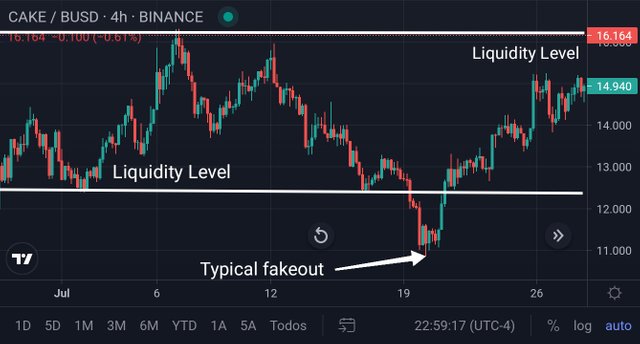
For the contrary, when price starts to reach strange values below and too further from the Liquidity Levels that are acting as support in the case of downtrending market, beginners might be thinking this is gonna continue for a while. So, they start to sell at these lower lows, but at the moment to the soon finishing of this price's behavior and then reversal is showing up to bringing it towards the usual levels (Liquidity between 12.35/16.65 in these examples), they'll be wondering what happened.
Criteria by trading the Liquidity Levels in the right way
We can relief on a pair of useful strategies to make a proper analysis in order to avoid getting trapped in these fakeouts: Market Structure Break
and Break Retest Break strategies that we previously learned in this season to enter at the market and then set up orders to ensure a good profit with minimal loss. Let's read these instructions:
~In first place, look for a wide time frame like 1 day or 4 hours to study and see how's the current trending from a general point of view.
~Next, display a shorter time frame like 5 or 15 minutes to figure out how's the closer scoop to enter at the market by waiting for an important strength of trending towards the Liquidity Levels, according to the selected strategy criteria (MSB if market is reversed and BRB if continues).
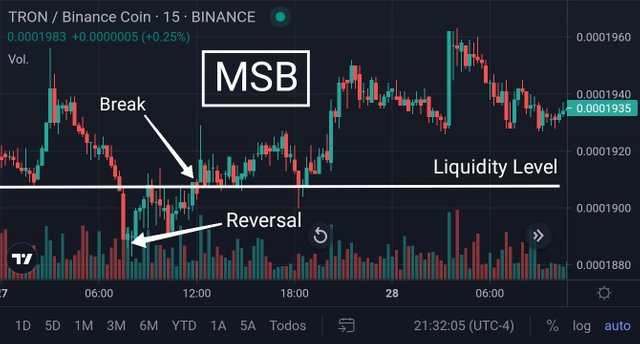
🔶 Example for a MSB case
For the following TRX-BNB pair 15 minutes frame chart, there was a clear change of downtrending to uptrending in 0.0001184 by waiting to see a Higher Low in 0.0001893 and then a break of market by crossing the level of Liquidity in 0.0001908 to stablish a good entry to start trading with a proper radio reward and avoid an important loss, plus seize profit. This strategy is perfect to enter at the reversal of trending in several opportunities to do it.
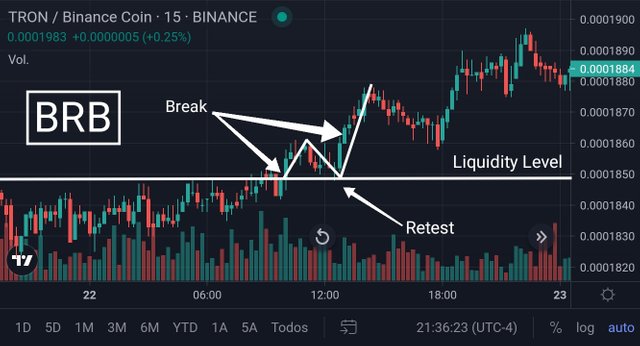
🔶 Example for a BRB case
For the following TRX-BNB pair 15 minutes frame chart, there was a clear break of Liquidity Level in 0.0001850 by waiting to see a Swing in 0.0001860 and then a retest on the same level that will go back uptrending again to stablish a good entry to start trading with a proper radio reward and avoid an important loss, plus seize profit. This strategy is perfect to enter at the continuation of trending in several opportunities to do it.
Drawing Liquidity Levels trade setups on 4 Crypto Assets
🔺Demo N°1
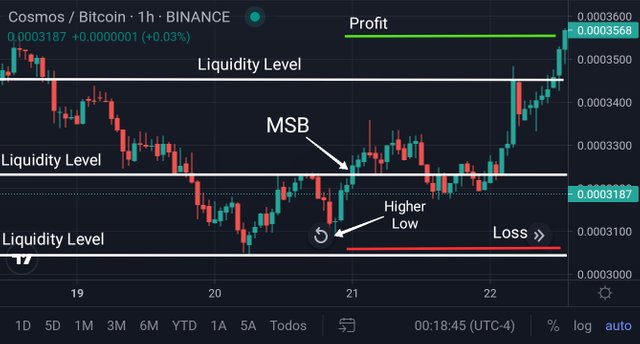
Using the ATOM-BTC pair from Binance exchange, I looked for the 1 hour time frame to set the levels in 0.0003050, 0.0003230 and 0.0003450, according to the presented chart. With a Liquidity Level of 0.0003050 acting as support, there was a Higher Low in 0.0003088 that went uptrend and price got surpassed by another Liquidity Level in 0.0003230 (MSB in 0.0003232), so here I can make a Buy Entry in 0.0003234, then put a radio reward of 1:2 with 0.0003564 as Profit and 0.0003069 as Stop Loss.
🔺Demo N°2
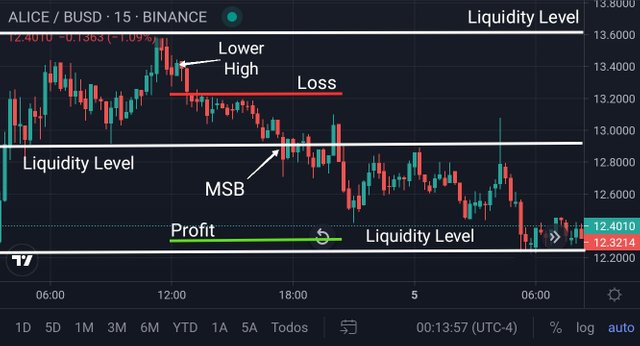
Using the ALICE-BUSD pair from Binance exchange, I looked for the 15 minutes time frame to set the levels in 12.2610, 12.9010 and 13.6005, according to the presented chart. With a Liquidity Level of 12.2607 acting as resistance, there was a Lower High in 13.4010 that went downtrend and price got surpassed by another Liquidity Level in 12.9330 (MSB in 12.9320), so here I can make a Sell Entry in 12.9310, then put a radio reward of 1:2 with 12.3310 as Profit and 13.2310 as Stop Loss.
🔺Demo N°3
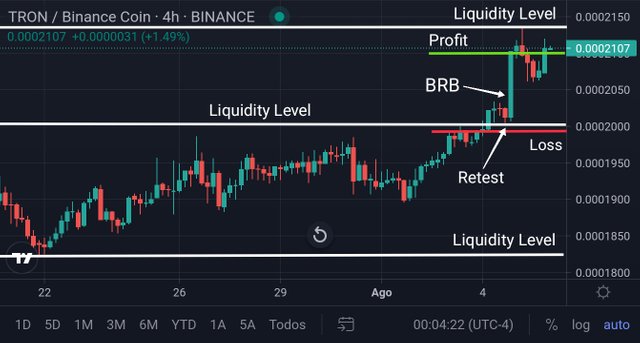
Using the TRX-BNB pair from Binance exchange, I looked for the 4 hours time frame to set the levels in 0.0001825, 0.0002000 and 0.0002140, according to the presented chart. With a Liquidity Level of 0.0002000 being crossed by price and then pull back again to retest in the mentioned Liquidity Level, we can now set a Buy Entry of 0.0002048 after breaking one more time on the Swing Point of 0.0002035 for a radio reward of 1:1 with 0.0002100 as Profit and 0.0001996 as Stop Loss.
🔺Demo N°4
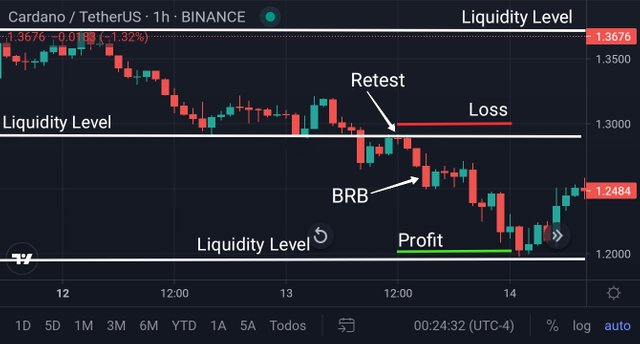
Using the ADA-USDT pair from Binance exchange, I looked for the 1 hour time frame to set the levels in 1.1985, 1.2970 and 1.3680, according to the presented chart. With a Liquidity Level of 1.2970 being crossed by price and then pull back again to retest in the mentioned Liquidity Level, we can now set a Sell Entry of 1.2500 after breaking one more time on the Swing Point of 1.2700 for a radio reward of 1:1 with 1.2000 as Profit and 1.3000 as Stop Loss.
👷🏻♀️>>~•Alegn@•~>🎶
*** See you in next post *** 📝
Sort: Trending
Loading...