Crypto Academy / Season 3 / Week 4 - Homework Post for @reminiscence01 | Candlestick patterns
Introduction
Any trader must be aware of the potential of many tools that will help him to seize the infinite opportunities of taking good profits from his management technique of trading through them. So, one of these are the candlestick patterns that respond to the current situation occurring in certain moment at the market and we'll be addressing some of few concepts to learn about and grab them in our future movements on charts. Let's see.
Popular candlestick patterns
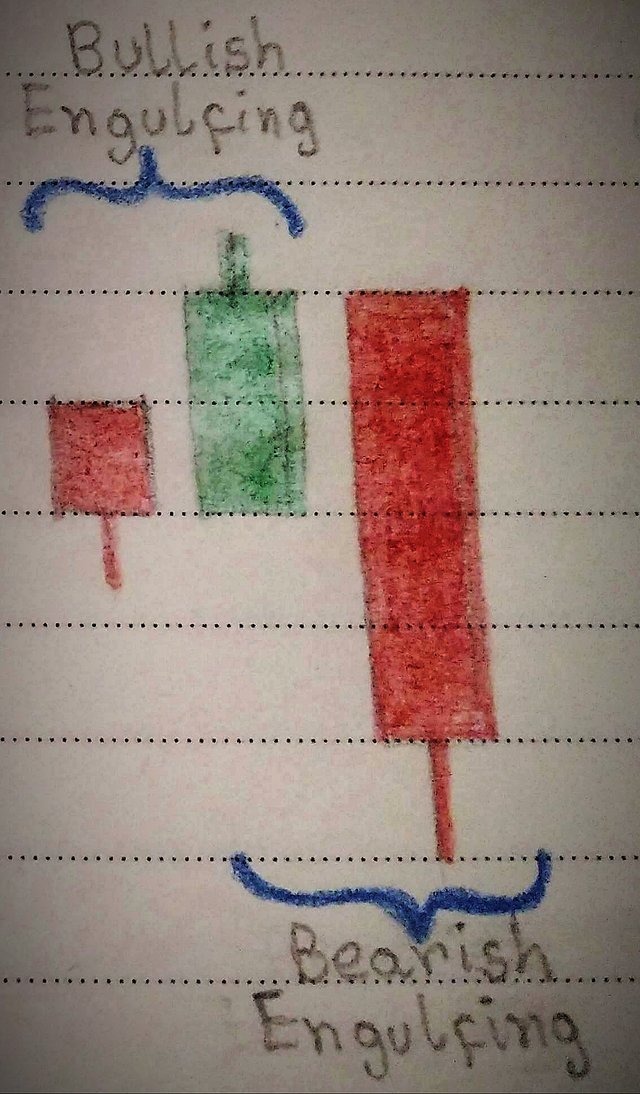
🕯️Bullish/Bearish Engulfing pattern
~Bullish: This is presented at the final stage of a downtrending, when selling energy ends and buyers now are taking control of the market, so it tends to be reversed with opposite direction (now it goes up) after the creation of a green candle that is wider than the previous one and will completely cover or "engulf" its body.
~Bearish: This is presented at the final stage of an uptrending, when buying energy ends and sellers now are taking control of the market, so it tends to be reversed with opposite direction (now it goes down) after the creation of a red candle that is wider than the previous one and will completely cover or "engulf" its body.
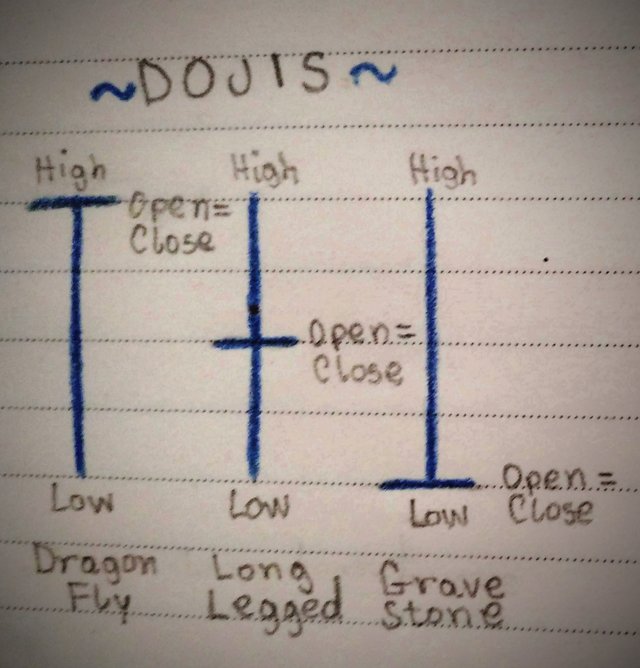
🕯️Doji pattern
This is like "the perfect equilibrium" in the price that is presented in the market by certain moment because neither buyers nor sellers are capable to form a wide body of the candle, despite there's a High/Low of price but space between Open/Close is very narrow tending to zero, so over here there's no control between both groups and it's advisable to wait for a pair of new candles to ensuring the new direction.
We might get three sub-patterns from this one like the Dragonfly Doji, where means a possible bullish reversal after a downtrending because buyers could push up the price and Gravestone Doji, where means a possible bearish reversal after an uptrending because sellers could push down the price. The Long-legged Doji is the "medium term" between them.
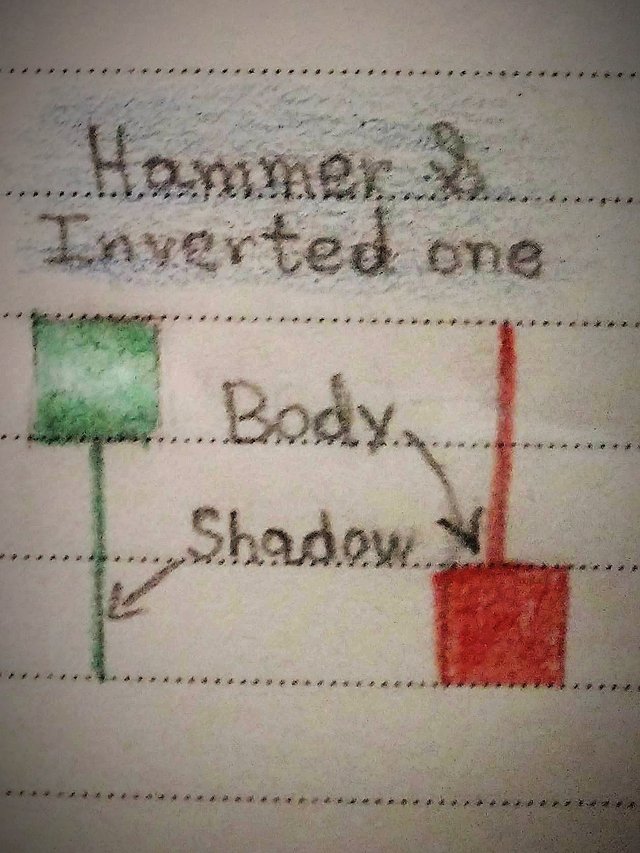
🕯️Hammer pattern
Usually formed in a support/resistance level and serving as an important reversal of the market, it shows the price reached out beyond at a certain value for the specific direction but then got back quickly close to the opening price due to the rejection movement of buyers, in the case of downtrend stop in a support or for stop uptrending from sellers in a resistance, we have an inverted hammer. For both cases we always see the hammer's body and shadow (wick), which is the evident quick sweep of the price from one of the bands.
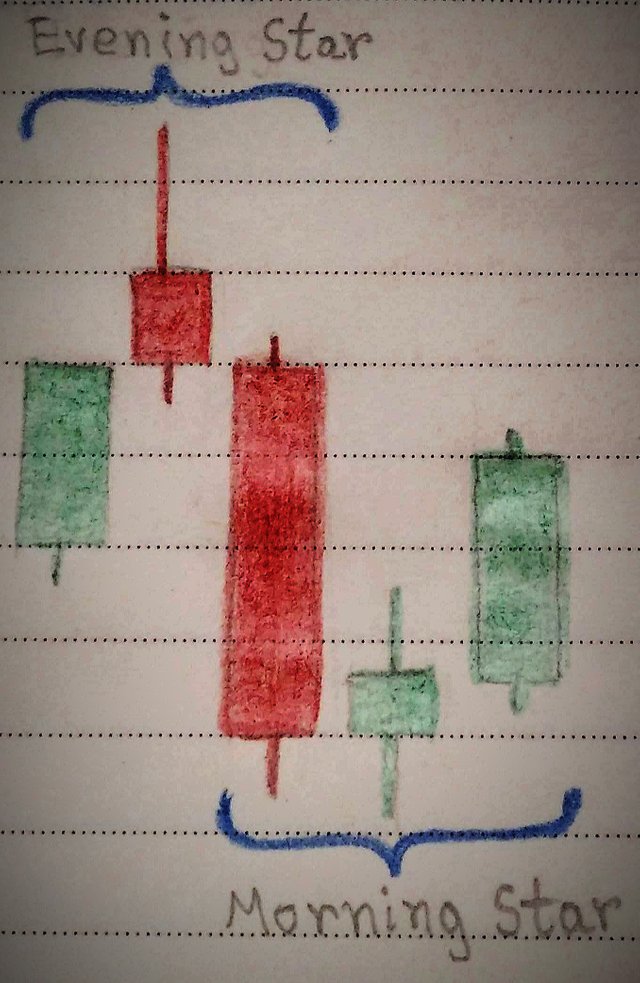
🕯️Morning and Evening Star pattern
~Morning Star: This is a combination of a tiny Doji and a Engulfing green candle that take place in a strong support just after the successive stages of downtrending. Over here means there will be an obvious reversal of bullish because sellers were driving the market but then got tired and now it's the turn of buyers to take control.
~Evening Star: This is a combination of a tiny Doji and a Engulfing red candle that take place in a strong resistance just after the successive stages of uptrending. Over here means there will be an obvious reversal of bearish because buyers were driving the market but then got tired and now it's the turn of sellers to take control.
Identification of patterns on a chart
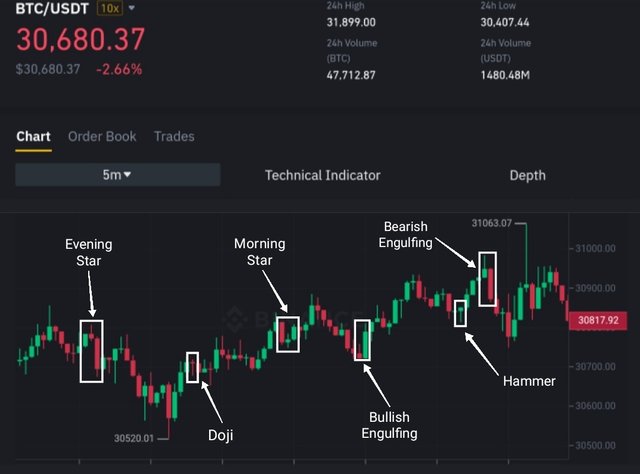
For the example of the following image I'm showing from the BTC-USDT crypto pair of Binance platform, I'll be explaining what happened with the price in every pattern.
~Bullish Engulfing: Despite there was previously at least seven red candles that were formed in a downtrending movement, when the last one got as a long green candle that covered the body of its neighbor, the price went up after this evident reversal pattern.
~Bearish Engulfing: Despite there was previously at least five green candles that were formed in an uptrending movement, when the last one got as a long red candle that covered the body of its neighbor, the price went down after this evident reversal pattern.
~Morning Star: We can see this pattern as the peak of a reversal movement that took place just after the formation of these three candles (red one, small Doji and Bullish Engulfing), where it was in a downtrend way but then switched to uptrend.
~Evening Star: We can see this pattern as the peak of a reversal movement that took place just after the formation of these three candles (green one, small Doji and Bearish Engulfing), where it was in an uptrend way but then switched to downtrend.
~Doji: Behaving almost as a Dragonfly pattern but let's consider it as a Long-Legged Doji, at least there was a little change of price direction, going now down after the creation of this candle where it had a previous uptrending movement.
~Hammer: It's serving as support there due to the reaction of price that were in downtrending and now is currently presenting an uptrending movement thanks to the quick action of buyers that created the tail of this hammer.
Trading strategy using one of these patterns
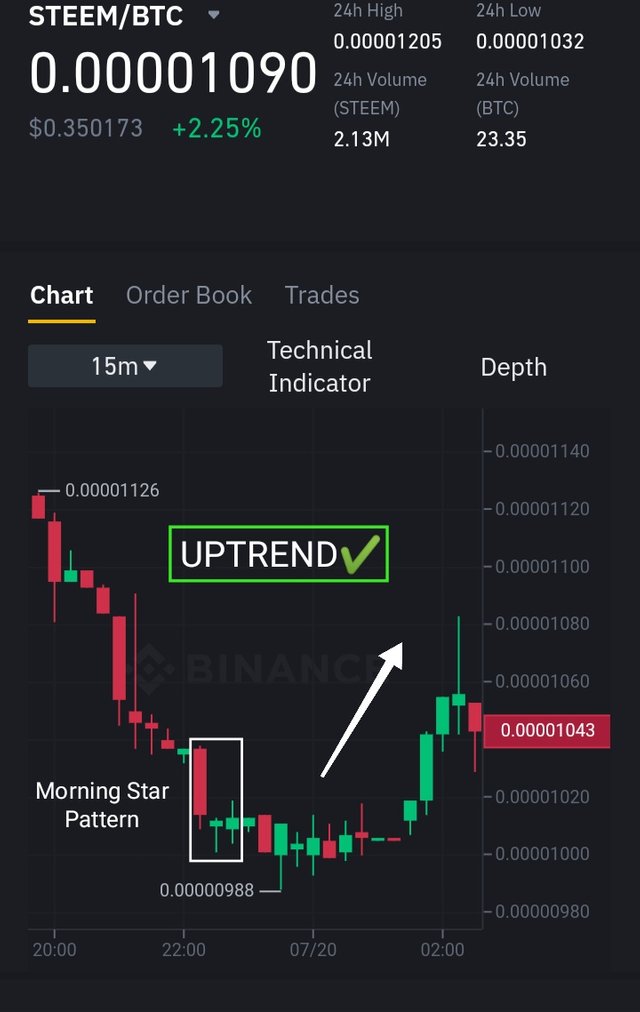
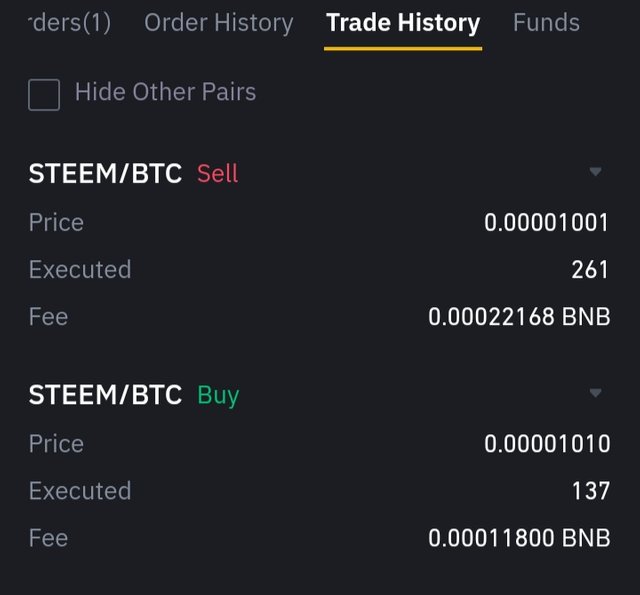
Located once again at the Binance platform with the 15 minutes frame of STEEM-BTC pair, I've noticed the creation of a little Doji plus a bullish green candle that engulfed the mentioned Doji (Morning Star) after a successive red candles, so I've decided to place a buy order of 0.00001010 with a 1:2 Risk Reward (RR) based on the lowest price in that moment of 0.00001001 as Stop Loss and 0.00001030 as Profit.
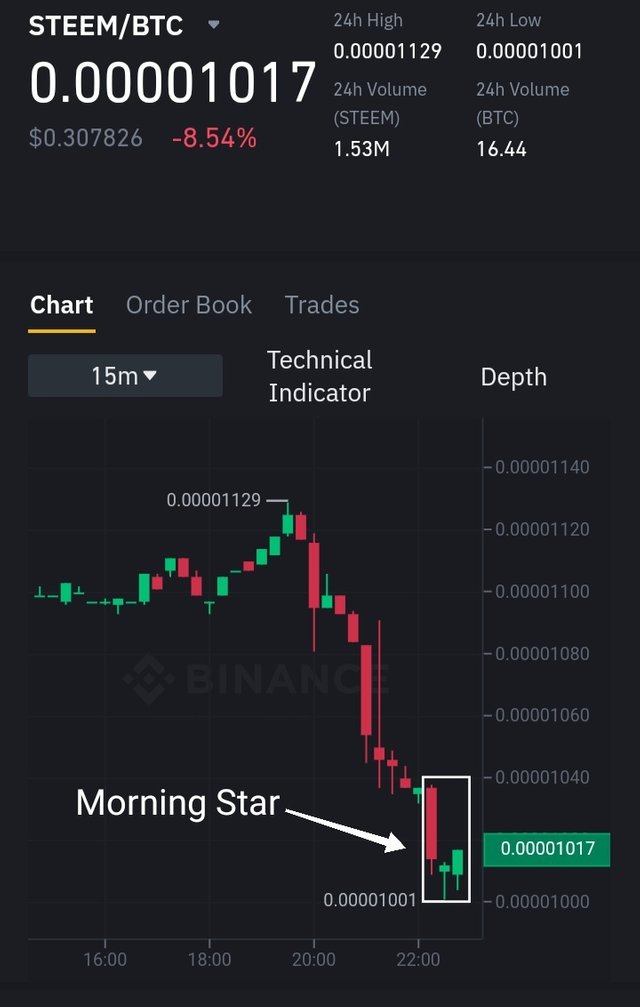
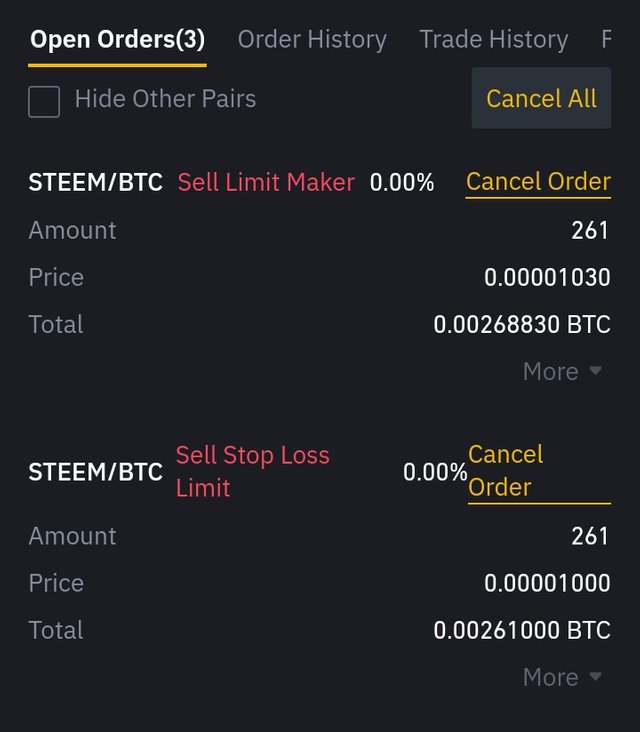
Unfortunately, the price went down to 0.00000988 and the Stop Loss was executed, although later this was resulted in a uptrending movement, so I had to stablish a Stop a bit further than 0.00001000. Next time I'll be taking that in count but this is a great experience about not always we can predict the price behavior.
Conclusion
For sure, this is the Important first knowledge that traders must grab at their initial journey in order to analyze correctly the market and take the best decision to take profits in the long or short positions, because they can predict a reversal of the price for the most of cases.
👷🏻♀️>>~•Alegn@•~>🎶
*** See you in next post *** 📝
Sort: Trending
Loading...