Crypto Academy / Season 3 / Week 1 - Homework Post for @kouba01
1- What is the Ichimoku Kinko Hyo indicator? What are the different lines that make it up? (screenshots required).
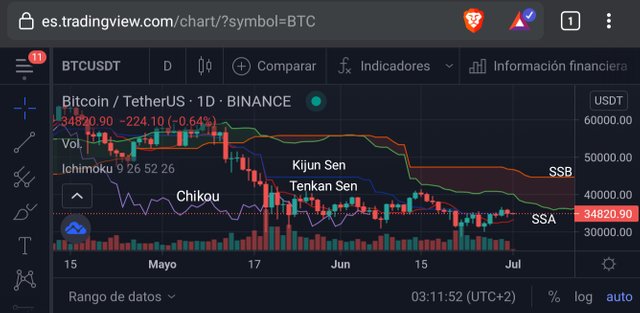
The Ichimoku Kinko Hyo indicator, created before the Second Worldwide War by a Japanese journalist, is a powerful tool that traders can apply in their trading strategy, although it's a bit complicated at the first sight for any newbie that try to understand it in a initial contact, but it is based in an average tendency of short and long term (conversion and base), plus an included last pattern (lagged) and another pair of projected lines (cloud) that will be framing in a whole stage if we ensamble everything to analyze the group of lines that are related between them by some way. Let's see the components.
| Line | Equation | Function |
|---|---|---|
| Tenkan Sen | Highest + Lowest of last 9 periods / 2 | Known as the conversion line, it points out the possible reverse of trend in a shorter term, moreover of supports/resistances. |
| Kijun Sen | Highest + Lowest of last 26 periods / 2 | As a base line, it's also useful to predict trending but in a wider time, plus supports and resistances. |
| Senkou Span A (SSA) | Tenkan + Kijun / 2, projected 26 periods ahead | Get the most relevant supports and resistances too and it works with the SSB. |
| Senkou Span B (SSB) | Highest + Lowest of last 52 periods / 2, projected 26 periods ahead | It is like the SSA, but it's calculated by a higher period and it creates a cloud called Kumo with this mentioned line. |
| Chikou Span | Lagged price line of last 26 periods | It's like a reflection of price's behavior and can give signals of future trending and possible supports/resistances. |
2- How to add the Ichimoku indicator to the chart? What are its default settings? And should it be changed or not?(screenshots required).
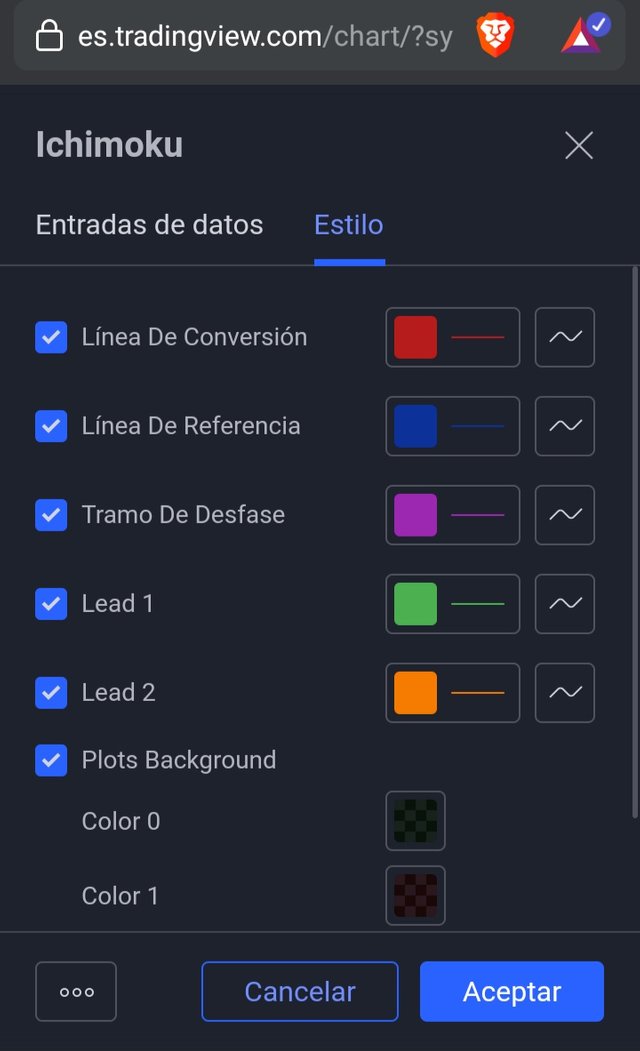
Located at the Trading View website and after searching for the BTC/USDT pair (Binance), we'll be making click over the indicator option to look for the Ichimoku cloud.

Once we display the configuration tool, we can set the desired colours to identify the different 5 lines and analyze them with no confusion. As Tenkan Sen line is based on a shorter time, I will relate it with red, like the hotter one 🔴 Kijun Sen line in blue as something colder because its wider time 🔵 Senkou Span A (SSA) in green due to the signal of favorable uptrending market🉑 if it's located over the Senkou Span B (SSB)... orange one 🉐 and finally Chikou Span on purple to see it easily with love as one of my favorite colors.💜
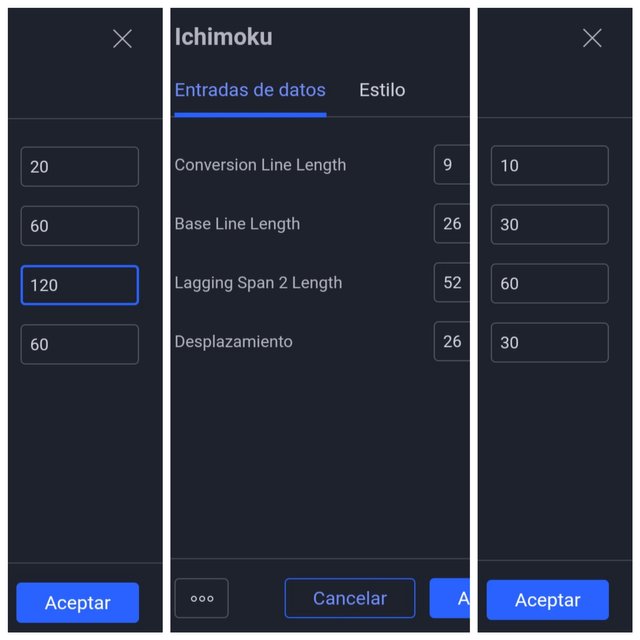
The default options are based on a Japanese market journey (that is 26 days that a month should have without taking in count Saturdays; 52 is the double of 26 and 9 have something to do with a week and half), but once I feel more comfortable and experienced with its use, I might choose 10/30/60 or 30/60/120 to work better with a decimal system that is mostly used in European markets. But in general words, it should be changed according to the customized necessities in order to assure a great efficiency.
3- How to use the Tenkan Sen line? How to use the Kijun Sen line? And How to use them simultaneously? (screenshots required).
Okay, let's read carefully the following paragraphs:
🇯🇵Because it's calculated by 9 periods of time, the Tenkan Sen line, against the 26 ones of Kijun Sen line, the first one is more useful to predict the trending for a shorter period than the another one.
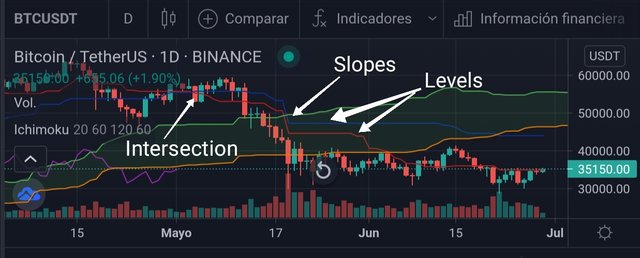
🇯🇵Tenkan Sen will tell me if I'll get a quick uptrend by seeing a sharp slope, or for the contrary, a slow one if I see an obtuse angle. For horizontal lines I can deduct relevant supports or resistances, moreover of no immediate decisions from traders, so price will tend to be equilibrated.
🇯🇵In Kijun Sen, I will be expecting for longer up/down trends, depending of the direction of price and paying attention to the slopes too, like we can do with Tenkan Sen line.
🇯🇵Besides, when price is below of Kijun Sen, we can expect a long downtrend. Deduct the other scene if price is above of this line. With Tenkan Sen, you can buy if price is above and sell if it is below, in a short term for both cases of course.
🇯🇵Simultaneously, we can use them when they cross each other, which will indicate me the change of the price's direction: if Tenkan breaks Kijun from above, for sure we'll obtain an uptrending market, expecting the opposite behavior if it does from below.
4- What is the Chikou Span line? And how to use it? And why is it often neglected? (screenshots required).
Better known as the lagging line, like a photography of past in the chart, not always is taken in count by most traders, maybe due to its isolated nature (remember Tenkan and Kijun Sen, plus SSA and SSB they work each other together). But the use might provide an excellent information to confirm the future and current tendency of last candle by comparing it with the one of last 26 periods: when we make a vertical and horizontal projection of the Chikou's ending point that will reach both candles, if the closing price of the last one is higher than the closing of 26th by counting back, we can be highly sure for a future uptrend, with a possible downtrend if instead of this, current closing price it's located lower than the 26th candle.
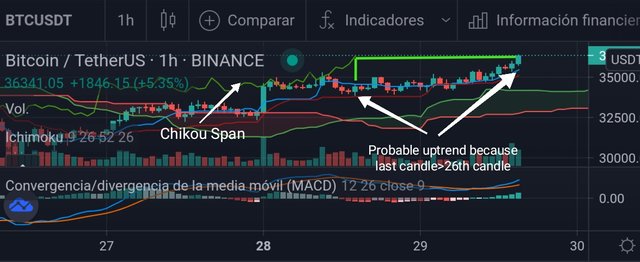
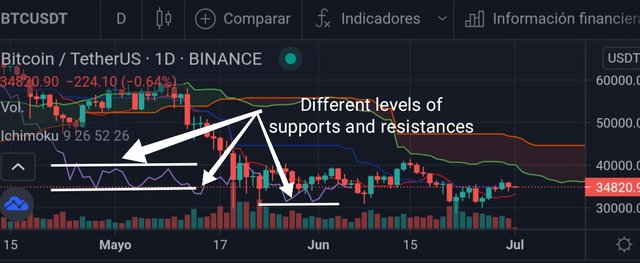
Due the fact of Chikou Span that is calculated by the closing price of the last 26 stages, it's also used to find supports and resistances if we match the higher number of peaks with a projected horizontal lines.
5- What's the best time frame to use Ichimoku? And what is the best indicator to use with it? (screenshots required).
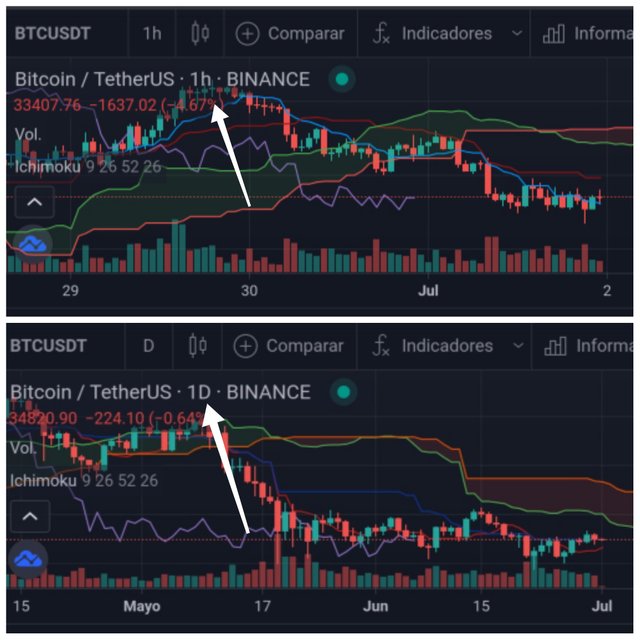
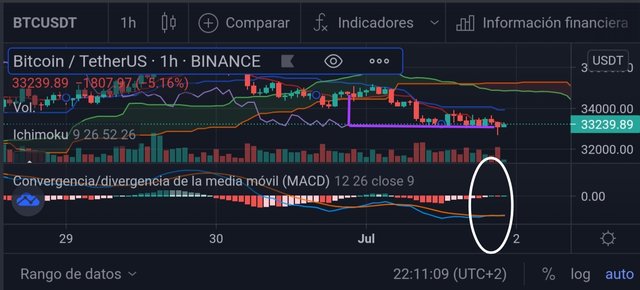
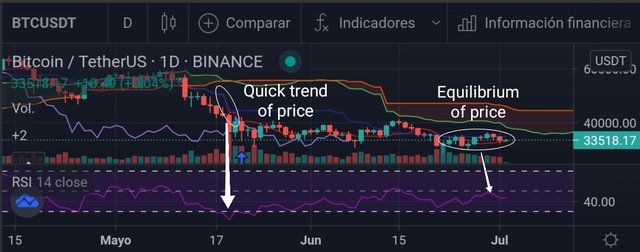
It's advisable to work with candles based on days or weeks to have wider data and enough info to analyze better and avoid unnecessary mistakes during the use of this indicator. A time frame of one day is excellent because this indicator was originally based on the calculation of closing prices from business days. Depending of the trader's goals, he can set the different frames with shorter time. Let's look how indicator changes a lot with 1 hour versus 1 day.
Not always it's possible to get enough signals/information and definitely confirm what's going on indeed, so Ichimoku works better with the Relative Strength Index (RSI) or the Moving Average Convergence Divergence (MACD) to have a clearer scenario, but it's needed to just add one of them, because the easiness of getting a total confusion of too many lines over the chart.
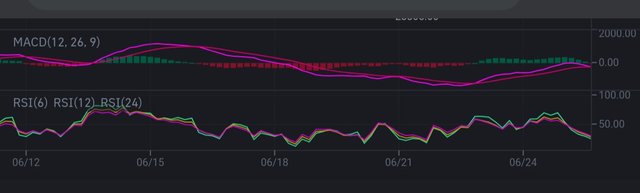
For the case of MACD for instance, this one will add an extra information about the direction once we confirm the change in the histogram by seeing the bars having the maximum peak and then the decreasing towards the zero line, although the MACD line is crossing below of signal line (a possibility of selling), so maybe we'll have a bullish divergence. And with the projection of Chikou Span to obtain a closing price of last candle being lower than the one of earlier 26th, this is telling me an obvious downtrending that provides a vision for a good point to open a short position. Without mentioning the fact of price still standing below of the conversion and base lines... a clear signal of falling trend yet.
If we use the RSI factor, we can note the coincidence of an important slope with oversold peak of the oscillator + the equilibrium stage at the current trend of price, deducted by the Tenkan and Kijun Sen lines being breaked by the candles and seeing at the same time the closer trending of the oscillator towards its center part.
6- Conclusion
Sincerely, It's the first time I've ever heard about this indicator, but I've decided to find more details because I really wanted to learn how to apply it in my trading strategies from now on, although it took me many days to completely understand the Ichimoku Kinko Hyo indicator as a powerful tool of a whole vision in first sight.
Among all the charts I've seen with the indicator, I've noticed the price separately from Tenkan and Kijun Sen by stages, then get stick to the cloud also (or Kumo integrated by SSA & SSB), indicating a consolidated stage of it... Of course Hosoda Goichi knew about the emotions and equilibrium that humans might have time to time. Chikou line is also having an important role to set possible levels and figure out the future trending.
It works better with RSI indicator to measure the impulse in the market, or with the MACD one to see which will be the next price direction, plus with wider time frames like days or weeks to obtain a huge vision of market situation.
C.C: @kouba01
👷🏻♀️>>~•Alegn@•~>🎶
*** See you in next post *** 📝
Hello @alegnita,
Thank you for participating in the 1st Week Crypto Course in its third season and for your efforts to complete the suggested tasks, you deserve a 6.5/10 rating, according to the following scale:
My review :
A work of acceptable content in which the topic has been covered in all its aspects by answers varying in depth of analysis and interpretation. I will give you some notes:
Thanks again for your effort, and we look forward to reading your next work.
Sincerely,@kouba01
Thank you here professor. I really liked this indicator and I'll be seeking for video explanation in order to see better how to use it. Definitely, I need more practice to obtain enough info and see clearly signal with no doubt and confusion. #venezuela #affable