Understanding Trends-Crypto Academy / S5W1- Homework Post for @reminiscence01 // @aldrich10

INTRODUCTION
I am very happy to be able to join the first week 5 of the steemit cryptoacademy to complete Professor @reminiscence01's homework assignment on "understanding trends" and I hope that I can complete this extraordinary task perfectly.
As we all know that market trends are needed by everyone to carry out their activities throughout trading, be it in the crypto market or other markets.
1) a) What do you understand by a Trending market?
A trend is a directional price movement on an up or down chart. But there are also many traders who think that prices can only go up, or can only go down, but this is not the case at all, most prices on the chart usually move in a narrow price range.
When entering a market trend we need to know what trends are in the market, there are three market trends, bearish, bullish and sideways. Each trend requires a special action from the trader. The right decision will help you make a lot of money. Wrong actions, on the other hand, will bring harm. However, before making money on trends, market participants need to learn how to properly identify trends.
Working with trend lines, a trader faces two challenges:
- Determine the trend (directed price movement) by plotting the trend line or channel on the chart. You can also use the special trend indicators located in the Metatrader trading terminal.
- Determine trend strength using graphical analysis and graphic patterns. You can also use custom indicators for volume and oscillators.
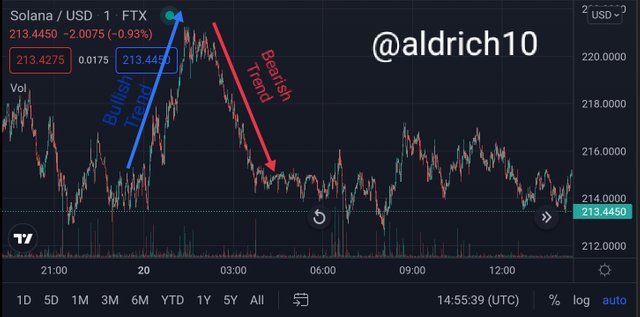
b) What is a bullish and a bearish trend? (screenshot required)
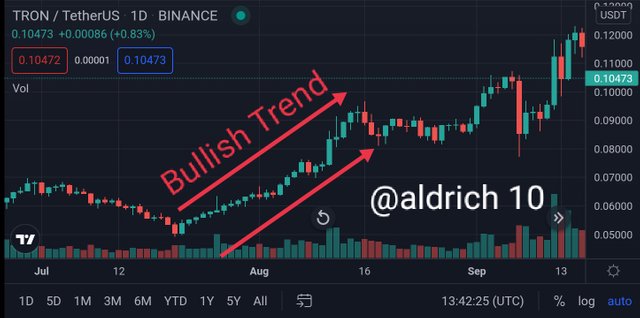
- BULLISH TREND
A bullish trend is a price movement where the price is at the next low higher than the previous one and each subsequent rise is also higher than the previous one in the market. The up trend is plotted for the minimum market price value on the bottom chart. This bottom is an important support level. So, the uptrend is a support line.
source
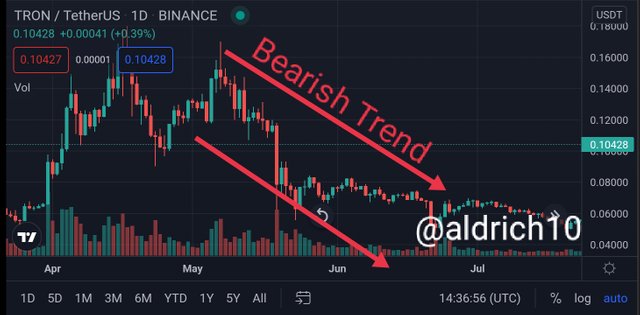
- BEARISH TREND
A bearish trend is a price movement where each subsequent bottom is lower than the previous one and each subsequent top is also lower than the previous one. The downtrend is plotted based on the maximum price value on the chart (top). This peak is an important resistance level. Thus, the downtrend is a line of resistance.
2) Explain the following trend identification and give an example of each of them. (Original screenshot needed from your chart). Do this for a bullish and a bearish trend.
i) Market Structure.
*ii) Trendlines
i) Market Structure.
Market structure gives you dialogue while reading the market. When you follow the market structure, you can easily determine the market flow and place trades based on the direction of the trend. The market structure is formed and gives you an idea of when the market stops and starts a directional trend.
Reading the market structure gives you an idea in which direction the price will move and you can trade with the trend.
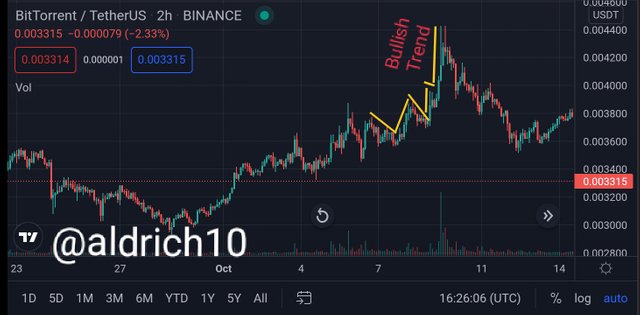
- Bullish structure
A bullish market structure is a price movement from the next low moving higher than the previous one and each subsequent peak also higher than the previous one. The uptrend is plotted based on the minimum price value on the chart (bottom). This bottom is an important support level. So, the uptrend is a support line.
source
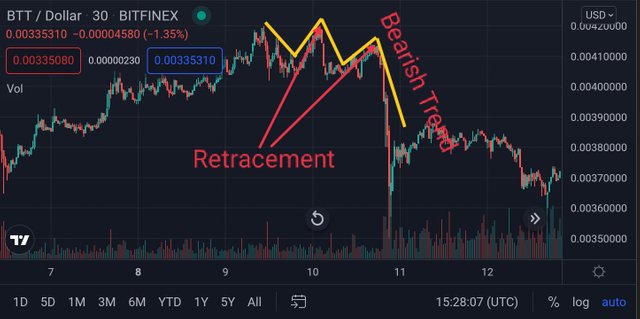
- Bearish structure
The market structure is a bearish trend when there is a price movement where each subsequent bottom is lower than the previous one and each subsequent top is also lower than the previous one. The downtrend is plotted based on the maximum price value on the chart (above). This peak is an important resistance level. Thus, the downtrend is a line of resistance.
source
ii) Trendlines
The trend line is a tool used to show the market is going up or down so that this trend line can be categorized into two parts, the trend is bullish or the trend is bearish.
If the trend is rising, the line goes to the highest point above the previous trend, as well as the Bearish trend, the line shows to the lowest line from the previous one.
For more details, we can see as shown in the following graph :
3) Explain trend continuation and how to spot them using market structure and trendlines. (Screenshot needed). Do this for both bullish and bearish trends.
Talking about the structure of the crypto asset market, the continuation of the trend of market prices occurs due to the constant fluctuations in the price of the crypto market, this price fluctuation is caused by traders who issue their assets taking advantage of their trades, maybe they buy other assets at a time when the price is at the same time. crypto assets down.
There are two important things to note in a Bullish trend and a Bearish trend.
1.In a Bullish trend, the new high price must be higher than the previous price.
2.And the new down price must be lower than the previous price.
Then in the Bearish trend two factors must also be considered1.The price of the new high trend must be lower than the price of the previous high trend.
2.The new low price must be lower than the previous low.
The question above can be concluded that the resistance continues to be tested in the Bullish trend and the Bearish trend, this statement can be seen in the following crypto chart:Bullish trend
source
- Bearish trend
source
4) Pick up any crypto-asset chart and answer the following questions -
i) Is the market trending?
ii) What is the current market trend? (Use the chart to back up your answers)
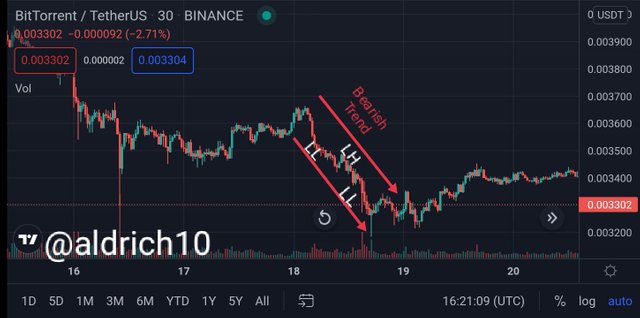
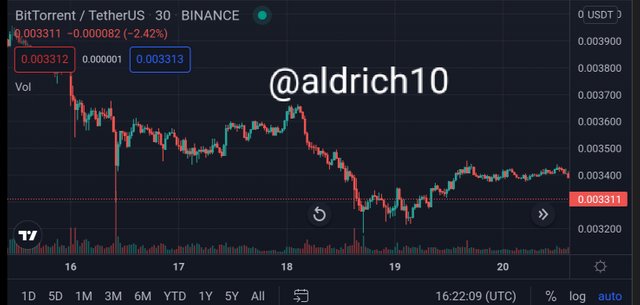
i).Is the market trending?
I chose the BTTUSDT crypto pair after I observed the zigzag resistance and support there was no Bullish trend and Bearish trend so I concluded on the BTTUSD chart chart there was no trend in the cryptocurrency I chose.
ii).What is the current market trend? (Use the chart to support your answer).
After I explained above that the current trend is not happening even so it is possible that the market will change quickly if traders withdraw their assets to sell or buy other assets that are still trending Bullish.
This is the BTTUSDT gfafik chart I am using.
source
Conclusion
In the cryptocurrency market understanding trends is a very important aspect because any investment that does not follow the trend can be guaranteed to experience a very large loss. So that is why we who want to invest in the crypto market following market trends are an obligation, both it's a bullish trend or a bearish trend so we can be successful.
Hello @aldrich10, I’m glad you participated in the 1st week Season 5 of the Beginner’s class at the Steemit Crypto Academy. Your grades in this task are as follows:
Observations:
This is correct. In a bearish trend, there are lower lows and lower highs.
Recommendation / Feedback:
Thank you for submitting your homework task.