[Trading Using Wedge Pattern] - Crypto Academy / S5W5 - Homework Post for @sachin08


The wedge pattern is usually referred to as a reversal pattern, it forms at the highs and lows of the price chart during a downtrend or uptrend. Visually, the Wedge is very similar to a Triangle, it also forms between two converging support and resistance lines.
The main difference between Wedge and Triangle is the slope of the two forming lines and the figure itself in one direction, either up or down. According to the direction of the forming lines, Wedge patterns are conventionally divided into two types - ascending and descending.
Wedge can indicate further development of the situation. For example, an upward wedge pattern indicates that a decline will follow, while a downtrend, on the contrary, warns of the start of an uptrend. Where when the market is forming on the chart, the price configuration in the form of a conical high and low converging in a narrow zone is called a wedge.
For the stock market, wedges are generally considered for longer timeframes, so it is better to consider hourly and longer timeframes.
The main technical conditions for wedge formation are as follows:
The previous trend must be broken. In an uptrend, each low must be higher than the previous one.
The resistance or support line that the price broke when the wedge formed must be drawn at least two highs in a bear market or lows in a bull market. Ideally, there should be three touches of price on one of these lines.
A sloping support line in a bear market must include at least two touches, so a resistance line in a bull market is also drawn at two lows.
Wedge is formed due to the narrowing of the price range.
- Rising Wedge
Technical crypto traders love the rising wedge pattern because of its simple rules of entry and exit as the price moves. The rising wedge helps traders predict upcoming peaks and price reversals.
The rising wedge is visible at all time intervals on the chart, but grows rapidly, which makes it difficult to detect in real time. We'll tell you what this pattern looks like and how to use it to identify sell signals and make a profit.
The rising wedge pattern is formed when the price increase slows down and a narrowing pattern forms. The price can no longer go up any further, but at the same time, they seem to continue to gradually update the local maximum. This indicates that bears pressure is gradually increasing in the market.
A rising wedge can be interpreted as a bearish wedge because a low price follows a high with a steeper downtrend line. The only difference between a falling wedge and a rising wedge is the slope of the triangle and the situation the pattern represents.
An ascending wedge, where trading volume decreases as it progresses, signals a future decline in price or a break into a downtrend. A decrease in trading volume may indicate that sellers are preparing for a bearish breakout despite a price increase.
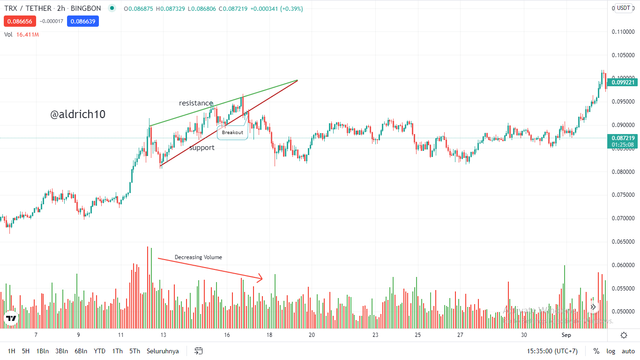
Notice in the image above, how a rising wedge forms as the market starts making higher highs and higher lows. All highs must be in line for a trend line to connect them. The same goes for the lows. It cannot be considered a valid ascending wedge if the highs and lows do not align.
Since the two planes are not parallel, it is considered a terminal pattern. This implies that it has to end at some point.
The shape of the rising wedges is as follows:
The rising wedge is like a slice of pizza, formed when two trend lines meet. An ascending wedge carves out a series of higher highs and higher lows.
The resistance trend line must reach the pattern's highs. A true resistance line requires at least two higher highs.
Draw a trend support line stretching from higher lows as shown. You will need at least two local minimum points to draw it.
After drawing resistance and support trend lines, you will see a wedge-like triangle. It is very important that the apex of this triangle is pointed upwards. Thus, the resistance line at the rising wedge should be directed upwards.
- Falling Wedge
A falling wedge is the opposite of an rising wedge, where the bears are in control, making lower highs and lower lows. Formed by two converging and downward sloping lines of support and resistance. If a downward wedge forms at the lows of the price chart during a downtrend, it signals a possible correction or even a reversal. If the upper border of the resistance line pattern is broken, it is recommended to buy, Stop for the nearest minimum. If a downtrend wedge forms during an uptrend after the next update of the highs, it can be considered a signal of a possible continuation of the uptrend.
A falling wedge pattern forms when the price drops slowly and a tapering pattern forms, and the volume readings gradually decrease. The price is no longer able to drop any further, but at the same time, they seem to keep updating the local minimum gradually. This indicates that buyer pressure bulls is gradually increasing in the market.
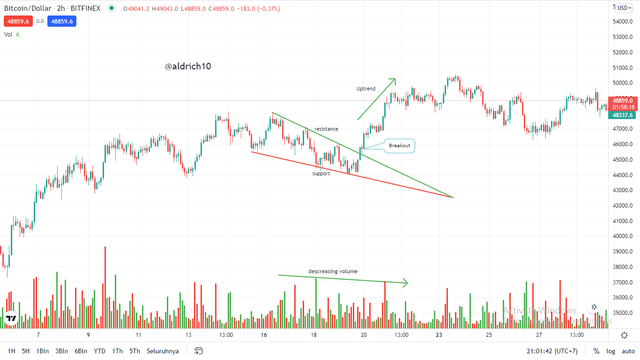
In the image above, we had a period of consolidation where the bears were clearly in control. We know this is true because the market makes lower highs and lower lows.
Notice that all the highs are aligned, just like the lows are aligned. If a trend line cannot be laid neatly across the ups and downs of the pattern, it cannot be considered valid.
As for the falling wedge shape element
The shaping, maturation and finishing of the figure consists of several key elements:
The previous trend is usually a downtrend; it is necessary to open something but not always, see above.
The line of resistance is formed by two or better - three points of contact, each touch point must be lower than the previous one.
The support line from below must also reflect at least 2 touch points, each of which must be lower than the previous one.
The narrowing of the angle formed by the support and resistance lines means the formation of the correct pattern.
If the price crosses one of the resistance or support lines, it means the completion of the pattern, it is important to note that the side from which the price crosses the pattern determines the further price movement
Trading volume is very important in falling slices, at the end of the pattern, at intersections, The trading volume must necessarily increase, otherwise the pattern will not be considered reliable
An important point for technical analysts is the timely detection of a falling wedge on the chart; it can be easily confused with other similar shapes. Always wait until the end of the pattern to check the direction of price movement and trading volume.
In my opinion yes that the breakout of the Wedge pattern sometimes produces false signals. In general there are almost no tools to detect fake signals 100%. However we can use indicators to detect false signals.
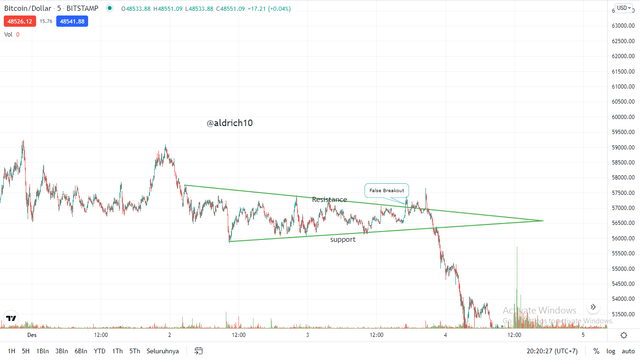
Let's look at the picture above, where the price in the market has touched the resistance line and the support line several times, it means the Wedge pattern has been formed. We can see on the chart that the price broke the resistance line, maybe traders have determined a breakout point and then entered a buy entry, predicting that the next trend will be bullish but they don't know that this is a false signal and the price will be bearish.
As for avoiding false signals in the market, we can use indicators as a tool to predict the trend that will occur next.
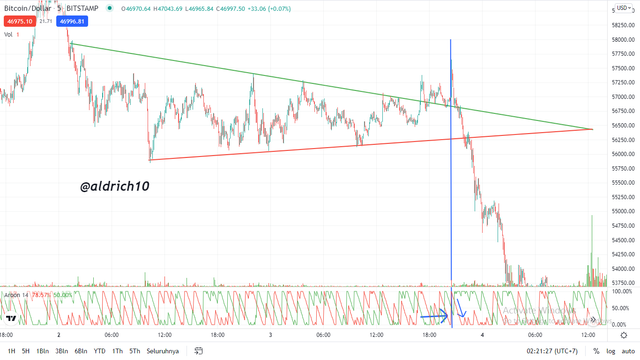
The picture above shows that the Wedge pattern gives a false breakout signal, where when the price breaks the resistance line and has determined a buy entry point but the price becomes bearish, using the indicator can detect this, I'm here using the Aroon indicator. We can see on the indicator that there will be a bearish trend for the next trend. if indeed this still makes us doubt, we can use several indicators at once in order to get more accurate and maximum results.
- Trading Setup using the Rising Wedge Pattern
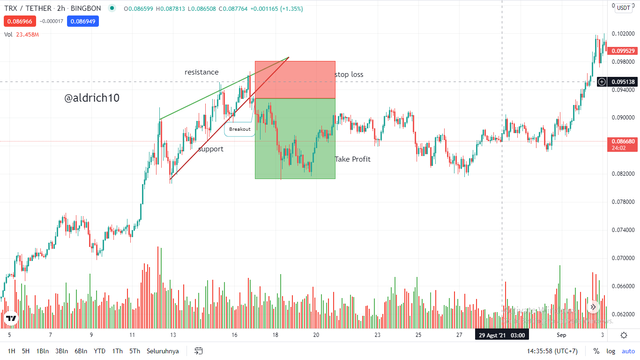
We can see above, in managing trades using the Rising Wedge pattern. In the chart we see that the price in the market several times touched the resistance line and the support line in the form of a slope and I can conclude that this is the rising wedge. So that after the breakout we can set a stop loss order right at the resistance line or slightly above it and set a take profit order below the support line.
- Trading Setup using the Falling Wedge Pattern
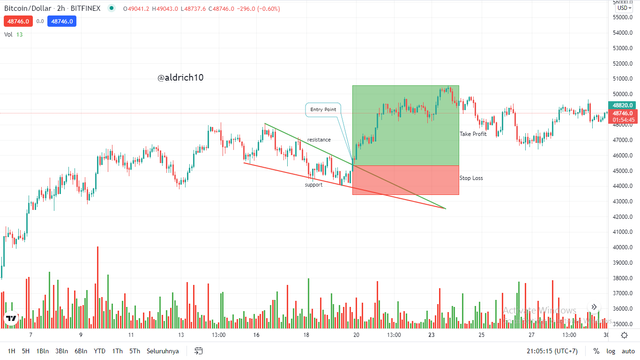
In the picture above, we can see how the falling wedge is formed when the price is in a bearish phase, the price has touched the resistance and support lines several times, after the price has broken through the resistance line and when the price starts to break through the resistance line, we can start to enter the trade. Where we can place a stop loss on the support line and while for take profit we place it on the resistance line.
The Wedge technical analysis pattern is quite common on charts and can help to properly assess the prospects for further price movement. The probability of these patterns succeeding is, in my opinion, quite high, that they deserve to be included in your trader's arsenal. You just need to practice to learn how to find patterns on price charts and take into account all the nuances that accompany the current trend, the ratio of Stop Loss and Take Profit, fundamental factors.