Steemit Crypto Academy Season 3 Week 2 - Beginner's Course // Homework Post For @reminiscence01 // Introduction to Charts by @alauddinpabel
Hello, Dear Steeminers friends,
Welcome to the Steemit Crypto Academy. Excellent week for everyone, my name is @alauddinpabel and I am from Bangladesh, In fact, each of us should have a better understanding of what is this. I think it's an honor for me. Each of us should have a clear idea about the things that we are actually working on at Crypto Academy, such as today's Charts & candlestick Charts. Thanks to professor @ reminiscence01 for this great lecture and for the following assignment.
Chart
Chat is about presenting and revealing real information about various topics such as symbols, lines, graphs, images, pictures, and topics of interest products are used for price movement and display of information for easy comprehension and readability to collect information over time and based on these foundations, technical analysis was developed. There are different types of chats in the finance trading price movement that evolve from different ideas of how prices should be presented but they all show price movements in a certain direction and time. These charts show the direction of price fluctuations in a given period of time.
Candlestick Chart
Candlestick is a very effective chart of the four cryptocurrency trades. A candlestick chart is a form of being guided by the actual movement of the price of an asset at a given time or representing the price of an asset. An overall approach refers to traders who record significant price points and give advance indications about future price movements. Basically, it expresses the feeling of the market that the buyer-seller has control over which aspect in a given period of time. However, it is often used with other technological tools to determine future price movements and this is why traders help this candlestick to make any decision of their business so this is why this Japanese candlestick is one of the most used candlesticks.
Question 1: Explain the Japanese Candlestick Chart? (Chart screenshot required)
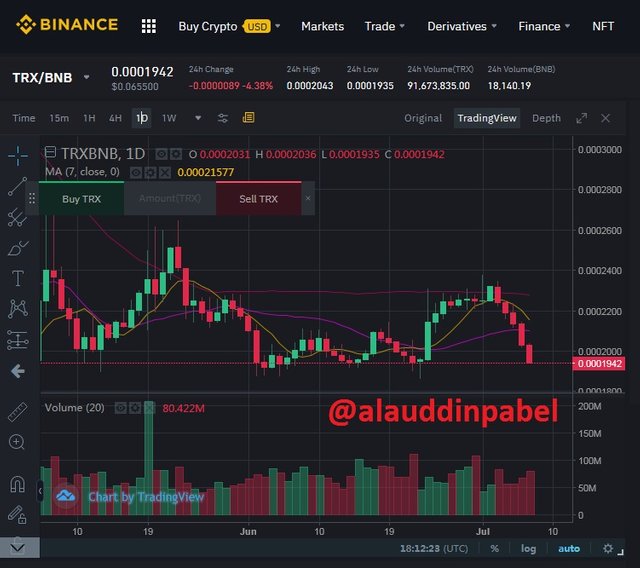
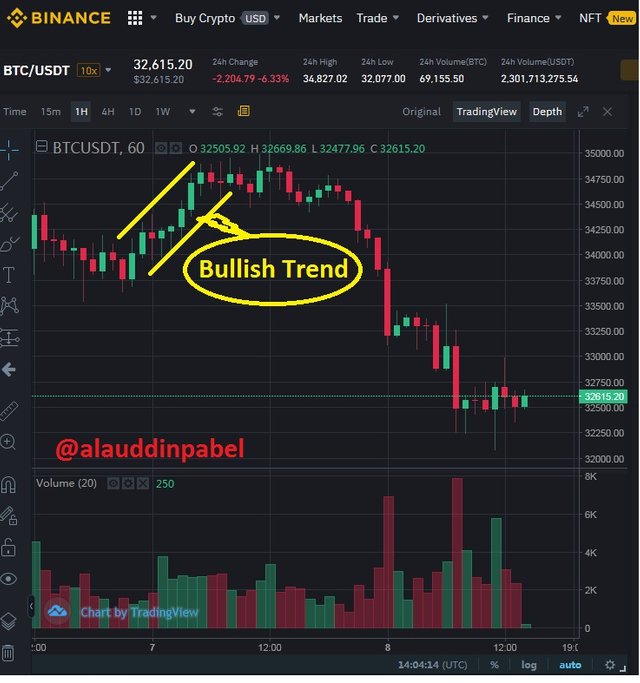
The Japanese Candlestick Chart:
Munihisa Homma, an ancient rice trader in Japan in the 17th century, was the first to supply this candlestick to Japan to study the price rotation of his understanding of supply and demand. And he was determined to do it and he was successful in how the market reacted to it and laid the foundation of the candlestick. The reason why this Japanese candlestick is widely used is because of the way it represents price movement. It tries to portray an interaction between buyer and seller in the market and shows the value at different points during this interaction. A Japanese candlestick represents a certain point in the movement of each price through only four parts of the candlestick such as open, high, close, and down.
The Japanese candlestick represents the price movement with its four parts, we will now discuss a little bit about those parts.
Open: This indicates that the price movement has been recorded over a period of time and indicates the onset of price movement.
High: This section indicates the maximum price recorded in the candlestick's time period.
Low: This part indicates the lowest price a candlestick can record in a given period of time.
Close: This part indicates the last value of the candlestick to be recorded and it marks the end of the candlestick within a specified time.
Moreover, the other parts of the candlestick are the shadow and the real body. The shadow no longer depicts the volatile movement of any property price and the original of a candlestick is the real house which indicates the distance covered by the price in a given period of time and it is a place between the opening price and the last price but it also indicates the candlestick speed. The real body of these candlesticks undergoes two different color changes for easy identification. By changing these colors traders can set up their charts based on their specifications and trading system.
A positive price movement is indicated by the body with the green candle while a negative price movement is indicated by the body with the red candle. Traders can choose their favorite colors to refer to bullish or bearish swings on modern trading platforms.
Whether a candlestick is completely bullish or bearish depends on the closing price of its property. In this case, the actual body is usually green with the candlestick closed more than the opening. The closing price is always at the top and the opening price is at the bottom of the body.
Questions 2: Describe any other two types of charts? (Screenshot required)
Line Chart:
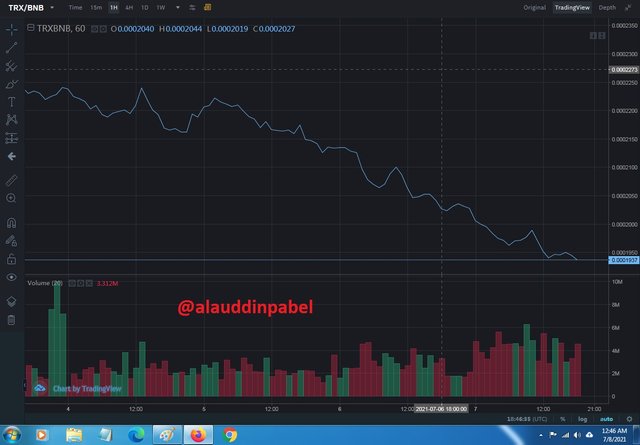
This style of chat is Commonly used to see how cryptocurrency prices have changed over time, as indicated by a line. It consists of a single line that is drawn by adding to the finished names of each day or period. The price lick is made based on the current day near bitcoin price. The line chart uses two types of scales, linear and logarithmic. However, the price scale is divided into equal sections of linear chat. The value of the crypto in logarithmic chaat is measured based on the percentage change.
Therefore the two price changes are different than the absolute value but equal to the percentage that will be represented by the same vertical shift on the logarithmic scale. The chart above shows how the hourly movement was the easiest of the chats but it can be said that it is an incomplete chart, Because it only shows our closing prices, we don't know from here what happened in that hour or that time.
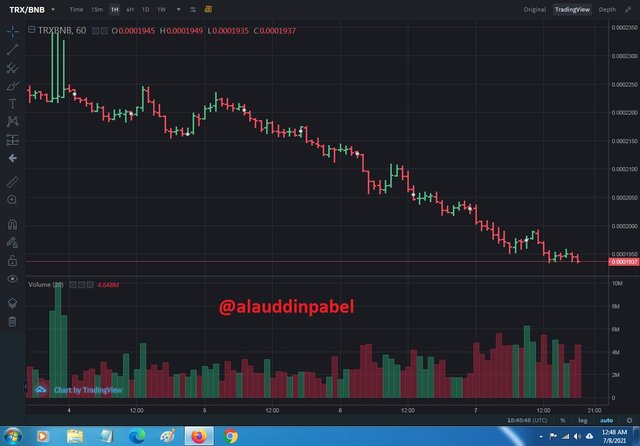
Bar Chart:
It's a bit more complicated than line chatting but it has some of the four quality benefits that we must know. The graphic we can see to take the screenshot above is composed of several bars like the one we see in the capture. These represent one hour in each market, the line from the left represents the starting price, the lowest part of the bar represents the lowest price, the highest part represents the highest price, and the line on the right represents the finished price. The line on the left always points upwards and the line on the right always points off. Whether it is an uptrend or a downtrend.
Question 3: In your own words, explain why the Japanese candlestick chart is mostly used by traders?
In my opinion, the Japanese candlestick chaat is much more used by traders for the following reasons.
Traditional bar licks have little relevance in their own right. But candlestick licks give a lot more information about what happened in the market that day. Pattern analysis can be used to evaluate the probability of equity future movements through pricing over time. Candlestick chart pattern analysis can play an important role in almost any investment strategy with little experience and familiarity.
Every trader can easily determine the current market situation at a glance.
Compared to bar chat, Japan Candlesticks provides more detailed information about price changes where they carry out price action over time as seen in a graphical picture of supply and demand.
Traders can easily tell that through the length of a candlestick's color change they observe that the market price is rising (becoming bullish) and market prices are falling (becoming bearish).
These typically provide significantly more visual information than line charts, opening up the market low and closing all prices at once.\
Question 4: Describe a bullish candle and a bearish candle identifying its anatomy? (Screenshot is required)
Bullish Candlestick:
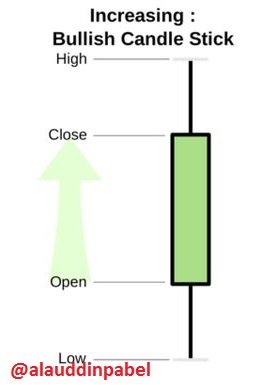
A bullish candlestick acts as a form of raising the price of an asset or product and presenting the price. It fixes the closing price and is characterized by closing on the opening price and indicates that the price may increase over a period of time. If we explain the figure above we see here that the opening price is freely down which shows the price increase of the presented property and shows the record lowest price in a low candle.
Finance trading is known as bullish trading as the continuous formation of such a candlestick represents a steady increase in the price of a property.
Bearish Candlestick:
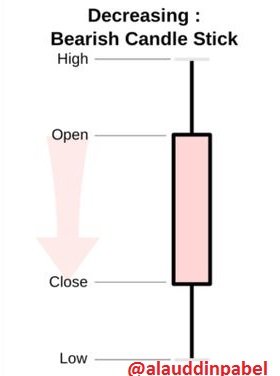
A bearish candlestick represents a price that indicates a decrease in the price of a product or asset and it fixes the closing price by indicating and confirming the closing below the opening price. It indicates a downward move in price and a decline in the value of an asset over a period of time. If we look at the figure above it is seen here that the closing price is below the opening price which indicates a decrease in the price of the property presented. In the same way, the record shows the lowest price in low candles and the highest price recorded in high.
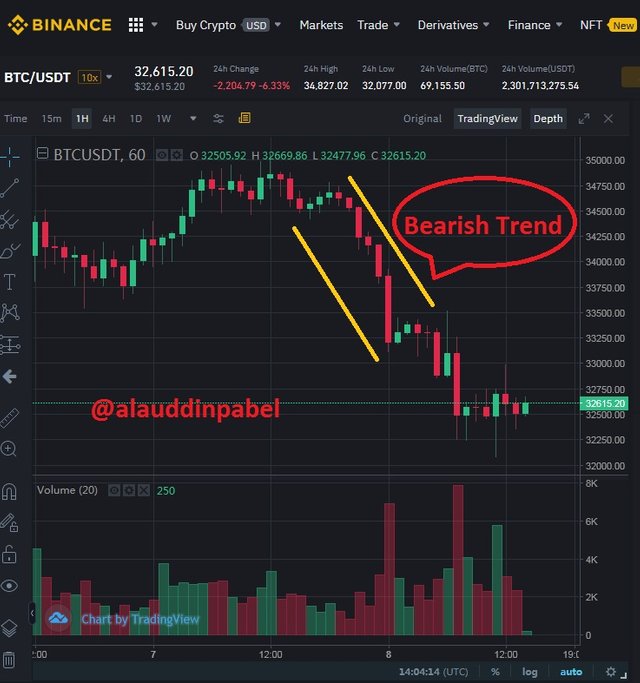
However, the successive sequences of such candlesticks represent an unbroken monarchy in the price of assets, hence such events are known as a bearish trade formation.
Thanks for reading my homework task.
Hello @alauddinpabel , I’m glad you participated in the 2nd week of the Beginner’s class at the Steemit Crypto Academy. Your grades in this task are as follows:
Recommendation / Feedback:
There were a lot of confusions in your explanations. Please always use cryptocurrency and trading terms in your writing for easy understanding of your points.
Thank you for submitting your homework task.
Hi, @alauddinpabel,
Thank you for your contribution to the Steem ecosystem.
Please consider voting for our witness, setting us as a proxy,
or delegate to @ecosynthesizer to earn 100% of the curation rewards!
3000SP | 4000SP | 5000SP | 10000SP | 100000SP