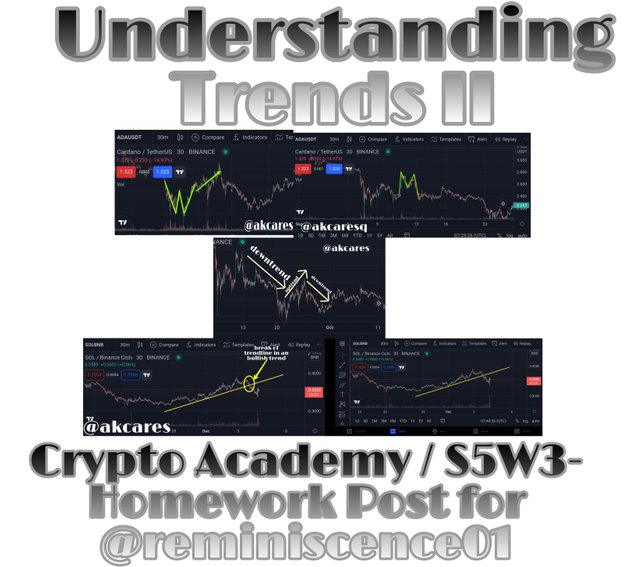
Understanding Trends II - Crypto Academy / S5W3- Homework Post for @reminiscence01
The crytopcurrency market is all about trends. The market generally has to be going up or coming down. Though in some cases, it moves sideways, the dominant situation is for it to trend. Not much success can be attend by a trader if such a person does not first have a significant understanding and knowledge of these trends.
Importantly also, a trader will need to know when a trend is turning on its head. That is, when it is reversing as these hold serious indications about the market situation. With this lesson from Prof. @remininscence01, the concepts of trend reversal have been dissected in very clear terms. My assignment answers are in the coming sections.

Explain your Understanding of Trend Reversal. What is the benefit of identifying reversal patterns in the Market?
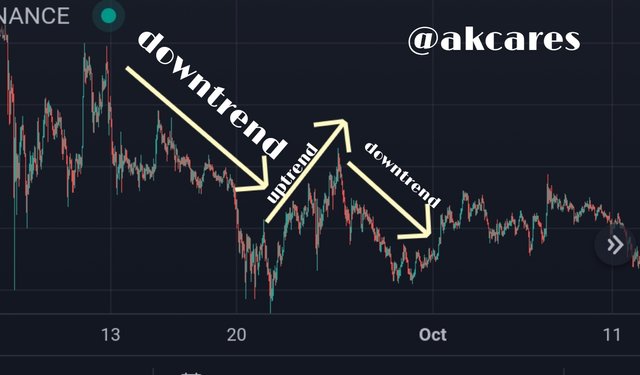
As I stated in the introduction, the crytopcurrency market chart has periods where it moves in an upward direction and other times when it goes in a downward direction. These moves do not continue till infinity. From time to time, a downtrend changes to an uptrend and vice versa. This is what trend reversal is about.
Trend reversal can be defined as the termination of price movement in a particular direction and commencement of the movement in another which is directly opposite the previous one. It is a situation whereby a dominant market orientation ceases and another takes over in an opposite orientation.
For instance, if the market was moving in an uptrend. This means that the price of the asset was increasing with buyers being in control as they are able to keep pushing the price upwards with their high purchasing power. It will get to a point where the buying pressures reduce, the buying power diminishes and the price begins to stall and does not continue to rise.
At this point, seller step into the market, embark on a selling rally and drag the price down such that the price now moves downward. In this situation, it can be said that the initial bullish trend has reversed to a bearish trend.
Benefits of Identifying Reversal Patterns in the Market
Why reversal patterns are being talked about is because they have some important use cases for making successful trading decisions. The trend reversal patterns have some benefits and attractions for traders. Some of these advantages of being able to carefully mark out these patterns are given below.
A trader will have idea of when to exit a trade and close positions once a reversal pattern appears.
These patterns help traders to protect their capital as they do not persist in a market that will eventually go against them.
It increases traders' chances of being successful and profitable. A trader will be able to take profit and win a trade rather than holding a position or opening a new one when there is an impending reversal.
Trade entry and exit points as well as stop loss points are made easier and clearer to locate with trend reversal pattern.
These patterns give indication of where the market will be moving to in terms of direction.
How can a fake reversal signal be avoided in the market? (Screenshot needed).
A fake reversal signal can be avoided in the market by using a combination of technical analysis tools. This could mean applying technical indicators as well as analysing the price action. I will be using the 200 Exponential Moving Average and the ADX indicator to show how I can avoid fake signals in the market.
In the chart, the candlestkicks appear to be moving up at the moment. Though, the size of the candlestkcks are very small especially the bullish candlesticks. This means that there are no real power from the market players and the trading activity does not have much momentum.
Overall, the market has been on a bearish trend. Though for the time being there seem not to be a clear direction. To ensure that I do not enter a bad trade, I used the indicators as confirmation.
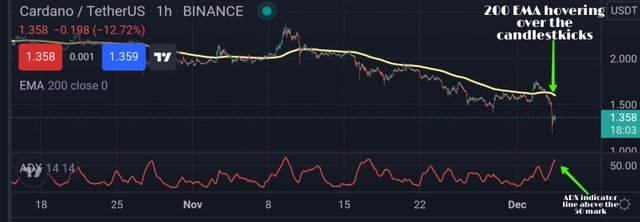
The average directional index which signals how strong a trend is up above the 50 mark line. This means that the trend (bearish trend) is still very strong.
Also, the 200 moving average is placed above the candlestkicks. One of the basic implication is that there are more selling pressures in the market. With these information, I would prefer to hold on taking a trade until I get a clear signal from the price action and the indicators. In this way, I can avoid getting fake signals.
Give a detailed explanation on the following Trend reversal identification and back up your explanation using the original chart. Do this for both bullish and bearish trends (Screenshots required). a) Break of market structure. b) Break of Trendline. c) Divergence d) Double top and Double bottom
- Break of Market Structure
Market structure refer to the shape and repeated pattern than price makes that qualifies the market to be in an uptrend or a downtrend. It simply involves the pattern of movement of the price and the kind of shapes formed. Market structure has to do with the structure and shape made by price charts. It refers to how price has been following formations of high and low points as they are relatively placed to each other.
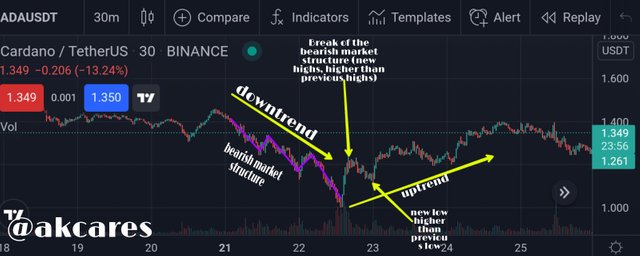
Coming to trend reversal by break of market structure, it entails that the price has failed to loves in the suppose pattern for bullish or bearish market and thus invalidates the structure and signals a termination of the trend.
As market is in a particular trend and it obeying the market structure, a point is reached whereby price does not follow the structure anymore and begin to form a different one from the previous structure. At the point where price is no more sticking to the market structure and goes on a different formation, a break of market structure is said to have occured. This break can be seen in both bearish and bullish market trends.
For a bearish trend, the normal structure is to have lower highs and lower lows. That is, the high point succeeding the previous one is at a lower level below that high and the low point formed after the previous one is at a lower position on the chart.
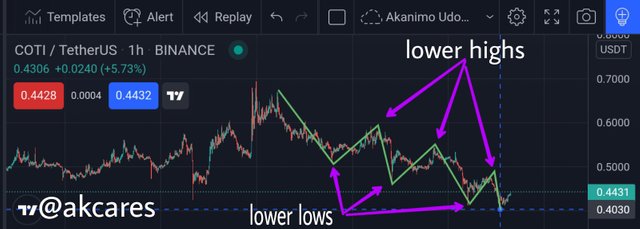
Normal bearish market structure.
In this way, the price does not close higher than the previous high point and it does not open higher than the previous open.
Once this pattern is no longer followed, there is a break of the bearish market structure. Let's say, it happens that there is a low point that is not lower than the previous low or even opens at a higher position. Secondly, if the price does not close below the previous high or is at a point which is higher than the previous high point. When these outcomes are found, then the bearish market structure has been invalidated and broken and there is an ongoing trend reversal.
In a bullish trend, the obtainable market structure is that of higher highs and lows. This means that succeeding high points are at levels above the previous highs and succeeding low points are at levels above previous lows.
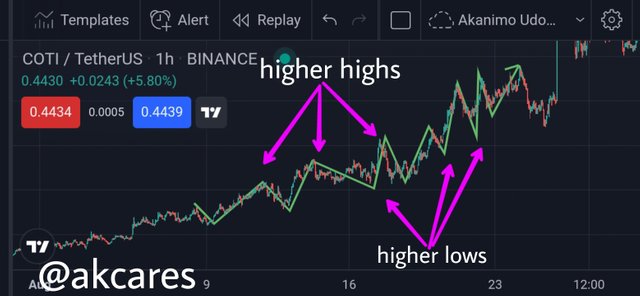
Normal bullish Market Structure.
Here, the price is continously moving up and closing at points which are higher than previous closing points and it is opening at points higher than the previous open.
When the price no longer makes this successive higher highs and lows, it means there is a weakening in the trend and a reversal is by the corner.
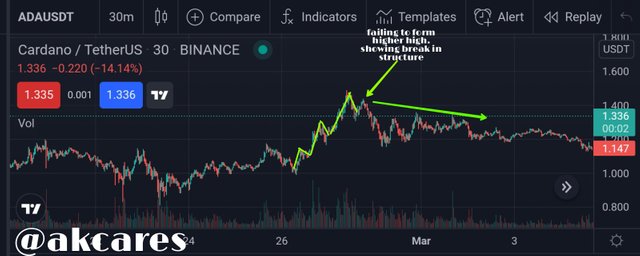
The break happens once the price creates a new high which is not higher than last high or which is below it. Also, when the new low is lower than the previous low, it is said that the bullish market structure has been broken and an impending trend reversal is at hand.
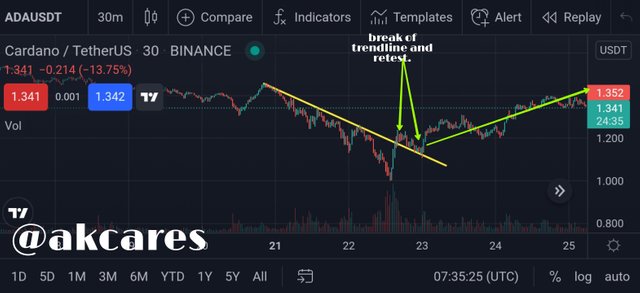
- Break of Trendline
For a trendline to hold true, it must experience repeated bouncing off of price in the opposite direction once price approaches or gets to it. This means that the trendline has to act as a dynamic support or resistance level as the case may be. When this fails to happen, that is, if price does not bounce off the trendline again, breaches it and crosses over, the trendline is said to have been invalidated or broken and this shows that the intitial trend is coming to an end and a new trend is beginning.
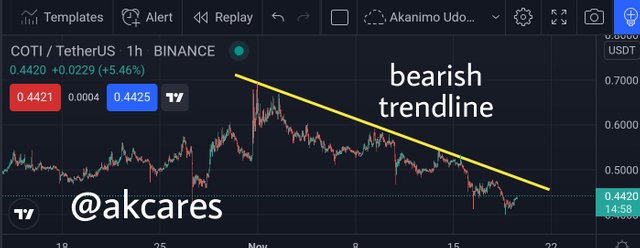
Normal bearish trendline.
In bearish trend, the trendline is drawn from a top high point to join lower high points and come down diagonally from left to right. That is, there are there are lower highs that on getting to the line terminates and the price reverses.
For a break to occur, it will happen that as price is rising, as it gets to the trendline where it is expected to bounce off and start falling, it however crosses the line and moves above it subsequently closing above it at a point which is above the previous high point. This means that the price no longer respects the dynamic resistance level of the trendline.
In a bullish trend, the trendline is diagonally from down to top. That is from a lower point to a higher point which joins higher lows.
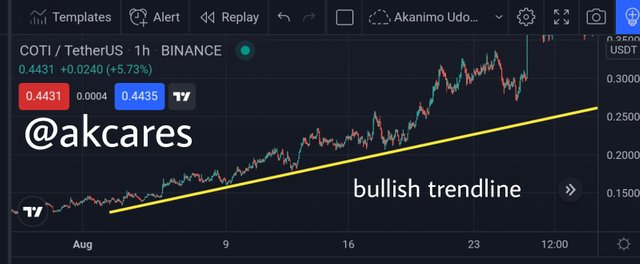
Normal bullish trendline.
For a bullish trend, the usual trendline is honored once price coming from up to down reverses on getting to the trendline and goes up again.
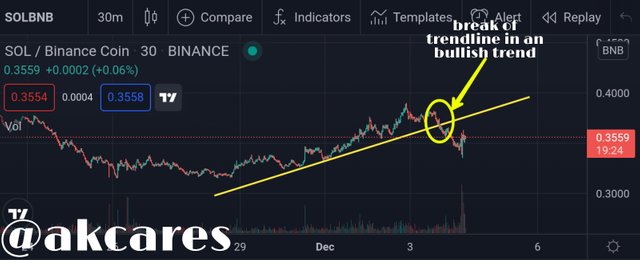
To break this trendline, price falling, will by pass the trendline, go below it and close below it at a level lower than the previous low. In a essence, it shows that the dynamic support level held initially by buyers have failed to hold and has been breached by the rally from the sellers.
- Divergence
This phenomenon where price action is giving a contrasting signal from that given by a technical indicator can be used to detect potential trend reversal. Divergence constitute a disagreement between an indicator and the price of an asset.
At any point when price and the indicator are following different paths a divergence is taking place. Once there is disparity between price action and technical indicator signal, it shows that the current trend has become very weak and the those in control are lossing their strength and an impending trend termination and trend reversal is on.
In a bearish trend, the divergence occurs as the indicator is producing signals in the direction of an uptrend while the price movement or price action is pointing in the direction of a downtrend.
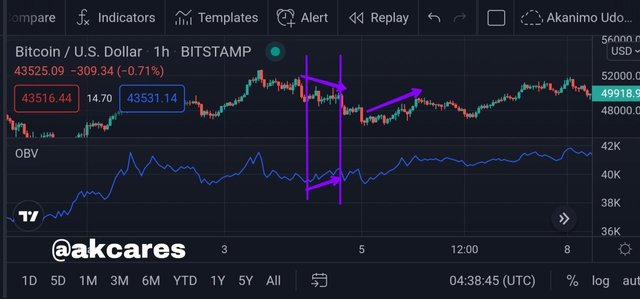
Here, there is a formation of a lower high and higher low pattern by the indicator whereas, the market price chart is forming a lower low and lower high pattern. When we locate this divergence in a bearish trend, it entails that sellers have lost the rally and buyers are pumping in their purchasing powers to get price to turn upwards and start moving in that direction.
In a bullish trend, this divergence occurs when an indicator is giving a sell signal by indicating a downtrend while the price action is going in the direction of an uptrend.
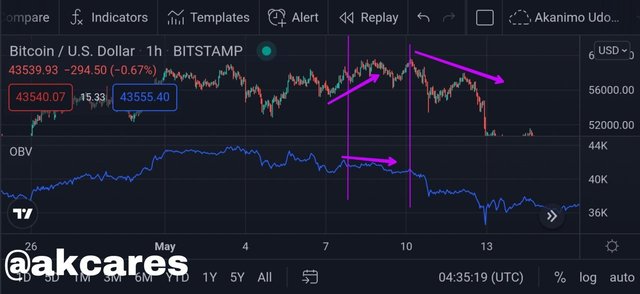
Here the indicator produces a lower low and lower high pattern while the market price chart is giving a higher high and a higher low pattern. As this occurs in a bullish trend, it shows that buyers are exiting the market and sellers are taking over to bring the price moving downwards.
- Double Top and Double Bottom
These are wonderful chart patterns employ by many traders. As the name implies, they are a combination of tow pointed high points either in an upright position or in a reverse position found at the bottom of a chart mostly in a bearish trend. These two pointed tips show that price has stalled and is unable to move beyond that level.
Double Bottom is found in a bearish trend. As price keeps going down, it gets to a point where the next low point is just at the same zone as the previous low, meaning that the price cannot close below that point. Also, for this reversal pattern, the reversal off this last low point will result in the price closing at a point which is higher than the previous high point.
From the normal bearish market structure which is that of lower lows, price usually retraces once it has reached this new low.
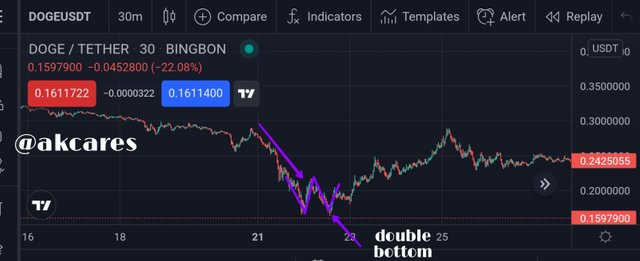
Here, after the retracement, the price moves back in a downward orientation but does not go below the previous low but rather retracement again after reaching the tip of the previous low. This new retracement line climbs up and goes higher than the last high point. This formation made is called the double bottom.
Double Top is a reliable trend reversal pattern found in an uptrend. It is found at the top of a trend. In an uptrend, the market structure forms higher higher highs and lows. In an instance of a double top, the higher high is formed from a previous move, a retracement follows which is supposed to go up and supercede the previous high, that it climb above the previous high to continue the uptrend.
However, what happens is that, the price retraces and goes up, but does not climb above the level of the previous high but stalls at that point and begins to go back downwards. The two high points created form the double top which is an indication that buyers do not have the power to push the price up again and as such, the price begins to go down after this point and even closes below the previous low point.
So, in a double top, we have two high points closing at the same level but the retracement of the second points falls below the retracement of the first high or even lower.
Place a demo trade using any crypto trading platform and enter a buy or sell position using any of the above mentioned trend reversal/continuation pattern.
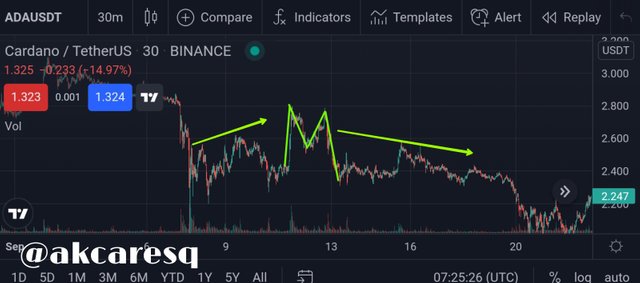
For this assignment, I will be be taking a buy trade on the pair of LUNAUSDT. I decided to take the trade because of the double bottom I spotted on the market price chart.
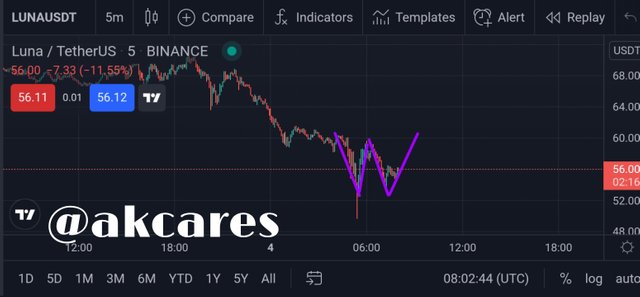
The market had been moving in a downtrend for some time forming lower highs and lower lows. Then at a point, it failed to make a lower low but started to go up. Here, I was able to sport a double bottom reversal pattern.
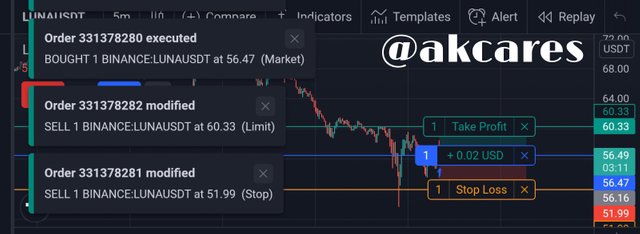
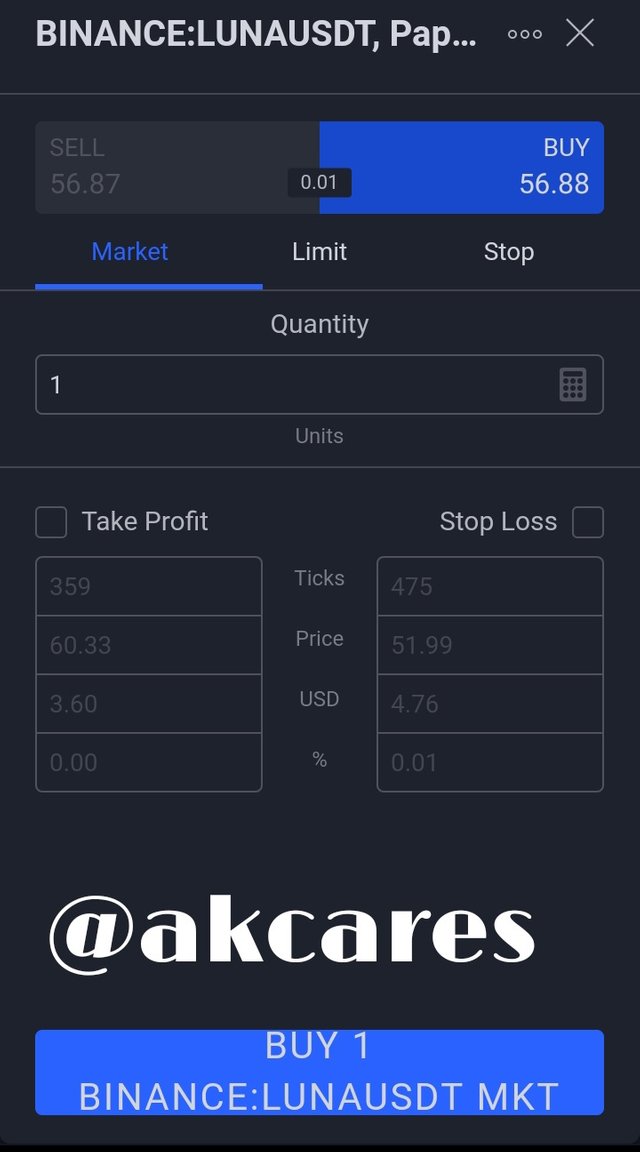
So, I picked a short position at that point. Setting my risk to profit ratio at 1:1. The entry point was after the price had retraced and retested. Take profit was at equal distance for the length of the bearish impulse.
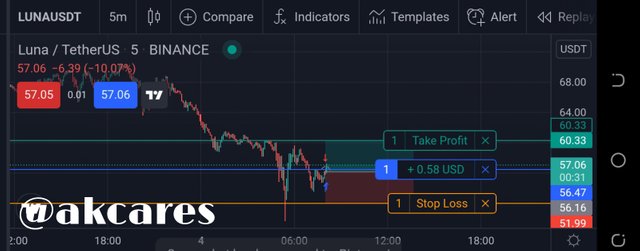
The trade seemed to be doing ok.
Images in this homework are all gotten from Trading View
As it is already known by most people that the crytopcurrency chart moves in trends, it is necessary to also know that this trends do change from time to time. We have trends transitioning from one to another as the market progresses. No matter the direction of the market, a trader is very well placed to take part in the market and make profits from it.
Thus, to make this profit, such a traders has to be skillful in picking out a trend as well as detecting when such trend is getting reversed. A trader can trade in both the Initial trade and the subsequent trend. However, it will be a tragedy if such a trader is caught up while still in a trade from the previous trend while the trend has reversed.
Trend reversal patterns become very useful tools in this cases, to mark out when a trend is reversing. These reversal patterns give information of the impending reversal which is very necessary to aid a trade know what actions to take that will be appropriate with the prevailing market condition. There are a number of these trend reversal patterns which should be studied and mastered by a trader as they are pivotal in ensuring successful trading experience.
These reversal patterns can serve as very useful and important guides to traders. Prof. @reminiscence01 has done noble by bringing this lesson to us. Great job sir.
Hello @akcares , I’m glad you participated in the 3rd week Season 5 of the Beginner’s class at the Steemit Crypto Academy. Your grades in this task are as follows:
Observations:
This is not a good example of divergence. You can revisit the lesson to understand divergence properly.
Recommendation / Feedback:
Thank you for participating in this homework task.