Understanding Trends - Crypto Academy / S5W1- Homework Post for @reminiscence01
Crytopcurrency asset prices are represented on charts which have peculiar patterns and direction of movement. These directions represent some prevailing conditions in the market depending on which class of market players exhibit the higher Influence.
The different movement patterns are necessary in guiding a trader to properly analyse the market and make more accurate trading decisions. These market direction concepts is what Prof. @reminiscence01 has enlightened us about in this lesson. I will be tackling the assignment questions in the sessions to follow.

1a. What do you understand by a Trending market?
As I have hinted above, the market price chart of cryptocurrencies have certain directions of movement. Depending on the direction, the market could be seen to be either trending or not. Thus, a trending market is one in which the price chart is moving continuously either in an upward or a downward direction.
A market is said to be trending when the price is a currency is significantly increasing or decreasing in value for some length of time. For a market to be trending, there has to be a clear and somewhat prolonged move in a particular direction.
1b. What is a bullish and a bearish trend? (screenshot required)
- Bullish Trend
This refer to a situation where the price of an asset continously rises and moves in an upward direction. In this trend, price closes higher than the previous highs. It is characterized by the formation of higher lows and higher highs patterns.
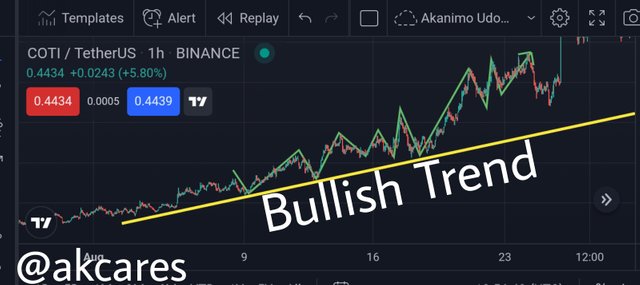
This occurs when there is much buying pressures in the market which means that buyers are on control and that the demand for that asset is growing and getting higher. Like the law of demand states, the higher the demand, the higher the price. Thus, when the market is in a bullish condition, the price is moving upwards. Thia is also described as an uptrend.
- Bearish Trend
In a bearish trend, the price is an asset is plummeting downwards and closing lower than the previous lows. Here, the asset price forms lower highs and lower lows pattern. A bearish market marks the predominance of sellers and prevailing high selling pressures. As there are high supply of the asset in the market, the price keeps coming down due to the surplus availability.
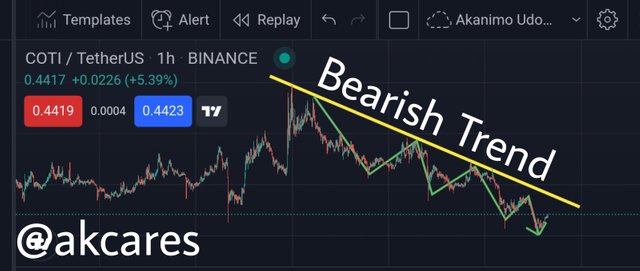
During this period, sellers are in control of the market. Considering the law of supply which states that the higher the quantity supplied of a commodity, the lower the price of such commodity. This continous fall in price makes the price chat to keep going down to form a downtrend or bearish orientation.
2. Explain the following trend identification and give an example of each of them. (Original screenshot needed from your chart). Do this for a bullish and a bearish trend. i) Market Structure. ii) Trendlines
There are methods and tools used by traders to determine what condition a particular market is, whether it is ranging of trending and if it is trending, what type of trend it is. These are usually referred to as trend identification tools.
Market Structure
Market structure simply involves the pattern of movement of the price and the kind of shapes formed. Market structure is concerned with the structure and shape made by price charts. Using these structures, a trader can decode if the market is in an uptrend or in a downtrend depending on the orientation and nature of the structure.
In a bullish trend the market structure formed is usually seen having higher lows and highs. This looks like an extended zig-zag pattern rising higher and higher from bottom to top. The asset price traces points of closing higher than the previous close points.
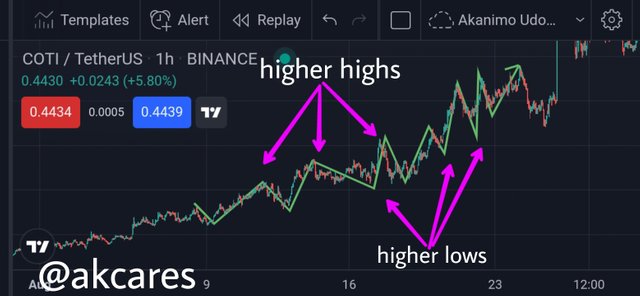
Here, price is kept higher than the previous high point and the open is also higher than the previous open. This shows a continous rise in demand which pushes the price up.
In a bearish trend the structure is that of lower lows and lower highs. The ziz-zag pattern here extends downward from top to bottom. The price pattern links open points of price which keeps going lower than the previous opens and also close positions which are lower than the previous close positions.
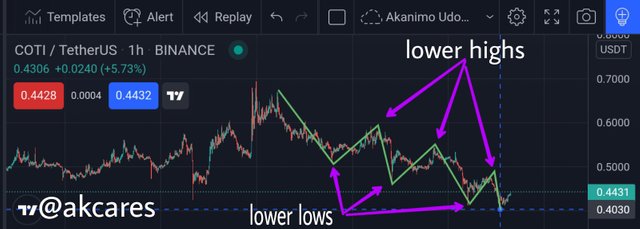
The open and close points of candlesticks in this bearish patterns are dropping below the previous ones. This is evident because of the continous fall in the price of the asset.
Trendlines
Trendlines also helps traders to pick out trends in the market. As the name implies, it is a line linking points in a particular direction. It is drawn to show how price is moving from one point to another. To draw a trend line, a straight diagonal line is drawn which joins at least two points on a particular trend or direction.
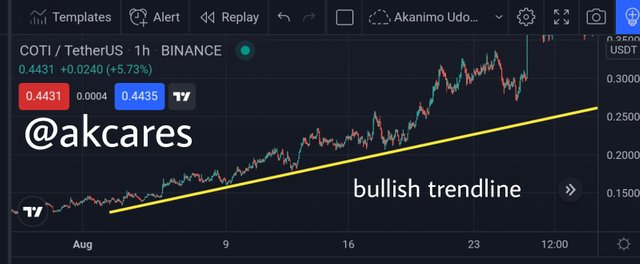
To draw a trendline in a bullish trend, at least two higher low points are connected by an diagonal line and is traced to the distance in the future. This trendline is always rising upward towards the right. This trendline is drawn below the price chart.
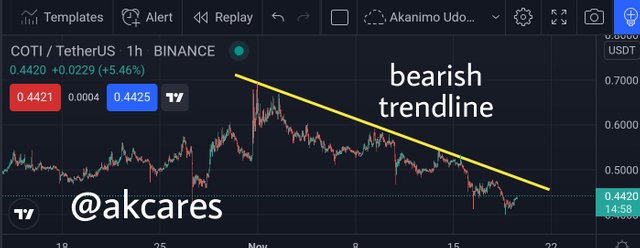
To draw a trendline for a bearish trend, a diagonal line is drawn connecting at least two lower highs. This trendline falls downwards from left to right. This trendline has the price candlesticks below it as it hovers over them.
3. Explain trend continuation and how to spot them using market structure and trendlines. (Screenshot needed). Do this for both bullish and bearish trends.
An uptrend or a downtrend does not just move in unilaterally in one direction or in one impulse. Most times trendlines appear to have ziz-zag formation with the middle line being the retracement. The periodic corrections or halt in the trend do not signify a change in the overall market movement. This means that a trend can break but will still be moving in the same orientation it was moving prior to the break.
This halt in momentum and direction is attributed to traders removing their stakes from the market. In the market price chart, this break and continuation can be spotted using some means.
Market Structure
As explained in previous sections, market structure is simply about the shapes that the prices makes while moving on the chart. There are certain shapes that help to show the type and condition of the trend. We can also decode a potential trend reversal or continuation. This is shown by this structure.
In a bearish trend, the obtainable market structure is to have lower highs and lower lows. This means that the open point of the next impulse is at a lower point than the previous impulse after the retracement. It means that buyers rally during the retracement was unable to overcome the high selling pressures and thus sellers still control the market. This signifies the inability of buyers to outperform the initial high point and still being overpowered by sellers.
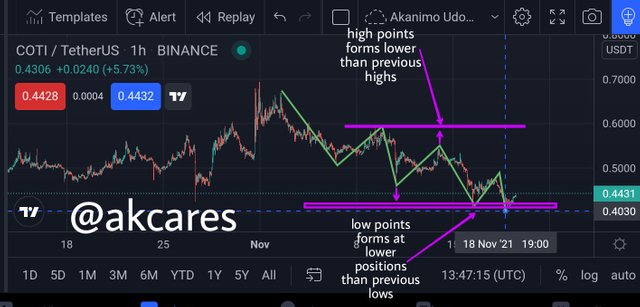
The structure signals continuation if the next high point after the retracement is not higher than that previous lower high point and the new low is lower than the previous low. This means there has to be a descending zig-zag structure.
In a bullish trend, the market structure comprise higher lows and higher highs pattern. That is, the price keeps opening and closing at points that are higher than the previous open and close points respectively.
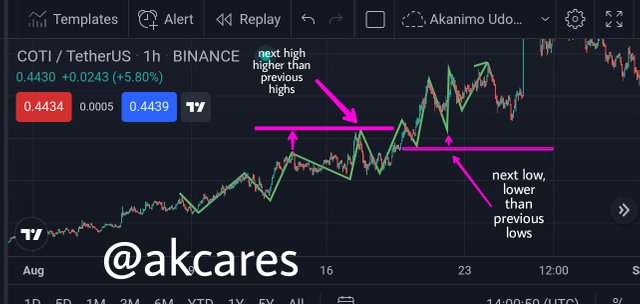
Here, the next upward impulse after the bearish retracement begins at a high point that is higher than the previous impulse and ends at a low point that is also higher than the low point of the previous impulse.
Here, the attempt by sellers during their retracement period could not drag the price lower than the previous low point so the price keeps going up from the dominant buying pressures. The new low point after the retracement does not go below the previous low point and the new high point formed in this impulse is higher than that if the previous impulse, it goes higher than the high point of the last impulse.
When these criteria are in place, it means that the current trend, either bearish or bullish is still strong and will most likely continue. Otherwise, when these criteria are violated or altered, it signals weakness and possibility of trend reversal. That is, if in a bearish trend, the new high is not lower than the previous high and the new low is not lower than the previous low, and in an uptrend, the new high is not higher than the previous high and the new low is not higher than the previous low.
Trendline
A trader can also decipher if a current trend is about to end or continue by using trendlines. While using trendline to check continuation a traders needs to consider somethings. After successfully drawing the trendline by joining at least two terminal points either lows or highs depending on the type of trend, and extending the line further such a trader can confirm continuation.
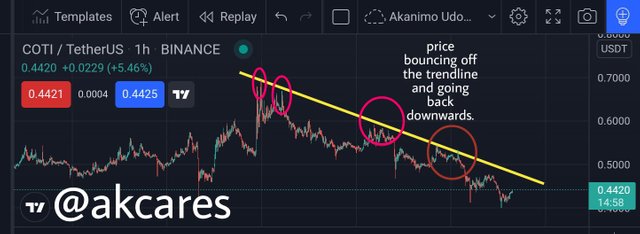
In a bearish trend which would have a trendline joining atleast two lower low points, if the price is rejected or bounces back in a downward direction on touching or approaching the trendline after a retracement, then it shows a high probability of the downtrend continuing.
In a bullish trend, once the price comes down during a retracement and is rejected or bounces back upwards when getting close to or touching the trendline, this signifies that the trendline is being respected and the trend is going to continue.
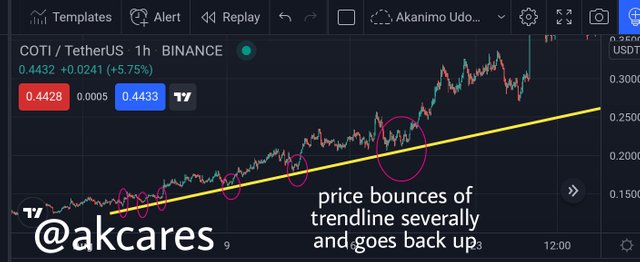
If price in reaching a trendline crosses over to the other side, this is a violation of the current trend and signals a potential reversal in the direction of movement.
4. Pick up any crypto-asset chart and answer the following questions - i) Is the market trending? ii) What is the current market trend? (Use the chart to back up your answers).
I will be using the pair of COTI USDT on Tradingview to answer this question.
- i. The market is in a trending phase. This is because the price is seen to be moving in a particular diagonal direction for some time. It is not moving horizontally or in a sideways direction.
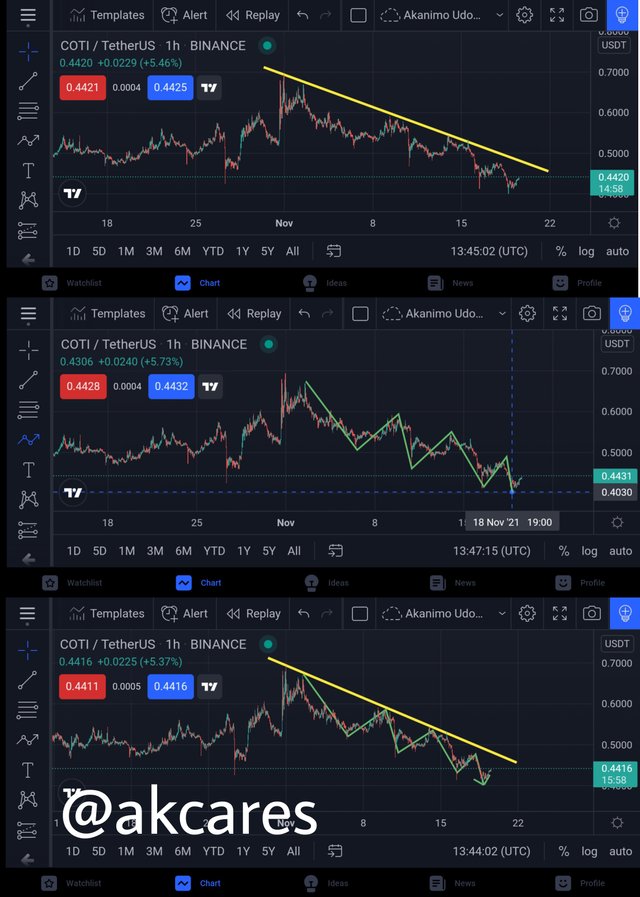
- ii. At the time of writing, the market was in a bearish trend. This is confirmed by the market structure and trendline incorporated into the chart. For the market structure there is a clear formation of lower highs and lower lows as the price keeps moving downwards.
Also, drawing a trendline, we see the line linking a number of lower low points and bouncing off the trendline several times.
All images in this assignment are gotten from the same source which is https://www.tradingview.com/
The crytopcurrency market chart has interesting aspect and parts. The chart is able to convey a lot of information to the trader and help him make high probability trading decisions if he carefully studies and interprets it.
Looking at the chart, a trader is able to tell the situation of the market, the players that is in control and the behavior of the asset's price at any point in time. The price chart does not just move anyhow. It has some specific direction of movement. The movement can be in an upward direction, a downward direction which constitutes a trending market or in a sideways horizontal direction which constitutes a ranging market.
These different holds specific significance for trading activities. As such, a trader needs to make use of some methods and tools like trendline and market structures to determine the nature of the market and the direction of movement. These can also help in knowing how strongly the market is moving and if it will continue to move in that direction or get reversed.
This has been an interesting lesson by Prof. @reminiscence01. Kudos!
Hello @akcares , I’m glad you participated in the 1st week Season 5 of the Beginner’s class at the Steemit Crypto Academy. Your grades in this task are as follows:
Observations:
That's correct.
Recommendation / Feedback:
Thank you for participating in this homework task.
Hello @akcares , I’m glad you participated in the 1st week Season 5 of the Beginner’s class at the Steemit Crypto Academy. Your grades in this task are as follows:
Observations:
That's correct.
Recommendation / Feedback:
Thank you for participating in this homework task.