Trading Using Rectangle Pattern - Crypto Academy / S5W4 - Homework Post for @sachin08
Personally, I lovey to tag the crytopcurrency market price chart as being very interesting. This is one chart that one can never get bored studying the. It has just so much dynamics, designs and patterns that bring great insight to trading. With significant knowledge of these chart properties and patterns, a trader can never be in lack of data to use in his analysis.
There are abundant toolsa to employ. Rectangle pattern is a very interesting chart pattern and having knowledge of it can bring a lot of profits when properly identified and used. This lesson by Prof. @sachin08 is truly useful for us beginners as this pattern looks quite reliable. My assignment responses are in the following sections.

Explain Rectangle Pattern in your own word.
Typically, a rectangle has four sides with the two upper and lower sides being more extended than the others. These are usually in parallel orientation from each other. This shape is sometimes traced by crytopcurrency pieces on charts. This is mostly found in a sideways market situation when the market is consolidating after an impulse.
Rectangles are found in a trending condition but usually occur either after an uptrend or a downtrend. It is characterized by short alternating upward and downward movement between two levels of interest with the top being a zone of resistance and the bottom being a zone of support. This brief up and down swinging forms a kind of channel marked by a trendline linking the high points and another linking the low points within this range.
Rectangle is formed when price having a low momentum and volume, make short up and down motion bouncing off regular high level and low level which can be traced as resistance and support levels using an upper and a lower trendline. These trendlines are flat and horizontal. Here, price gets to a certain horizontal level above and below more than two times and is not able to move past it but seem to be bounded and confined to that area.
How to identify Rectangles. Explain with Screenshots.
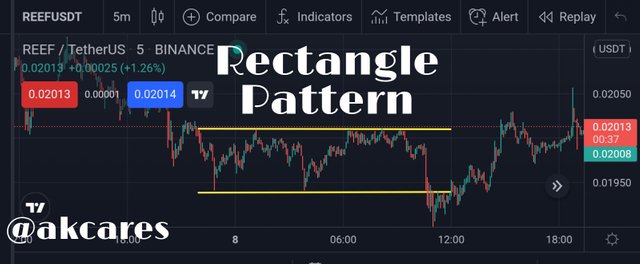
Rectangle pattern is formed on a price chart as a break or pause from strong uptrend or downtrend. To identify this pattern, the price must move in a certain formation. Once price has has form a number of highs and lows over a range after brief movements and two or more of these highs and lows can be joined by horizontal upper and lower trendlines, then this is a rectangle.
So, a trader looks out for when price will begin to move sideways that is not in a trend. Then, the price should reverse repeatedly off a resistance and a support level. The trader should then link at least two high points and low points with flat trendlines. This is how to find and identify a rectangle.
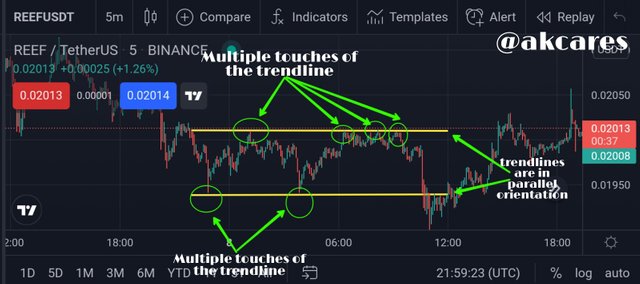
Here, there are multiple touches of the upper and lower trendlines by the price. The touching points are also spread across the rectangle at different points. The upper and lower trendlines are parallel to each other.
To qualify as a rectangle:
The price is usually out of trend and in a ranging or consolidation phase.
The highs and lows made by price during this range must be arranged such that they approach or touch a particular upper and lower region of resistance and support respectively.
There has to be at least two highs and lows touching the upper and lower trendlines respectively.
The touching points must be spread across the length of the consolidation or range. They should not be concentrated on one particular point.
Can we use indicators with this pattern to get accurate results? Explain with Screenshots.
Obviously, we can make use of some indicators with rectangle pattern. Considering that rectangles are concerned with ranges and sidewards market, technical indicators that take into account areas of consolidation and collection are perfect fit. My choice of technical indicator are Bollinger Bands and Donchain Channels.
Donchain Channels
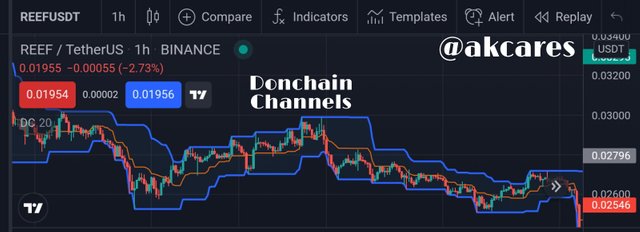
Donchain Channels is calculated by using the highest high and lowest low made by price over a certain period. These form the top and lower bands respectively with the distance between forming the Channels. There is always a middle band which is the mid point between these two
Donchain Channels has three lines generated by moving average calculations.
Donchain Channels represents how quickly the price of an asset changes. If the price has great variability and volatility over a certain period, the bands extends far apart from each other. If there are little changes in the price over a set period, the bands to come together with little distance between them.
The two boundary bands act as resistance and support levels which usually see price bouncing off them. They move relative to each other over the set period.
As price approaches the upper band, touching it or getting very close to it, it can be said to be in an overbought region.
When the price is going down and touches or gets very close to the lower band, the market is can be said to be in an oversold region. As the price gets to these regions, it shows that there is a great possiblity for the price to bounce off and retrace in the opposite direction.
To take a bullish trade and take a long position, a trader should look out for when the approaches the oversold region and shows signs of reversal.
To take a short position that is open a bearish trade, a trader should observe when the price is in the overbought region and looks likely to reverse.
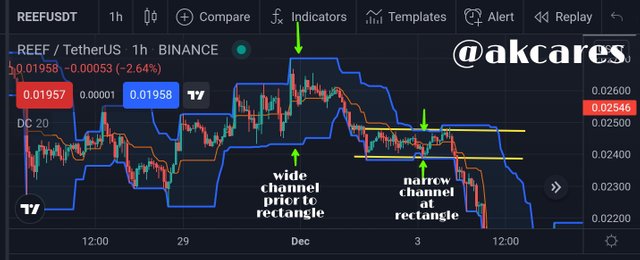
There is a compression and reduction in width of the channel at the rectangle area which shows a ranging market and a consolidation. Prior to this point, the channel was much wider and with price experiencing high volatility. As price overcomes this low momentum and breaks out past the initial support level while sticking to the lower band of the channel, it shows that a downward trend is on and a sell position should be opened.
Bollinger Bands
This is very similar to the Donchain Channels. It is also made up of three bands, the upper, middle and lower bands.
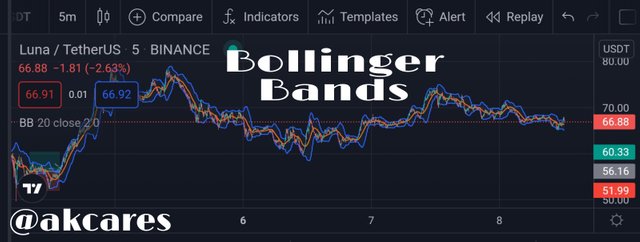
The bands compress or expand depending on the volume of trade and the momentum of the market. When there is serious momentum, price fluctuations are high and trading is done in high volume, the bands spread wider apart from one another.
On the other hand, when trading is of low volume, there is low momentum and price fluctuations are minimal, the bands come together and stay close to one another. When the bands are spreading out, it is usually described as a breakout and when they are compressed, it is called a squeeze.
The bollinger squeeze usually occurs when there is some inactivity in the market and the market is ranging. This can show potential areas of locating a rectangle much easier as rectangles are usually in the region of consolidation.
Price approaching the upper band shows that the uptrend might soon be reversed as price touches the band. If price is moving down towards the lower band, it means the downtrend might soon terminate as price hits the band and will begin to go up.
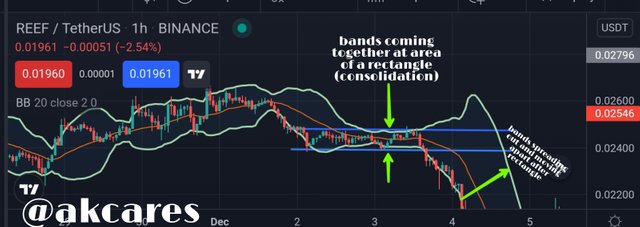
The band squeeze together that is come close when there is a consolidation and a rectangle is formed. The breakout of the bollinger bands indicates a breakout of the triangle pattern where the bands also begin to expand.
These technical indicators are useful in picking out and identifying the rectangle pattern as well as guiding a trader on how to open trading positions at these points.
Explain Rectangle Tops and Rectangle Bottoms in your own words with Screenshots of both patterns.
Rectangle tops and bottoms is concerned with how the pattern appears on the price chart with respect to the previous trend. It is relative to what position of the market the consolidation takes place considering what direction the price is coming from.
Depending on whether the rectangle is found at the top of a trend on at the bottom of a trend, such could either be described as a rectangle top or a bottom.
Rectangle Top
This is rectangle pattern that appears at the top of a trend after the price had been moving upward previously. For a rectangle top, the trend leading to it is an uptrend whose consolidation forms this rectangle top.
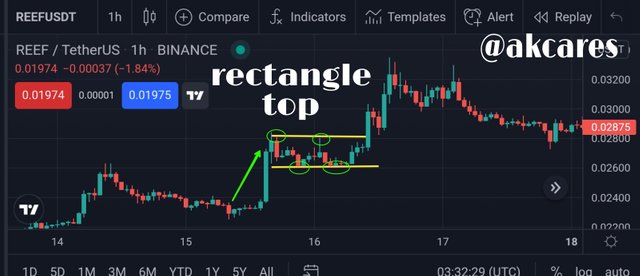
Price is entering the rectangle from bottom to top.
Here, price is coming from down before the rectangle appears. This shows that pattern is formed on top of the trend.
Rectangle Bottom
This rectangle appears at the foot of a trend after price has been going down in a downtrend for a while. The rectangle bottom has a previous trend to be a downtrend which the rectangle bottom is its pause or ranging phase.
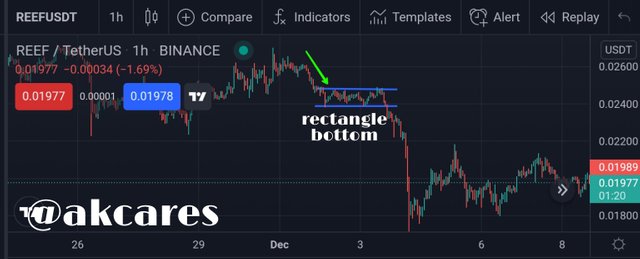
Price entering the rectangle from top to bottom.
In this type of rectangle, the movement of the price is coming from above before the appearance of the rectangle pattern. The pattern is placed or forms at the bottom of that initial downtrend.
Show full trade setup using this pattern for both trends. ( Entry Point, Take Profit, Stop Loss, Breakout)
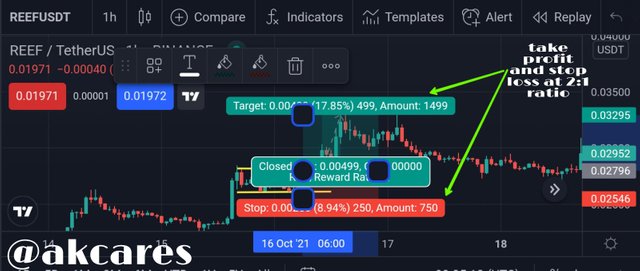
To perform this tasks, I will demonstrating a short and long trade on the pair of REEFUSDT using a 1hour time frame.
SELL TRADE
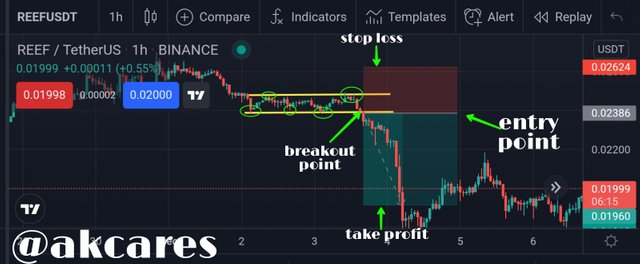
Here, we find the rectangle pattern forming out. There is a pause from the intitial downward trend and price begin to consolidate. It bounces off certain zones of resistance and support.
Joining these points form the upper trendline and the lower trendline respectively. There are two touches on the upper trendline and three touches on the lower trendline.
The break out point is at the formation of the large bearish candlestick which breaches the lowers trendline and breaks out. This point of breakout also signals the entry point where the short position is opened.
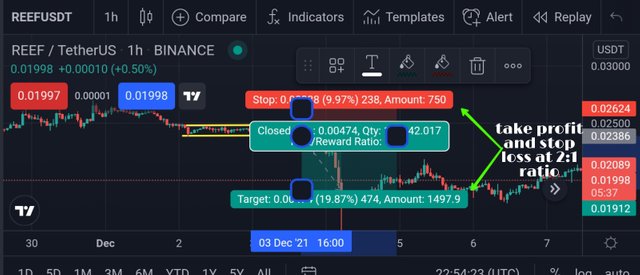
Take profit is set below the rectangle after the downward breakout and stop loss set above the rectangle on top of the upper trendline being a resistance level.
Here the take profit is set at 2× the value of the stop loss, with take profit being twice the length of the stop loss, making it a ratio of 2:1.
BUY TRADE
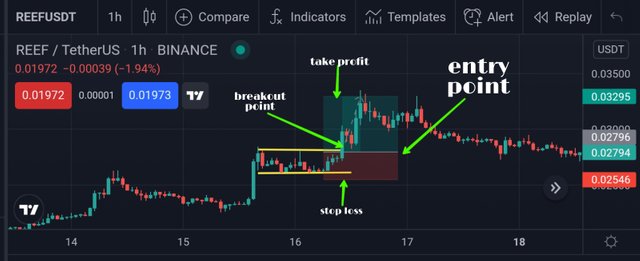
There is a clear rectangle pattern formed at this point.
The initial price direction was in a uptrend but a range occurs here a the momentum is reduced and the trend is paused at this consolidation area.
Price bounces of the resistance level twice and bounces of the support level twice also. These points when connected by trendlines form the upper and lower trendlines.
Price goes ahead to breach the upper trendline and breakout as a large bullish candlestick is being formed. This breaching of the upper trendline is the breakout out point and signals the entry point also where the long trade position is opened.
Take profit is set above the rectangle after the upward breakout and stop loss set just below the rectangle after the lower trendline being a support level.
Here the take profit is set at 2× the value of the stop loss, making it a 2:1 ratio.
All images were taken from Trading View
Trading the cryptocurrency market is a whole experience of its own. There are so many things that can be applied to make the trading very interesting and much profitable. One of these methods is the study and application of some basic chart patterns. It is beautiful how the basic shapes we learned back in lower grades are now being applicable in our trading endeavors.
In previous lessons, have been taught triangle patterns. Now, Prof. @sachin08 has brought the concept of rectangle pattern to us. This pattern, though a bit difficult to locate is a very reliable trading technique that can draw a lot of gains to a trader from looking out a taking a trade at the breakout which is usually very significant and massive.
A trader only needs to be able to spot and trace this pattern, then understand the orientation, whether a rectangle top or rectangle bottom, then he watches out for the breakout. To know whether to take a short or a long position. This pattern when properly applied holds a lot of promise. This has been a great lesson.
