Strategy and use of Donchian Channelss - Crypto Academy / S5W1 - Homework post for @ lenonmc21
It is not advisable for a trader to trade blindly or use his guts in making trading decisions. There are a number of useful technial analysis tools as well as indicators that can point traders in the right direction when taking trades.
For crytopcurrency trading, technical indicators abound that can be employed. A good option is the Donchain Channels. As explained by Prof. @lenonmc21, this indicator does not indicate one signal, but can give a combination of more than two depending on how well a trader can interpret these signals.
After going through this great lesson, I want to go ahead and answer the questions below.
1. Explain and define in your own words what the Donchian Channelss are?
Donchain Channels is a type is technical indicators used in analysing price behaviors and dynamics. Generally, technical indicators are symbols or patterns on price charts which are representations of price movement generated from calculations using historic data from previous price behavior.
They are mathematical calculations and projections using price, volume and other information which are displayed as patterns on market price chart of a crytopcurrency to help in predicting the possible direction of price movement in future which mostimes have a repetitive behavior. Donchain Channels comprise three lines generated by moving average calculations.
Donchain Channels is calculated by using the highest high point and lowest low point made by price over a certain period. These represents the top and lower bands respectively with the distance between forming the Channels. There is always a middle band which is simply the mid point between these two.
The origin of the name is from its creator who goes by the name Richard Donchain. He is said to be an ardent researcher of the futures market and the father of trend monitoring. This indicator was created in the year 1950 with the major aim of providing a representation of the volatility of an asset over a 24 hour time frame.
Basically, Donchain Channels represents how quickly the price is an asset changes. If the price has great variability of over a certain period, the bands extends far apart from each other. If there are little changes in the price over a set period, the bands tends to come together with little distance between them. With Donchain Channels, breakouts, and potential overbought/oversold conditions can equally be decided.
Donchain Channels aims to show bullish and bearish extremes that point to reversals as well as higher and lower breakouts, breakdowns, and emerging trends.
The two boundary bands also act as resistance and support levels which usually see price bouncing off them. They move relative to each other over the set period meaning they keep adjusting.
2. Does it explain in detail how Donchian Channelss are calculated (without copying and pasting from the internet)?
As stated above, this indicator is made up of three lines or bands. It is calculated using the highest high point and lowest low point made by price over a certain period of time used as reference period. In the indicator, upper band represents the highest price of the asset over a fixed number of periods while the lower band marks the lowest price of the asset over that same number of periods.
The upper band is the highest high made by price during a specific period. The bottom band is the lowest low point reached by price over that same specified period. This period could be in minutes, hours, days, months or so depending on what is intended to be represented. The mid range or middle band is computed using the median of the upper and lower bands.
For instance, in the price chart of NEOUSDT below, to compute the Donchain Channels, the upper band will be calculated using the highest point of 42.4045 and the lower band will be computed using the lowest low value of 36.0466 using the 50 periods ( last 50 candlestkcks) as demarcated by the rectangle.
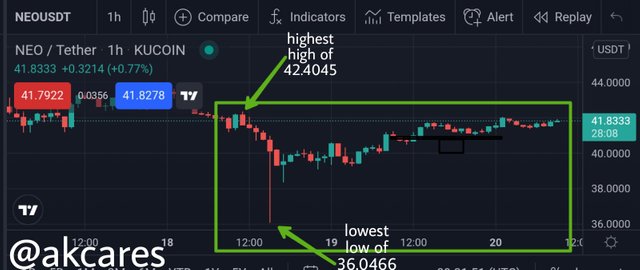
The mid range will be calculated using the median of these two bands which will equal 39.22555 (42.4045+36.0466/2).
3. Explain the different types of uses and interpretations of Donchian Channelss (With examples of bullish and bearish trades)?
Donchain Channels is a very interesting technical indicator. One reason for this is that it can be applied to a number of uses. The information it presents can be used to obtain more than one signal. Unlike many other technical indicators which produce signals based on only one variable.
Donchain can be applied to various uses and interpretation. A trader obtains more details about the market situation from this indicator. Some of the uses that Donchain Channels can be put to include:
Picking Out Strong Trends and Detecting Zone Breakout
A trader can be able to detect the strenght of a current trend using the Donchain Channels. This is gotten from how close and how long the price has stayed with either the upper band or the lower band.
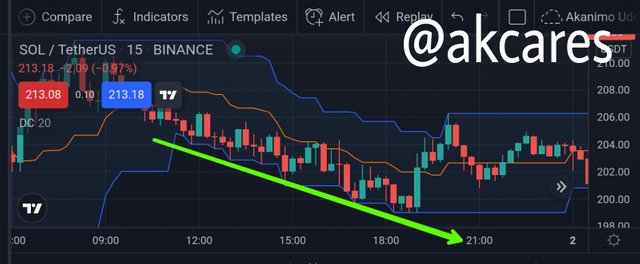
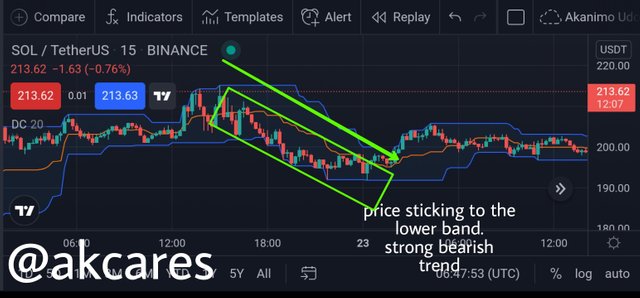
When price approaches either the upper band or lower band and does not break it is bounce off it but rather remains attached to it above or below the mid range, this shows that the current trend is very strong and might continue for a long time without reversal.
The area covered by price during this attachment and the level held marks a strong zone which can be either a resistance or support level depending on the position.
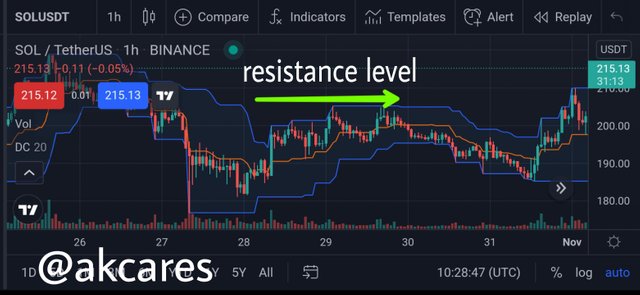
Resistance Zone
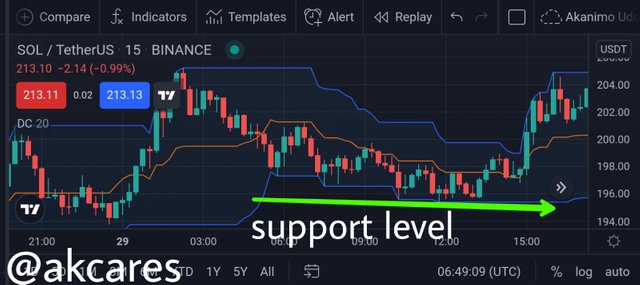
Support Zone
Considering the detected strong trend and zone above, when price finally moves away from the held level and from that zone, it signifies a breakout. When this movement of price away from this zone occurs, a trader can decide to take a trade depending on if the price is moving upwards or downwards.
For a bullish trend, one would find the price being attached to the upper band.
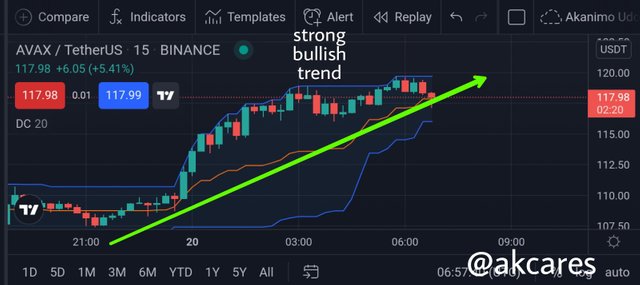
For a bearish trend, the price will stay attached to the lower band.
Judging Volatility
Cryptocurrencies are known to be more unstable than most other currencies. Their prices are always fluctuating intermittently. This is one reason why trading and investing in cryptocurrencies is risky. Donchain Channels can help a trader handle this situation better as it ha the ability to indicate the degree of volatility in the market.
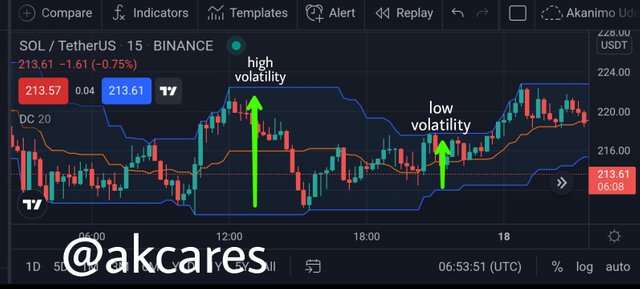
Detecting volatility is one of the key signal that this indicator provides. It is already know that Donchain Channels is made up of bands, how close together or far apart these bands are show how much volatility is there in the market. When the bands extend wider from the others, there there is great volatility going on in the market. On the other hand, when the bands are closely placed to the others, then there is much stability in the price and less fluctuations.
Showing Overbought and Oversold Regions
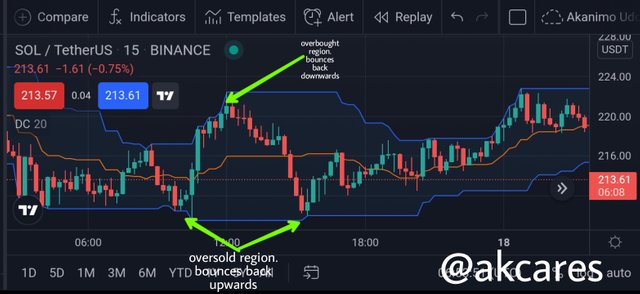
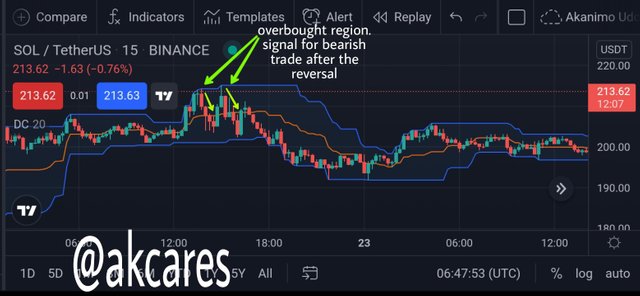
Like some other technical indicators, Donchain Channels falls under the category of osscilators as it can also indicate overbought and oversold regions. The way to mark this regions is by looking out for price movement relative to the upper and lower bands. When the price moves to the upper band, touching it or getting very close to it, it can be said to be in an overbought region.
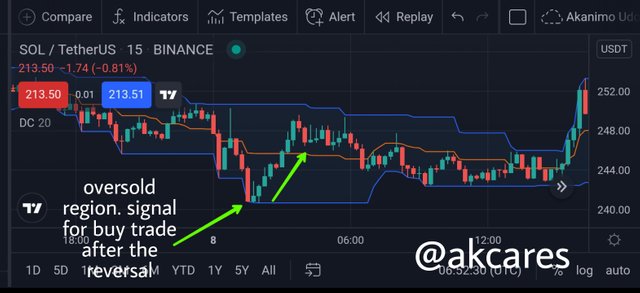
When the price moves down and touches or gets very close to the lower band, the market is can be adjudged as being in the oversold region. As the price gets to these regions, it shows that there is a great tendency for the price to bounce off and retrace in the opposite direction. A trader can take advantage of this to enter trades.
To execute a bullish trade and take a long position, a trader should look out for when the approaches the oversold region and shows signs of reversal.
To take a short position that is embark on a bearish trade, a trader should observe when the price is in the overbought region and looks likely to reverse.
4. Practice (Remember to use your own images and put your username)
Make 1 inning using the "Donchian Channels Breakout Strategy" and make 1 inning using the "Reversal and Retracement Strategy" . You must explain the step by step of how you analyzed to take your entry and make them into a demo account so that I can evaluate how the operation was taken.
Donchian Channels Breakout Strategy
Using this strategy, I took a trade on the pair of LUNAUSDT. It was a long trade.
I decided to take a long position because of the conditions which were present after my anaysis.
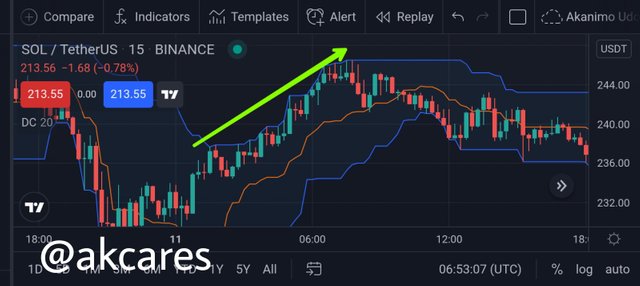
Prior to this point, the price had been in a down trend, forming lower lows and lower highs.
After that, the price began to reverse. This reversal went up and surpassed the last high of the down trend which showed that the trend was surely going up. At this point, the price also broke the upper band and kept going up.
The last bearish candlestick showed strong price rejection and then there was formation of strong bullish candlestick. I entered the trade after the close of the strong bullish candlestick.
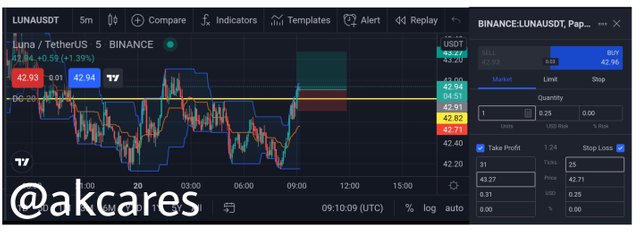
Risk to reward ratio was 1:2 with the risk that is stop loss. Kept at 47% below the candlestick and the reward kept at 94%.
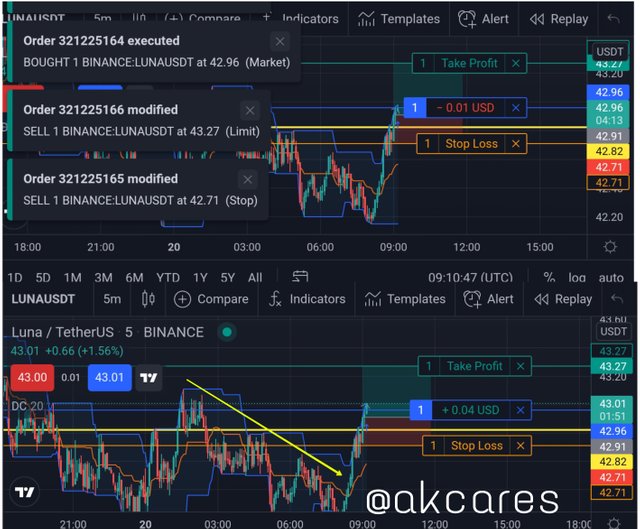
The trade showed great potential as it was already in profit after some minutes.
Reversal and Retracement Strategy
For this task, took a short trade on the pair of AVAXUSDT
My anaysis for the trade was that after the price had moved up an hit the upper band which in this is the overbought region, I waited for the trend to reverse which it did. The region where it reversed had held previously as a resistance level as shown by the yellow horizontal line in the screenshot below.
The price continued to come down and then crossed the mid range and and closed below it. This gave me a clear signal that the trend was going bearish. So, I decided to take a sell trade.
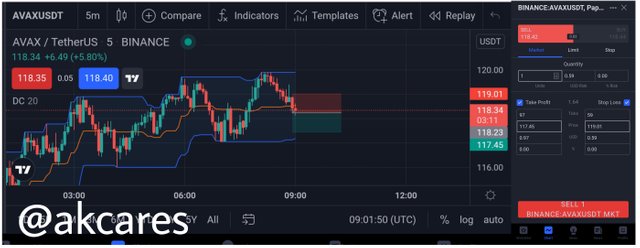
I set a risk to profit ratio of 1:1, entering the trade are point where the crossing bearish candlestkck closed. Stop loss was just below this same candlestkck.
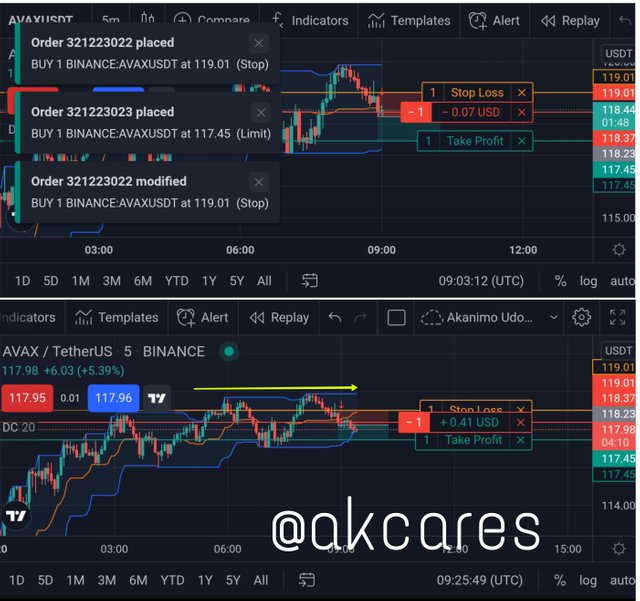
As can be seen below, the trade turned out to be a win trade.
All images and Screenshots are from https://www.tradingview.com/ and edited on picsart.
It is not good for one to wallow in uncertainty and take uninformed decisions. When these happens in life, there are bound to be negative outcomes. The cryptocurrency world is a very unstable one. Traders needs some level of back up and confirmations whole taking trading decisions.
Technical analysis tools and technical indicators of various kinds have been developed over the years. Some of them have different applications though some are of more significance than others.
Even though technial indicators are not reliable as standalone basis for taking trades, they can be employed along with other tools to increase the probability and accuracy of signals.
One interesting technical indicator that can offer real insight into the situation of the market and has some amazing advantages is the Donchain Channels.
This indicator as seen above gives more than one signal and it is very easy to apply and interpret. Traders can have higher successful trades if they carefully study and implement these strategies of this indicator in combination with other tools.
Prof. @lenonmc21 is going great by always bringing fresh lessons to us here. Well done sir.