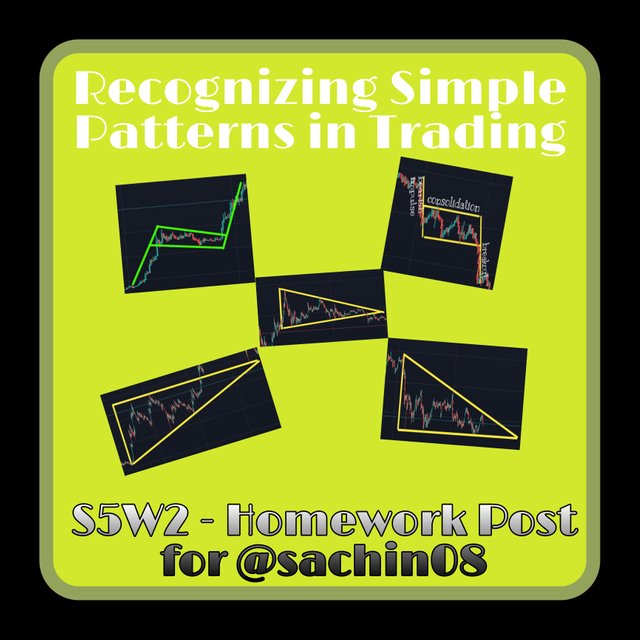
Recognizing Simple Patterns in Trading - S5W2 - Homework Post for @sachin08
Cryptocurrency price chart is not just random moving chart. It has special features and patterns that can be identified and interpreted as basis for taking trading decisions. The movement of the price over time, corresponds to some simple patterns.
Some of these patterns take the shape of regular objects like triangle, rectangle and others. In this class by Prof. @sachin08, he we have been thought some of these simple patterns and I will be making my assignment contribution in the sections below.

What is your understanding about Triangles in Trading. Explain all forms of triangles in your own words. (Screenshot required)
Triangles in trading are just as the name implies, triangles. This pattern is formed when the path followed by the price could be traced to give three sides of a triangle. There are basic chart patterns which are easy to map out and trade even for beginners.
On the price chart, a triangle is formed by connecting two trendlines, the upper and the lower trendlines and then join their starting point to complete the shape. The upper trendline connects the high points while the lower trendline connects the low points. The two trendlines meet at an apex point somewhere towards the right side of the chart.
As the shape of the triangle shows, price movement keeps getting lesser and lesser and continue to move into a tighter range and also converging towards the right side of the triangle.
As we know in real life, there are different types of triangles. In crytopcurrency price charts, there are also a variety of triangle patterns depending on their dimension and their orientation. It is noteworthy that the form of a triangle will determine how it is to be interpreted and applied.
A trader needs to look out for specific details about how the triangle is so as to be able to make proper inference.
Triangle patterns can signal continuation of a trend or a reversal. If the price continues to move in the pattern of the triangle, the current trend is continuing, but if it breaks out or invalidates the pattern, then a potential reversal is underway.
The general assumption is that price will proceed in the direction it was moving before the pattern was formed.
Triangles have been classified into classes. We have symmetrical triangle which is a neutral class. This means that it does not suggest any particular market direction either upward or downward. Ascending triangle which points to a bullish market condition. Descending triangle which suggests bearish market conditions.
Symmetrical Triangle
This is a triangle pattern that is not tilted to one side. The pattern has balanced sides and a harmonious and proportionate figure. Thai triangle is formed with the upper trendline moving from a higher position downwards towards the tip and the lower trendline moving upwards from a lower position to meet at the tip.
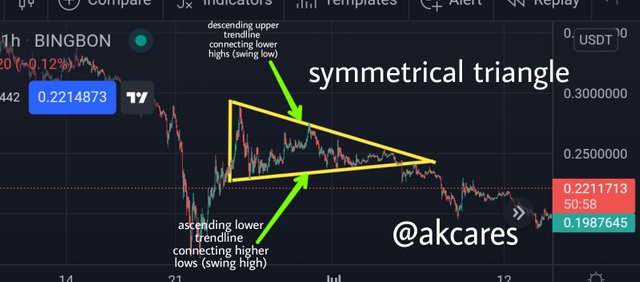
The upper trendline in this case is connecting lower highs while the lower trendline is connecting higher highs. If price should break the lower trendline below, it signifies a possible bearish market. If the price breaks the upper trendline upwards, it signifies a possible bullish trend. This pattern shows that neither the buyers nor the sellers have been able to control the market as the two forces keep cancelling out.
They are unable to influence the price is a definite direction.
Ascending Triangle
Ascending triangle simply means the pattern is rising. Here, the upper trendline is almost static at a certain horizontal level as it joins high points that are almost at the same height. This horizontal upper trendline is serving as a resistance level. The lower trendline is the one that moves diagonally upwards as it joins higher low points towards the tip.
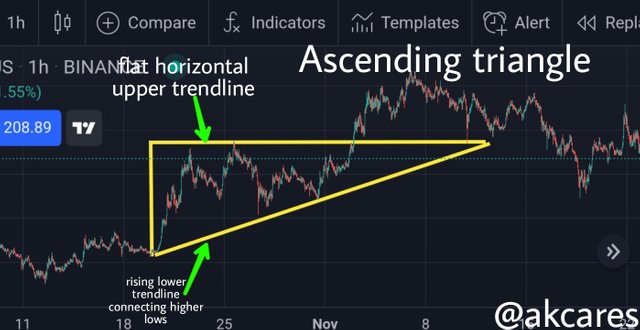
The price in this pattern will most likely invalidate the upper trendline as it breaks it and crosses over then moved in an upward orientation. This pattern is a bullish pattern.
It shows that sellers have been unable to drag the price lower as the price keeps finishing at a low point which is higher than the previous low showing great buying potentials which might eventually break the opposition of the sellers by breaching the upper trendline which is the resistance point of the sellers. This shows a continuation of the upward rally that has been going on over the past periods.
Descending Triangle
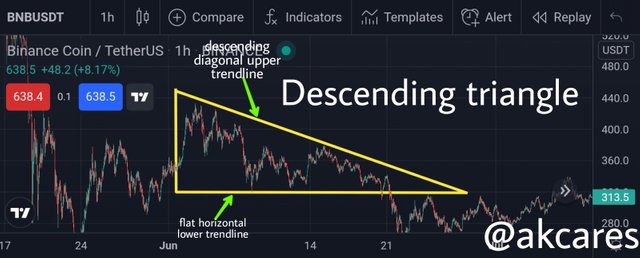
This triangle is formed with an almost flat and horizontal downward trendline which connects low points that are at similar levels. This almost horizontal lower trendline serves as a support level. The upper trendline comes descending downwards as it connects lower high points.
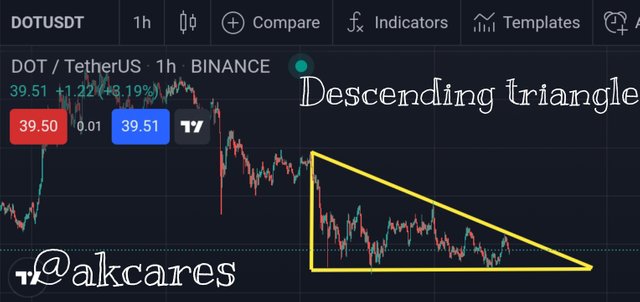
This is a bearish triangle as the price breaks the lower trendline and moves in a downward orientation. This pattern shows that buyers have been attempting to pull the price up but each time, their strength is overshadowed by the selling pressures as the price keeps going down and closing and making high points that cannot go higher than the previous highs, showing that sellers are controlling the market and might take over subsequently be crossing over the down trendline which is the point of support by buyers. This shows an continuation of the downward rally that has been going on over the past periods.
It is worthy of note that the price does not always breakout in the direction of the prevailing trend in an ascending or descending triangle. Sometimes, the resistance level or the support level respectively, could be so strong that the price momentum is unable to bypass or breach it. In this case, the price will likely reverse to the other side and may breakout on that side.
Can we also use some Indicators along with it Triangle Patterns? Explain with Screenshots.
I am of the opinion that technical indicators can be applied along with triangle patterns. This combination will help a trader attain more confluences and confirmations for his analysis before taking a trade.
In my own anaysis, I chose to make use of the relative strength index and the average directional index in combination with the triangle pattern. I will show how I used this in the chart below.
The relative strength index (RSI) is a technical indicator which falls in the class of osscilators.
The basic indication are areas of overbought and oversold. In its calibration, from 0 to 30 indicates oversold zone while from 70 to 100 represents the overbought zone when price approaches these zones, it can either get reversed If the resistance level at that point is strong enough or it can remain in the region if the strength of the buyers or sellers is strong and sustainable enough.
The average directional index (ADX) is an indicator that signifies how strong the current trend is. A strong trend here can be either a bearish or a bullish trend. Once the indicator line is above 50, it indicates a strong trend. If the price is below the 50 mark indicator line, the trend is weak. A strong trend is very likely to continue while a weak trend is prone to reverse.
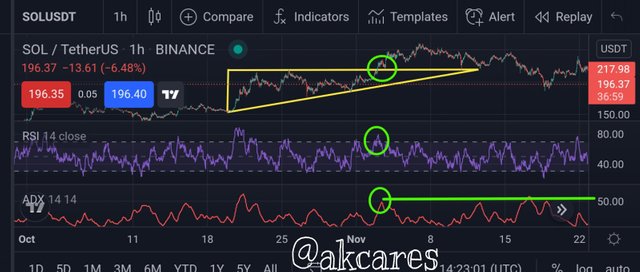
How these indicators are used with the triangle pattern is that when the price approaches either of the trendlines, a trader can look out for opportunities to take a trade or close a current position depending on the signal.
If the price is close to the trendline and it is in an overbought or oversold region as shown by the RSI, then the trend is a strong trend as shown by the ADX, there is high probability that the price will breach the trendline and cross over. A trader can take a trade in the direction of the breakout.
If the price approaches the trendlines but is not in an overbought or oversold region and the trend is a weak one, it means the price will not breakout of the triangle pattern. If the price is in an overbought or oversold region but it is a weak trend, the price will most likely hit the trendline which could be a support or resistance level and reverse.
In the screenshot above, as the price approached the upper trendline, the RSI indicator showed that it was in an overbought region, but since the trend was a strong one as it was above the 50 point mark in the ADX indicator, it was able to breach the trendline and breakout. Here, a trader should take a long trade.
This is how I used the indicators with the triangle pattern.
Explain Flags in Trading in your own words and provide screenshots of both Bull Flag and Bear Flag.
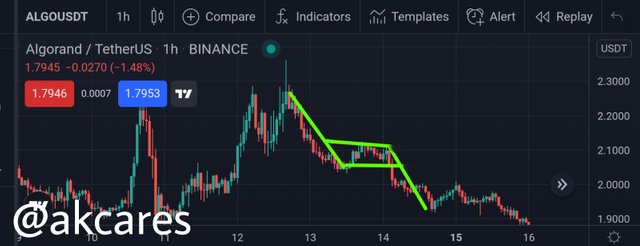
Flag pattern is another interesting chart pattern thar many traders make use of to determine trading decisions. A flag pattern looks just as the name tells, it resembles a flag. It has long impulsive move and an area of consolidation which has short upward and downward movement.
The flag is formed by a sharp extensive move which represents the leg and then a low momentum area on the tip of this impulsive move. Flags indicate areas of strong compression or consolidation which signifies a counter-trend move that follows a sharp directional movement in price.
The area of consolidation is marked by an upper trendline and a lower trendline which are in a parallel orientation. These parallel lines can be pointing in a particular direction or be horizontal and flat. One key condition with flag patterns is that the bottom of the flag should not go beyond the midpoint of the flagpole. On most occasions, flag patterns are usually a continuation pattern.
Flag pattern can give a bullish signal or a bearish signal depending on the formation it appears on the chart. Some components of the flag pattern include:
- Preceding trend (The Flag Pole)
This is the beginning of the pattern. Is is created by a significant impulsive rally.
- Consolidation channel (The Flag)
This is the resting phase of this pattern. Here there is a reduction in the momentum carried by the impulsive move. The drivers of the love decide to hold on their activities.
- Breakout (The Continuation)
This is a resumption phase as price once again proceeds in the initial direction of the impulse. This depicts the entrance of new traders and investors into the market and their push to reestablish the previously prevailing market condition.
There are two types of flag patterns. Both of the them have the same components and characteristics. However, the difference is that one is the opposite of the other. The direction taken by one is in an inverse orientation to the other. The two types are bullish and the bearish flag pattern.
Bullish Flag Pattern
This pattern signals an upward movement in price. It shows that buyers are those driving the market. Here, the flagpole is made by an initial bullish impulse. Thereafter, is a period of consolidation which is marked by two closely placed upper and lower trendlines.
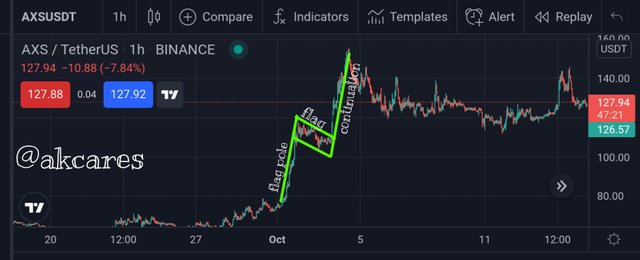
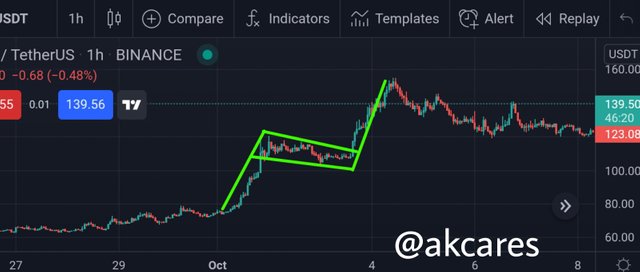
After this is the continuation which is signalled by and breakout of the upper trendline to the upward direction. This way, the initial upward rally of price is resumed after the period of consolidation.
Bearish Flag Pattern
This being bearish shows that the price of the asset is going down and that sellers are the ones in control of the market. This is the direct opposite of the bullish flag. The pole of this this pattern is formed by a long and sharp bearish impulse.
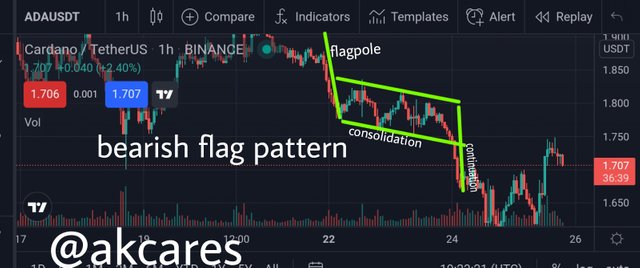
This is followed by a period of consolidation where price repeatedly bounces off the upper and lower trendlines which are drawn closely parallel to each other.
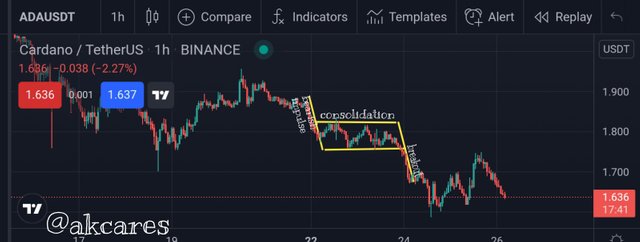
The consolidation then terminates with the price breaking the down trendline and going back downwards which was the initial direction of the market.
Show a full trade setup using these Patterns on any Cryptocurrency chart. (Ascending Triangle, Symmetrical Triangle, Bear Flag)
ASCENDING TRIANGLE
To trade this pattern, I first studied the chart to be able to identify it. After identification and marking it out, I was able to figure out the initial trend. In this case, was a rising uptrend. The price then broke out on the upper trendline line.
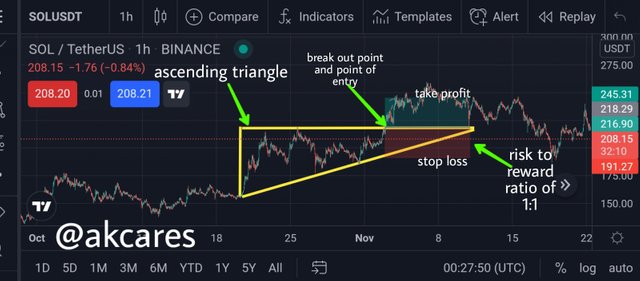
At this breakout point, I took my point of entry of a long trade. I didn't want to be greedy so I used a risk to reward ratio of 1:1. The stop loss was set just below the last low point and the take profit in the opposite direction of equal length. The trade would have obviously been a win trade considering the behavior of the price afterwards.
SYMMETRICAL TRIANGLE
I also, looked closely at this market price chart, identified and marked out the pattern. In a symmetrical triangle, the breakout can be either in the upward or downward direction. The price broke out in the underside so I set up to take a short trade.
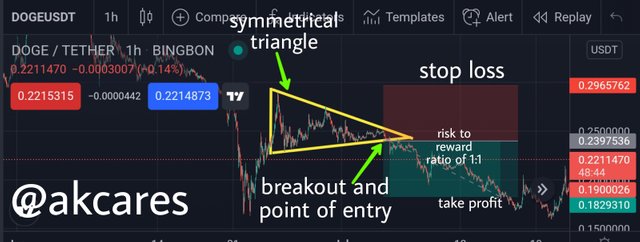
The point of the break was the entry point. Stop loss and take profit was set at ratio of 1:1 with the stop loss placed above at equal distance to the length of the triangle and the take profit placed below at a similar distance. I would have certainly won this trade from the display of the subsequent price action in the chart.
BEARISH FLAG
In trading the bearish flag pattern, the first thing as usual was to identify and mark out the pattern which I did. I then followed it till the point of continuation (breakout) after the period of consolidation.
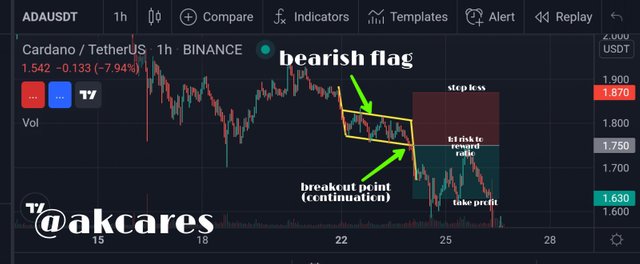
At this point, the breakout was to the underside, so this breakout point marked the entry point. I also used a 1:1 risk to reward ratio to set the stop loss and take profit. This trade would have been quite profitable as the price went down catching a lot of pips.
All screenshots for this assignment tasks were obtained from https://www.tradingview.com/
It is a generally accepted fact that the crytopcurrency market is a very.unstable one which has so much risks involved. One cannot be too sure of the outcome of the market. Yet, even in this condition, a trader can position himself favourably to gain from the market by studying and applying some simple chart patterns.
These chart patterns have a way of conveying reliable information about the market situation and impending price action. These patterns follow and indicate certain principles. Among the basic and outstanding ones are the triangle and the flag patterns. Depending on how the parts of these patterns are formed and arranged, they can indicate a bullish or bearish trend.
Considering these patterns, a trader can know when to suspend trading, enter a trade or close trading positions. Since the main aim is to have more win trades than losses, it it wise that a trader commits some time to carefully identify, anaylse and interprete these patterns.
It has been a great experience taking part in the first class of @sachin08 as professor in the Steemit Crypto Academy. Great lesson.
Hi
Good morning
Are you back from NY,
Will you attend service today?
Any well, drop me ur digits bro @akcares
Thanks