Metric Indicators - Crypto Academy / S5W2 - Homework post for pelon53
In my knowledge of the word metric, it is concerned with a system of measurement and calibration. In mathematics it has to do with taking the length of distance and other directional movement.
Now, Prof. @pelon53 has introduced metric indicators to me. Truly, these are uncharted waters for me because I haven't had any idea of this initially. Now, I am well away of some of the instruments used to study cryptocurrencies and also gather some useful data.
Thanks to this lesson, I have explored Puell multiple indicator, stock flow and hash rate indicators. These are primarily connected with mining activities but they hold great significance for traders and investors based in how well the data they give is interpreted. I will move ahead to tackle the assignment questions.

Indicate the current value of the Puell Multiple Indicator of Bitcoin. Perform a technical analysis of the LTC using the Puell Multiple, show screenshots and indicate possible market entries and exits.
This indicator from development was centered on tracking miners reward and its significance to the market that is the buying or selling of a crytopcurrency. Initially, it was created solely for bitcoin. But, progressively, it has taken into consideration other cryptocurrencies. David Puell is that man credited for building this tool.
This indicator is computed by dividing the daily issuance value of bitcoins (in USD) by the 365-day moving average of daily issuance value. This can be adjusted to fit any other type of coins.
It is used to estimate the level of selling pressure present in the market which is influenced by miners as the market value of the mining rewards changes from time to time depending on the value of the coin. Depending on the value of the asset, miners experience different emotions and pressures about selling off their rewards.
The indicator band has three sections. The top red band, the middle white band and the bottom green band. The band is calibrated from 0 to 10. 0 to 0.5 is the area of the green band which shows that miners have low profitability. This is a point where investors can take the initiative to buy the coin.
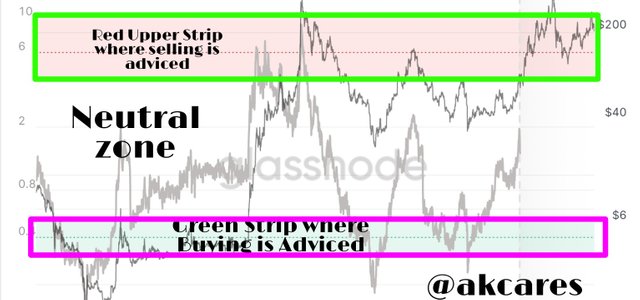
The middle band begins fro. 0.5 to 4 and it is a neutral ground, showing no definite action from miners. From 4 up to 10 is the red band which indicates high returns for miners. Investors benefit from this situation by selling their assets.
If the Puell multiple has a high value, it indicates that there is not much desire by miners to sell off their rewards. Low Puell multiple value suggests that there is significant sell pressure among miners. Miners decision to sell or hold their rewards can affect greatly what will happen in the market of an asset.
This is what this indicator is about.
Current Bitcoin Value of the Puell Multiple Indicator of Bitcoin
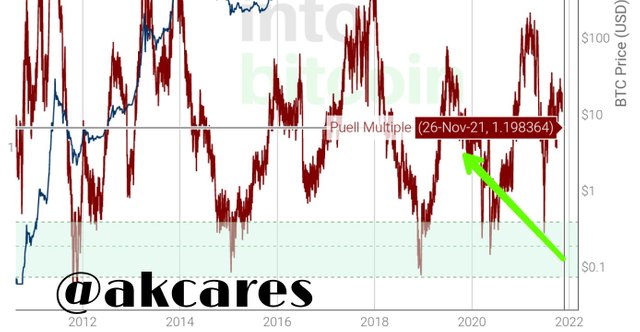
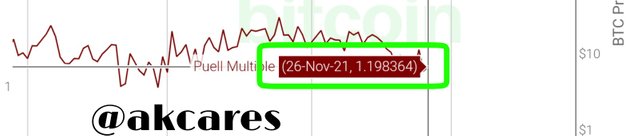
According to the indicator, the current bitcoin value is 1.198364 given as at 26 November, 2021.
To access this indicator, I visited https://studio.glassnode.com. I had to first sign up. I imputed my details including my email and picked a password. I was redirected to my email in order to undergo verification. This I did successfully.

Afterwards I was taken back to the login page where I was able to log in and navigate the site.
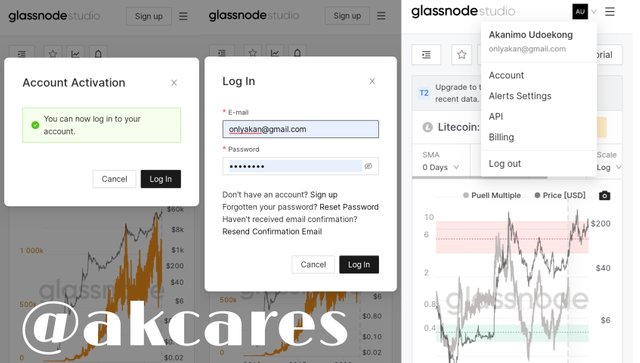
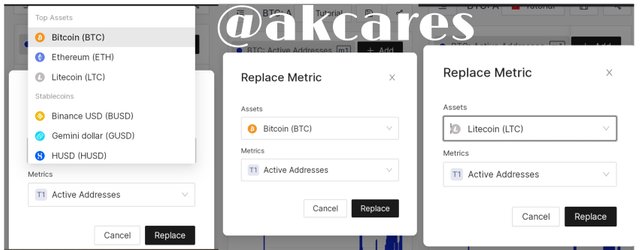
The chart that was shown was for bitcoin so I went ahead to find the Litecoin chart for this analysis.
Technical analysis of the LTC using the Puell Multiple
As I have stated above, the indicator can be used to study other coins apart from bitcoin. In this case, I want to look at what the Litecoin trajectory looks like using this indicator.
From the charts, it shows that miners have had to deal with low profitability from mining than high profitability of the years. In the last 7 years of Litecoin existence from 2014, just twice has the indicator been in the red upper strip. That was in May and in December 2017 and these two periods did not have much length in time.
On the other hand, the coin has dwelt in the lower strip of low profitability for a greater number of times and it always take longer durations when in this zone.
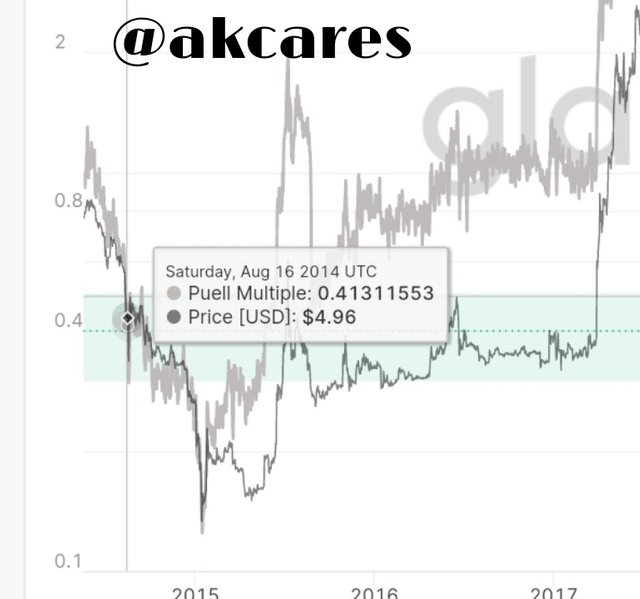
Also, the value of the indicator for this coin has fallen quite deeper than it has risen. The value had reached a low point of $1.43 in price and 0.17164625 in Puell Multiple value in January 2015. When it first entered, it stayed for a while year from August 2014 to July 2015.
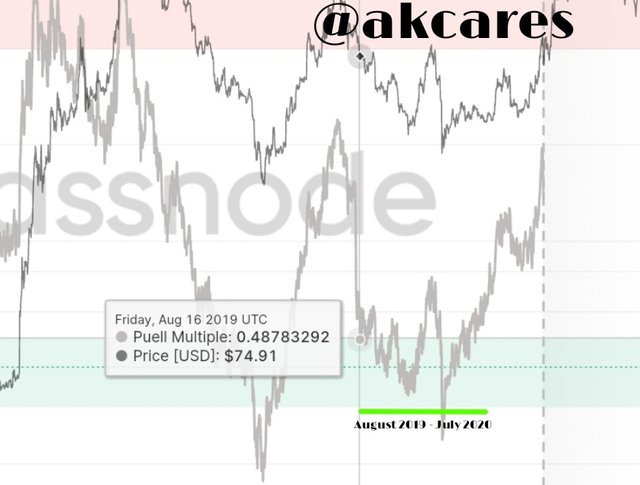
Most recent of this indicator signal was when in entered the green lower strip in August, 2019 and hung down there till May, 2020. It has since climbed out into the neutral zone. The indicator does not have any lastest indication for litecoin. The last point it moved to was towards the ending of 2020.
Looking at the indicator and from what I know about its signal, the best time to enter a trade is when the indicator line has crossed into either the red or the green strip. It is best for a trader or an investor to easily close positions once the indicator begins to move into the neutral zone as there in no clear indication.
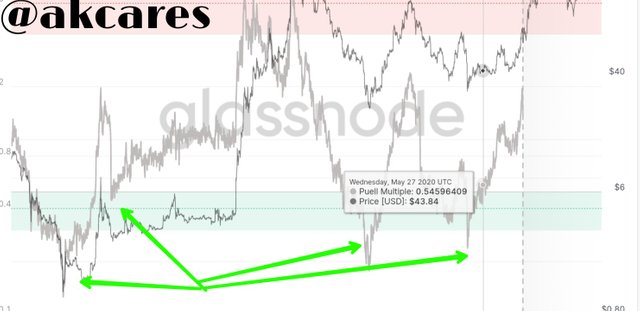
For example, taking into consideration the chart below. The indicator dropped into the green strip below 0.5. A trader would do well to look out for buying opportunities from this point, that is he should enter a long trade. After the duration of this move and price moves out into the neutral zone, the point of moving out should signal exit for a trade to close any buying position.
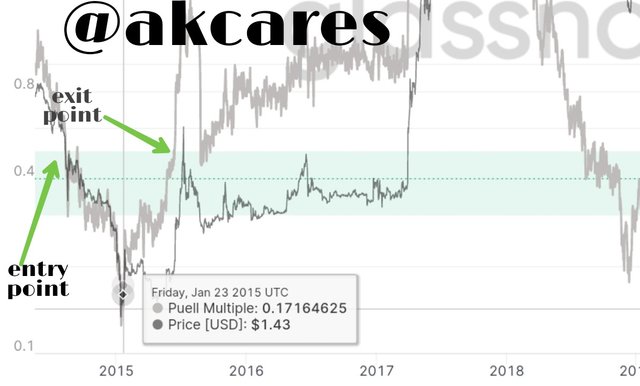
It can be seen that the price at which the indicator reached the green zone is quite low. It is during this period that the price gets to $1.43. At the exit point, the price had began to rise.
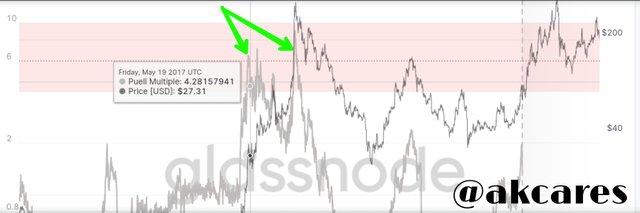
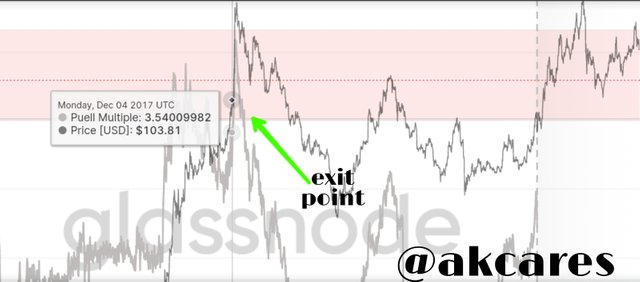
Exiting from this point, a trader can enter a sell trade as the price entered the red strip.
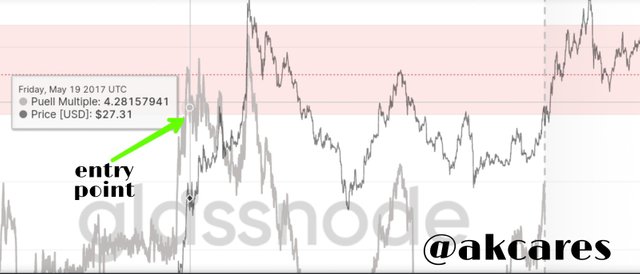
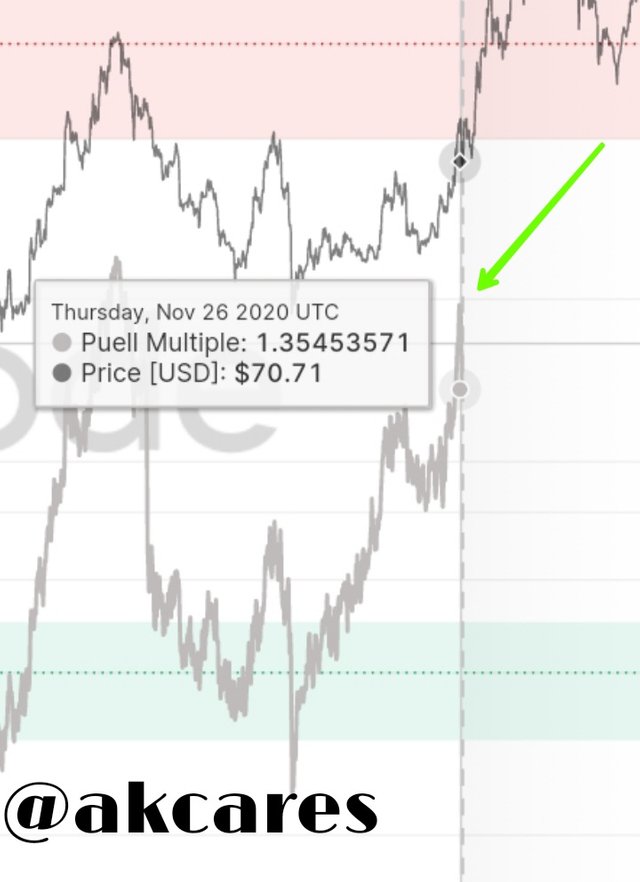
Here the price has risen to $27.31 and will increase up to $103.81. An investor or trader who had bought the coin at $1.43 would have made excess profit at this level. He should be mindful to close the short position and take profit once the indicator line moves away from this red strip zone.
All the screenshots in this question were taken from the same Source.
Explain in your own words what Halving is, how important Halving is and what are the next reward values that miners will have. When would the last Halving be. Regarding Bitcoin
Halving
Bitcoin halving is the process whereby the rewards for successfully mining a block and adding it to the blockchain is being reduced by half after a certain number of blocks have been mined over a period of time. Bitcoin halving is a precautionary mechanism used to check inflation and maintain the value of Bitcoin by preventing excess flow and reducing the amount in circulation.
This is done by reducing the amount of newly mined coins produced after new blocks have been mined and this is done following a rule. The rule is that, after every 210,000 blocks of Bitcoin, a halving process takes place which involves slashing the reward for mining a block by half its initial value. This seems to take place after every four years considering that it takes about 10 minutes for a singular bitcoin block to be mined.
Till date, Bitcoin has been halved three times. The first halving took place on November. 28, 2012. The second halving was on July 9, 2016. The third and the latest one was on May 11, 2020 at about 3 p.m.
The next expected halving will happen on block 840,000. The estimated date for this is in early 2024, speculated to be on Thursday, 9th May, 2024. Some other predictions put it between February and June of 2024.
Bitcoin was first Halved when 10,500,000.00 BTC had been mined. Prior to this, the mining reward was 50 BTC. So the reward was halved to 25 BTC.
The second halving occured after 5,250,000.00 BTC had been mined to make a total of 15,750,000.00 BTC. Here, the reward for the mined blocks was 12.5 BTC. After the third mining, the mining reward reduced 6.25 BTC. This was after 2,625,000.00 BTC had been added to the previous total, making it 18,375,000.00 BTC.
Importance of Halving
This process of halving was well conceived not by accident. It was a conscious mechanism built into the bitcoin blockcain by a developed protocol. This is because the developer had some benefits and advantages in mind before inserting this protocol. The Importance of halving include:
- Preserving Value of Bitcoin
By making the requirements to mine the coin more and more difficult with each halving and also reducing the rewards, the value of bitcoin is preserved. The quantity in circulation is kept in check. This ensures that currency is not oversupplied making it to be relatively scare. With scarcity, demand will increase which will help to build the value of the coin. The inflation rate of bitcoin is also greatly kept in check through this halving process.
- Reduction in Network Fees
With the slashed rewards, the network fees also get reduced. Reduction in network fees is a good thing which will attract individuals to the coin.
- Improved Security
By using proof of work (PoS) to mine, it means that more computing power is needed and bitcon gets halved each time. This additional computing infrastructure boast the security and efficiency of the bitcoin blockchain making it less prone to malicious attacks and frauds.
- Increases Stability
With lesser rewards from mining, miners cannot control excessive units of bitcoin with which they can use to cause and influence major shifts I'm the market. It reduces the tendencies of miners becoming wales who could push the price and juggle it to their favour.
Next reward values that miners will have
Next possible halving will be the fourth and it is to take place at block 840,000 (210,000 × 4)
With the current block height of 711510, it means that 128,490 more blocks are to be mined before this halving occurs.
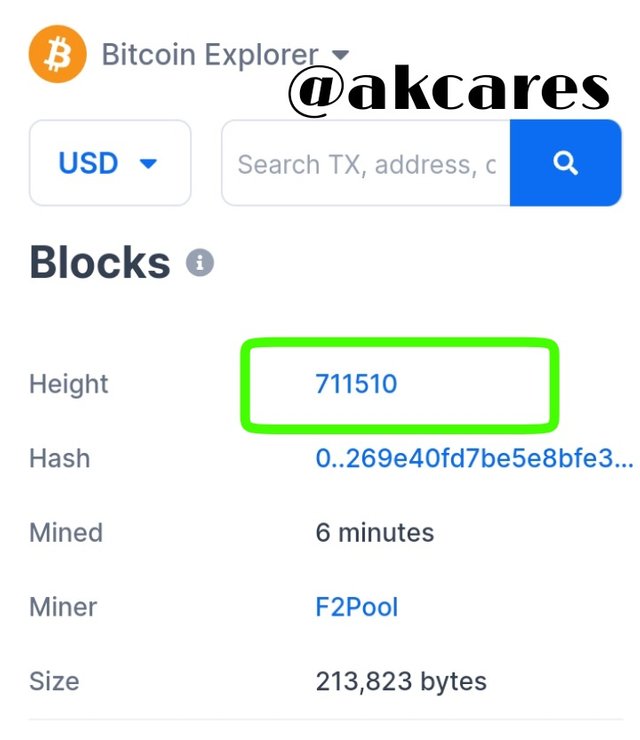
This will bring the mining reward to 3.125 BTC per mined block.
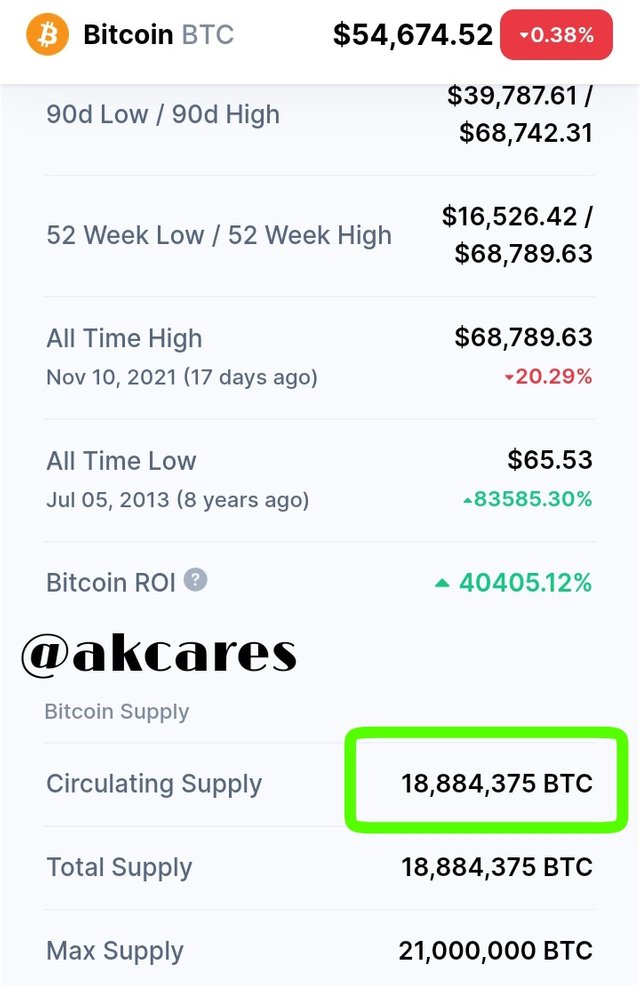
Bitcoin is at 18,884,375 BTC in current circulating supply. That is 89.93% of the total fixed supply of 21,000,000 which is estimated to be attained in 2140.
In the chart below, after carrying out the calculations, I have tabulated the number of halving, the expected year of the halving, the block at which it will occur, the mining rewards and the number of bitcoin that will be added after each halving up to the 20th time.
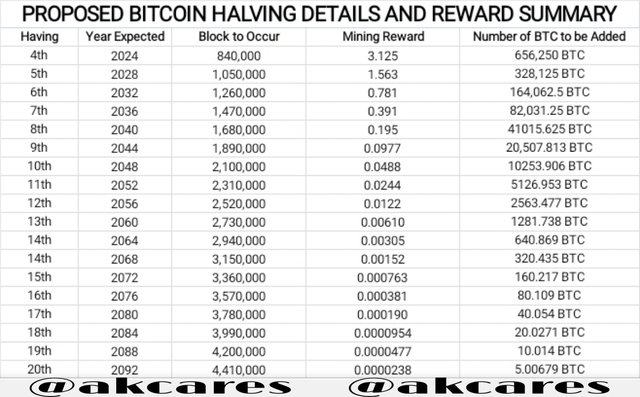
This was prepared on WPS Spreadsheet.
Analyze the Hash Rate indicator, using Ethereum. Indicate the current value of the Hash Rate. Show screenshots.
The rate is simply a representation of the computing power required to produce a block in a blockchain over a particular length of time. Is shows the number of computing nodes and energy that mining a block demands. This concept has some peculiarity to blockchain networks that make use of proof of work (PoS) as their consensus mechanism.
The hash rate indicator is very useful because it has a correlation with how the price of an asset will behave. If a blockchain requires so much computing power in order to produce a block, it implies that the coins mined will have high value and increase in price. Thus, the hash rate is directly proportional to the price.
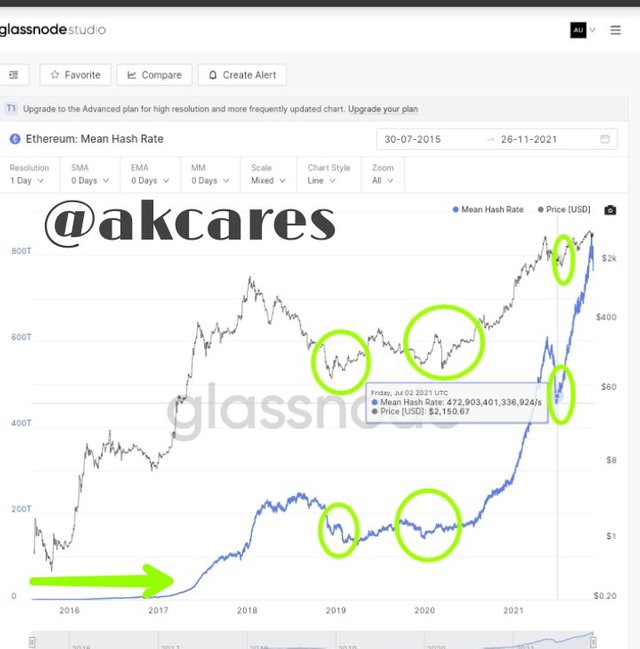
From the screenshot above, the graph shows a hash rate that has been on a rise for a significant length of time. From the graph, it can be seen that price had no relation with the hash rate initially from the period of between July, 2015 till begining of January, 2017.
However, from this period there is a proportional relationship between the price and the hash rate. As the has rate increases, price also increases and as it decreases, price equally decreases. Generally, from the graph, it is seen that the hash rate has been on the rise since this period.
This aligns well with the fact that the price of Ethereum has steadily been increasing even though there have been very minor retracement from time to time. Increasing interest in earning mining results globally have obviously been key to this rising hash rate as the difficult of mining a block becomes raised with every successfully mined block.
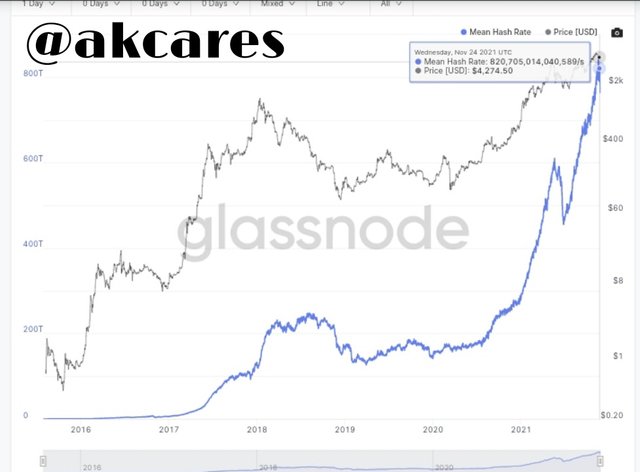
The current hash rate shown on the Source I used is 820,705,014,040,589/s. This was given as at 24th November, 2021.
A conspicous area of depression is noticed
somewhere in July 2021 on the indicator. This is a period where the hash rate was drastically reduced. This is attributed to the systemic shutdown of graphics card mines in China.
This implies that GPU mining in China, where the bulk of the world's graphics card mines were situated, were not functioning as they used to. This area is also spotted on that indicator chart for bitcoin ans other major cryptocurrencies as the government went all out to halt their operation in the country.
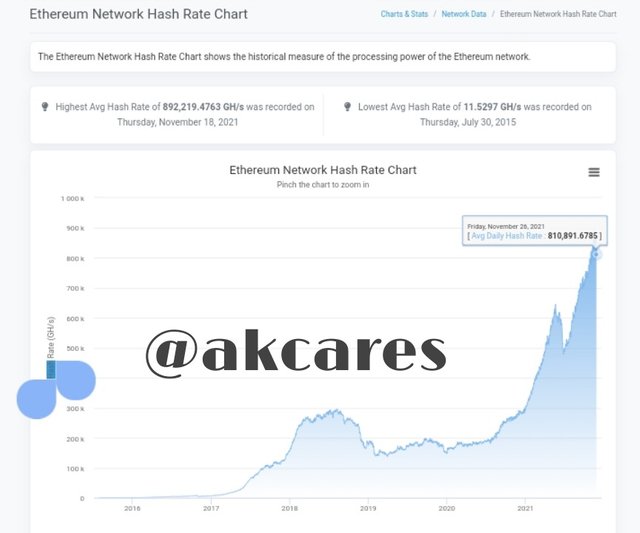
On Ethereum block explorer etherscan.io, the hash rate as at 26 November, 2021 is 810,891.6785 Gh/s
Calculate the current Stock to flow model. Explain what should happen in the next Halving with the Stock to Flow. Calculate the Stock to flow model for that date, taking into account that the miners' reward is reduced by half. Show screenshots. Regarding Bitcoin.
It is not easy for one to lay hand on bitcoin these days whether through mining or purchasing. Any of these means will be very demanding in terms of effort, input and money. This makes bitcon to be a very scare and valuable asset. Thus, stock flow indicator which is designed to indicate how available or abundant these kind of assets are can be used with bitcoin which is equally in very short supply as its total supply has already been fixed.
The stock flow model indicator does not change abruptly for bitcoin. It is fairly stable as significant flow in the bitcoin stock only occurs on a four year bases after each halving.
- Calculation of Current Stock Flow and Stock Flow Model
Stock flow is computed using the formula: SF = Stock / Flow.
Stock represents the existing or reserved quantity and flow represents the units of the assets produced annually.
At the moment, there are 18,884,375 BTC in circulation. So stock = 18,884,375
Annual flow = Reward / block (miners) * Annual block production.
Annual flow = 6.25 BTC / Block * 52,560 Blocks / year
=6.25*52560
=328,500 BTC / Year
SF = 18,884,375 BTC / 328,500 BTC / year
SF = 57.48668
=57.49 (2 s.f)
To get the stock flow model, which is the indicator line, the formula:
Stock to Flow model = 0.4 * SF ^ 3 is used.
Thus,
= 0.4 * SF ^3
=0.4* (57.4957.4957.49)
=0.4*190010.20475
=76004.0819
=76,004.08 (2 s.f) BTC
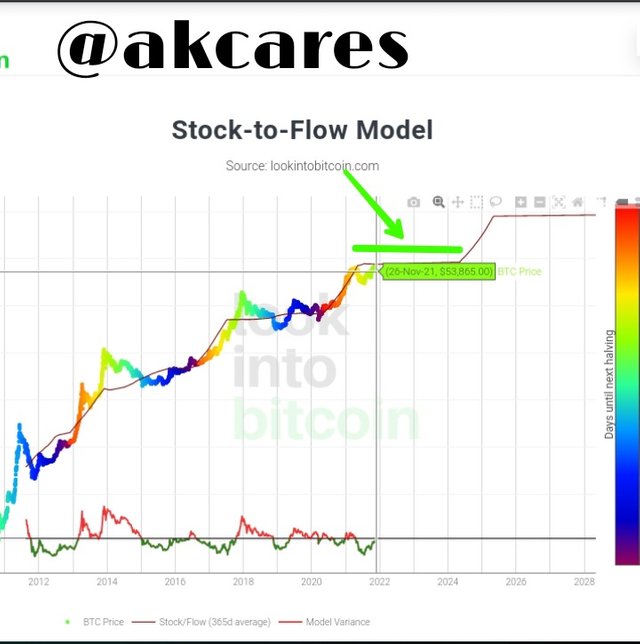
The indicator chart above shows an area of horizontal orientation where no line is flat. This signifies the fact that at the moment, the stock flow is at a steady and constant level. It has not moved because the flow has neither increased or reduced. This will stay like this untill the next halving occurs.
- What should happen in the next Halving with the Stock to Flow
In the next halving, the stock flow value would have increased significantly. From the model of calculating the stock flow, it is shown that the mining rewards is divided by the annual block production. As it is, after the halving, the blockcain reward will be reduced. This means that the flow will be equally reduced. This flow, which is reduced is further used to divide the stock which will obviously be on the increase.
Thus, as the stock value which is on the numerator is going or increase by the next halving, the flow, which is the numerator will be getting smaller. As such, the value of the stock flow will be higher as a larger unit is being shared to a rather small unit. The relationship between the stock and the flow is in opposite direction where as one increases which is the stock, the other is reducing which is the flow.
- Calculation of the Stock to Flow Model at the Time of Halving
SF = Stock / Flow.
Presently, the number is bitcoin in circulation (stock) is 18,884,375 BTC. By 2024, it would have risen to 19,540,625 BTC as as additional 656,250 BTC would have been produced by that time.
So, stock would be = 19,530,625 BTC
Annual flow = Reward / block (miners) * Annual block production
By the next halving, the flow would be calculated using the value of 3.125 as the block reward would have been reduced by half though the annual block production will remain constant at 52,560 blocks annually.
Thus, the flow will be = 3.125*52,560
Flow= 164,250 BTC/year
So stock flow = 19,530,625/16,4250
=118.96879758
= 118.97 ( 2 s.f)
The stock flow model will then be calculated.
Stock to Flow model = 0.4 * SF ^ 3 is used.
= 0.4118.96^3
= 0.41683460.2611
= 673384.10045
= 673,384.1 (2 s.f) BTC
It is seen here that stock flow has increased to more than double its previous value while the stock flow model has a value that has experienced exponential growth.
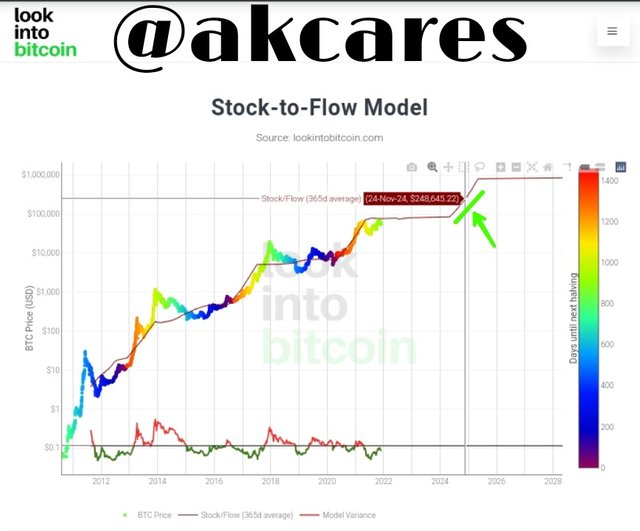
At these region in chart somewhere around 2024, you can see that the indicator line has a strong movement upwards. This is to indicate the increase in the stock flow as calculated above.
The origin of cryptocurrencies is from mining. From Satoshi Nakamoto being successful in mining the bitcon genesis block, the path was cleared for everything crytopcurrency to start trooping in. Thus we see that the process of mining is very important and the actions and activities of miners need to be given due attention.
Market price charts have a barrage of technical indicators developed to assist traders and investors to navigate their way in the market. Thankfully, there are also indicators that help to showcase the forces and influence that miners have in relation to the price of an asset.
Metric indicators serve a wonderful purpose in signalling the potential impact of miners and their mining conditions on price. From the Puell Multiple indicator to the hash rate and stock flow indicators, a lot of information that are very relevant to trade and investment can be obtained.
Carefully taking these information into consideration and taking necessary actions can guarantee greater success for anyone delving into the world or crytopcurrencies and blockchain finance.
Prof. @pelon53 has done a great job on this lesson. Well done sir.
