Crypto Academy / Season 3 / Week 3 - Homework Post for @lenonmc21
This weeks lesson is so educating. I have been greatly enlightened. Thus I will attempt to answer the questions to the best of my ability.

Question 1: Define in your own words what is a "Trend" and trend lines and what is their role in charts?
What is a Trend?
From what I have gathered in the lesson, a trend refers to movement of the market in a particular direction either upward or downward over a specific period of time. It represents a situation where the price or value of a currency gradually increases or reduces over time resulting in noticeable change in price even. Though, during this movement, there may sharp, intermittent correction in the market, however, the general and dominant motion is what determines the type of trend.
So, a trend is simply a dominant, noticeable movement of a crypto currency price either getting higher or becoming lower significantly from the initial price.
Normally, we have two types of trends: bullish trend and bearish trend. These can as well be called uptrend and downtrend respectively.
Uptrend signifies an increase in price of a currency and thus an upward movement and direction implying that the more investors are buying a currency and that the demand is high.
Downtrend signifies decrease in price and value of a crypto currency.
This is indicated by a downward movement and direction in the chart meaning that many persons are selling off their currency units and that this supply of the currency is high while the price is low.
What is a Trend Line?
NOTE: ALL Screenshot charts are taken over a day interval. Meaning all candles represent one day.
Trend lines are straight lines used to indicate and trace the direction of movement of the price of crypto currencies. Trend lines shows how consistent price has been decreasing of increasing as the case may be. Thus, trend lines are lines drawn to map out trends and established their direction. Trend lines are drawn by joining either low or high points in the chart depending on the prevailing market situation.
Uses of Trends and Trend lines in a Chart:
Just as I have learned in the lesson that the trend is my friend, I want to start by saying that:
one use of the trend and trend line is in determining what direction the market is taking. With trend and trend line, it is easy to tell whether the currency is gaining value or losing value.
Trend and trend lines help to detect what market forces are in play. They show how much demand there is for a crypto currency and how much supply of the currency is available. Thus, trends help to indicate the struggle and the power held by buyers and sellers in the market which equally reflects the activities of bulls or bears present in the market.
Trend and trend lines equally aid in determining the strength of investors in the market. It indicates how dominant the players in the market are and the percentage share of the market that they control at a particular time.
Trend and trend lines helps investors determine what kind of trade and investment they should carry out a specific time. It the bulk of investors are selling off their currencies, then one should go with the trend by equally entering a sell trade and vice versa.
Question 2: Explain how to draw an uptrend line and a downtrend line (Show a screenshot of each).
Generally, drawing a trend line basically involved joining different points on a currency chart to show direction.
Drawing an Uptrend Line
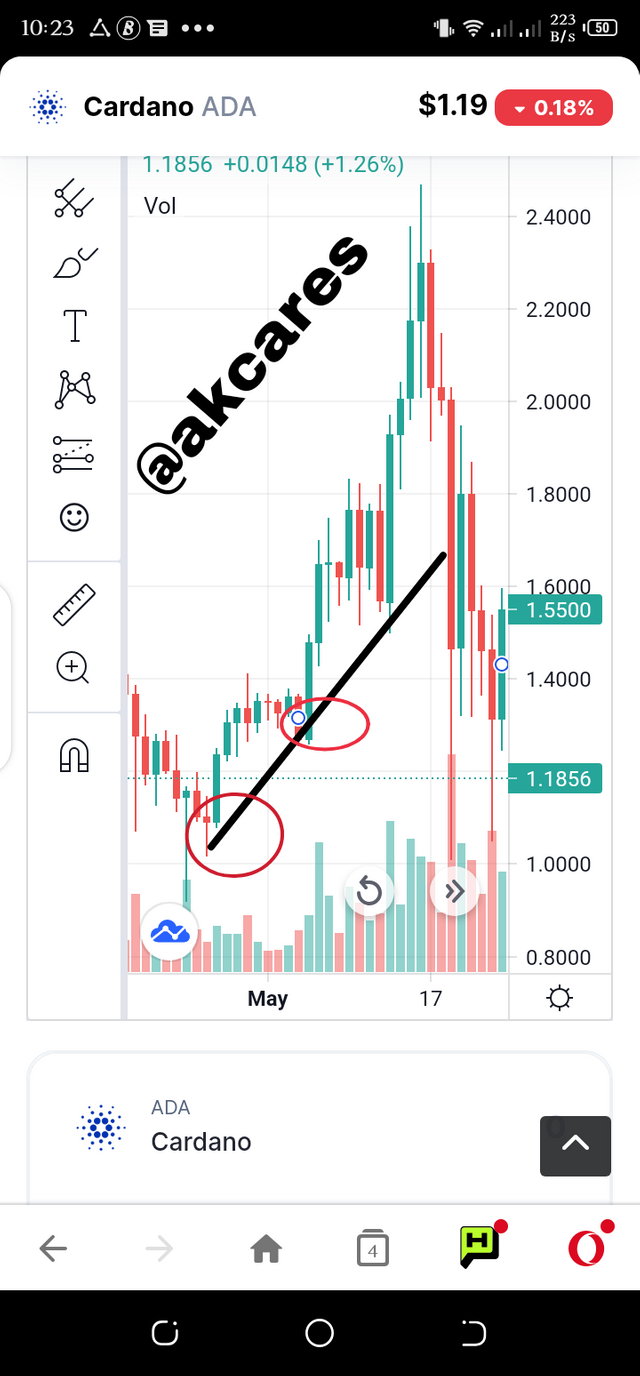
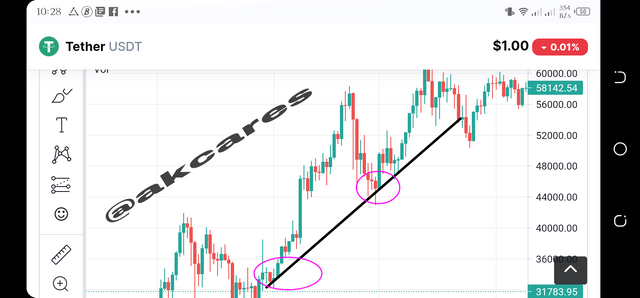
When trying to draw an uptrend line, you begin by finding a suitable chart, then the you start your line from the lowest price point. From this lowest price point, the line joins subsequent low points in the chart as the price keeps going higher amidst the intermittent correction and price correction. So the uptrend line goes from the lowest Price point and joins other low price points as the price keeps increasing until the end of the trend. Here, the line joins all the low points on the chart as the price climbs.
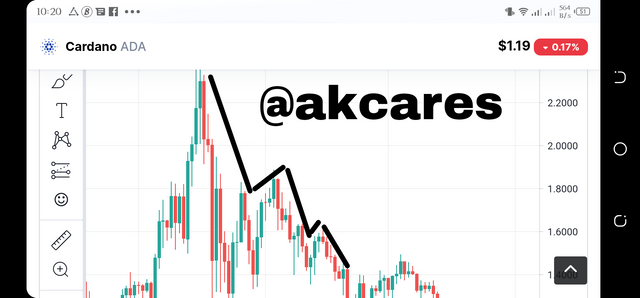
Drawing a Downtrend Line
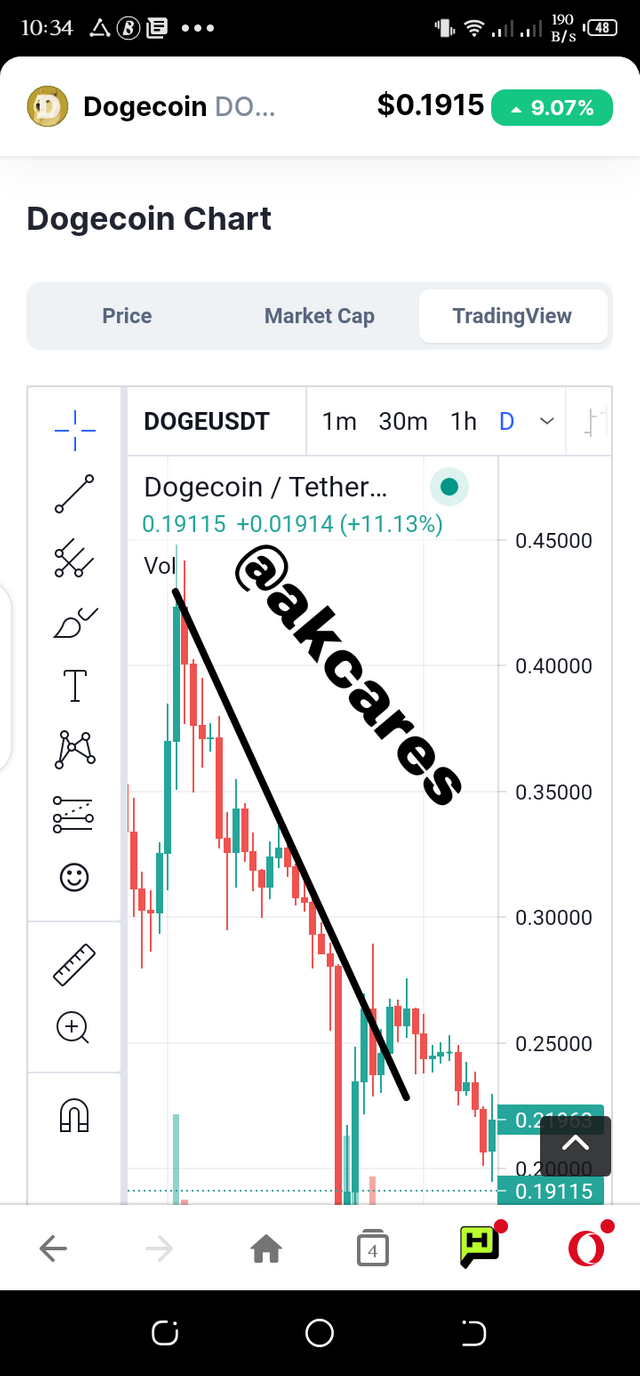
Down trend lines are drawn also to indicate the overall drop in value and price of a crypto currency. To draw this line, the highest price point of the currency, from where the price begins to fall is joined in a straight line to other high price points in the charts as the price keeps going down until the end of the trend. Here, the lines joins all the high points in as the trend goes down and the price depreciates.
Question 3: Define in your own words what "Supports and Resistances are and how we can identify both zones (Show a screenshot of each one).
Support and resistance generally represent refers to conditions of repeated and similar opposition to price movement either in a downward direction or in an upward direction respectively.
Support
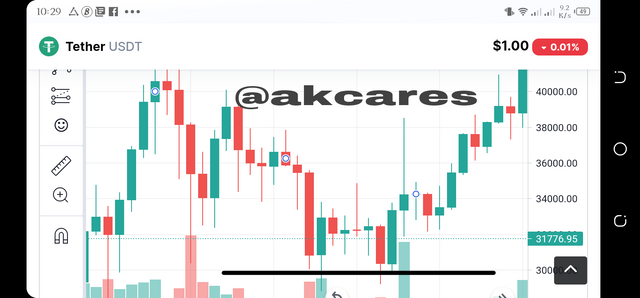
This can be defined as the tendency of the price of a currency to always reverse and begin to increase once it has reached a certain low point more than once in a particular chart over a period of time. Support refers to the condition whereby the price of a currency does not fall or depreciate below a particular price range which occurs repeatedly in a market chart such that once the downtrend reaches that point, it begins to reverse and go up.
Resistance
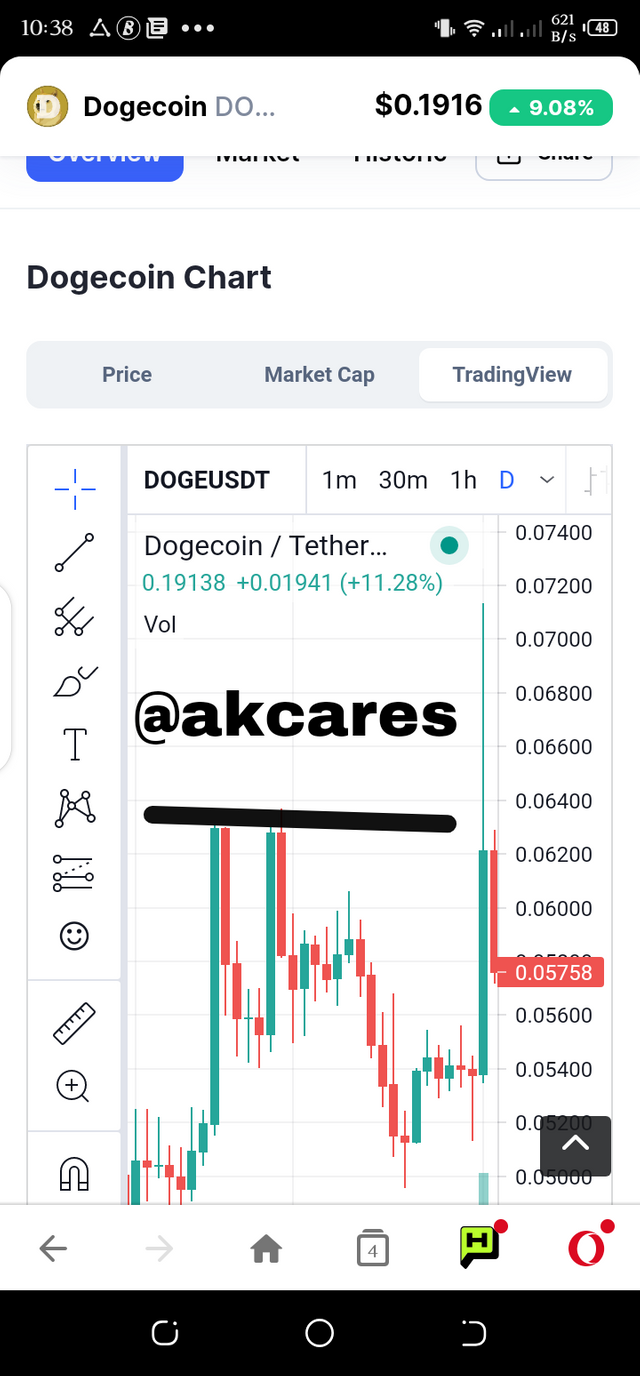
This is the opposition offered by market forces which tends to keep the price of a crypto currency from climbing past a particular range successively in a market chart. Resistance is said to occur once an uptrend reverses more than once anytime it goes up to a certain high point. In a resistance situation, there is a kind of upper price threshold whereby an uptrend retraces more than once over a period of time. It represent attempts by bears to prevent the price from going past a particular high point repeatedly.
How to Identify Zones of Support and Resistance
In trying to identify zones of support and resistance on a chart, one need to simply make keen observation and analysis of a chart. One needs to be on the look out for the point whereby the trend got reversed and note this point when the trend appears to be in a similar motion so as to see if it will reverse again at that same point or close to it.
To check out for a support, one needs to observe a downtrend and see where the price ceased going down and began climbing. You should note this point in the next occurring downtrend to see if the trend will also reverse at or close to this this point. If there is a repetition of the first pattern, then it is most likely that that is a support incidence.
To identify a resistance, you locate an uptrend, study it up to the point where it climax and begin going down. Follow this trend to the point where it begins to climb again. If the trend reverses, that is the price begins to fall at the same point or close to the same point as the penultimate trend, then this is an indication of a resistance.
Question 4: Explain in your own words at least 2 simple chart patterns with screenshots.
Simple charts refer to those recognizable chart patterns the usually occur on the chart. They are those patterns that form certain distinct shapes or structures on the chart.
Some of these simple charts or what is otherwise called chartism or chart patterns include:
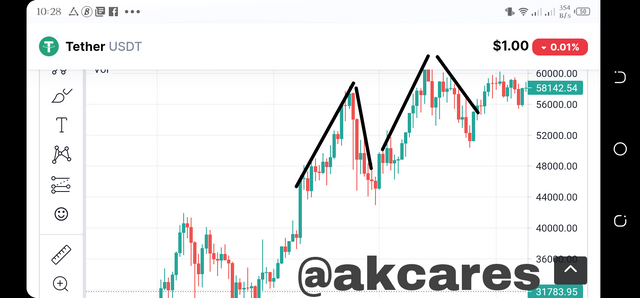
Double Top
This occur when there are consecutive and repeating positions of resistance. It occurs when a bullish trade reaches its peak and is followed by another bullish trade which just reaches this point and begins to recede. This usually indicate a potential reversal in trend. This dual occurring peak points is referred to as double roof.
Double Floor
This is similar to the double top. However, this is in the opposite direction. Here a bearish trade having been supported takes another down trend and reaches the initial low, thereby resulting in two consecutive low points which forms what is termed double floor.
Conclusion
I believe that trend represent one of the most basic technical analysis tool for crypto currency charts. Proper understanding of trends and adequate tracing of trend lines helps to facilitate proper investment and placement of trade in the market. Thus, it is wise and quite necessary that all crypto inclined persons have knowledge of these concepts.
Through my research for this assignment, I have come to identify some of these special features meaning that they are applicable and relevant in the crypto world.
start success go! go! go!