Basic trading strategy using the Harmonic pattern AB=CD + Fibonacci by @akcares - Steemit Crypto Academy / S4W2- Homework Post for Prof. @lenonmc21
Although the market price chart of cryptocurrencies and other blockchain securities can be very dynamic and volatile, there are still some regular patterns that can be spotted within the charts. Over time, many traders have been frustrated out of the market because of unsuccessful attempts to locate price patterns and accurately predict price direction.
Understandably, price charts are not that easy to understand. There are just too much information stuffed within a singular chart with a lot of signals to look out for. From judging the anatomy of candlesticks to studying price action to locating areas of support and resistance, the market price chart can confuse any amateur trader.

However, with a little diligent study and practice, one can begin to appreciate the market more. There are already discovered and certified patterns that exits on price charts. One of these is the AB = CD pattern created by Larry Pesavento and Scott Carney, though being initially discovered by H.M Gartley who invented Gartley harmonic pattern. Harmonic patterns came into existence in the year 1935.
Thus, any trader or investor who is equipped with the knowledge of this pattern can easily apply it to trade the market favourably in combination with other vital market analysis tools. Due regards go to Prof. @lenonmc21 who has explained this lesson clearly to us. I will therefore make an attempt to answer the home work questions below.

Question One: Define in Your Own Words What Harmonic Trading is?
Harmonic trading is a trading strategy which basis trading decisions on Fibonacci numbers and retracements as Indicators and signals. This is a kind of trading using price patterns that are formed on market charts in conjunction with some specific levels. Thus, the psychology behind harmonic trading is that market price behavior and other conditions are relative and follow a certain cycle and sequence.
Question Two: Define and Explain what the Pattern AB = CD is and How can We Identify it?
The AB = CD pattern is a harmonic trading pattern comprising four points made up of three market price swing movements. It is described as the simplest and basis harmonic pattern from which all other harmonic patterns are obtained from. The two exterior lines ("AB", "CD") are described as legs while the middle line ("BC") is called a retracement or correction.
In the AB=CD pattern, CD has similar length as AB implying that it takes the market equal time to travel from A to B as from C to D. The lines AB and CD have similar angle.
The AB = CD pattern was given better description when Scott M. Carney, one of those that popularized the pattern, refined it pattern by assigning new elements and specific Fibonacci ratios to confirm and authwnticate the formation.
Anatomy of AB = CD Pattern
Point "A" is where the pattern begins. It then gets to point "B" which denotes the first direction of movement. .
Afterwards, point "C" is reached which is a retracement of line "AB" or "AB" leg. This retracing point is marked at 61.8% of Fibonnaci ratio. This implies and return movement of the price from point "B" to point "A" at 61.8% retracement of line "AB".
The price the ln continues in the same direction as line "AB" till it gets to point "D".
Line "CD" usually have similar length as line "AB" though point "D" will be at 127.2% extenaion of line "BC".
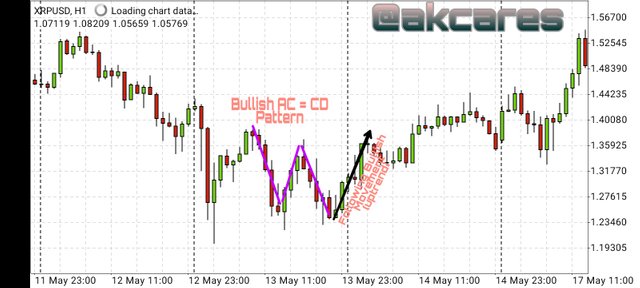
Description of a Bullish AB = CD Pattern
A bullish AB = CD harmonic pattern happens and is spotted on the market when the price is moving down and has strong potentials to reverse.

AB = CD pattern usually indicate when the market will reverse by forming point "S" on the chart which is usually lower than the three other points on the pattern.
To be able to tell if an AB = CD pattern is a perfect bullish pattern, such a pattern will have line "AB" being equal to line "CD". Line "BC" will have to retrace about 0.618 of line "AB". Line "CD" will have to end at the 1.618 level of line "BC". Also, there has to be equal time taken for lines "AB" and "CD" to form. This best characterizes a perfect bullish AB = CD harmonic pattern.
Description of a Bearish AB = CD Pattern
Equally to get a perfect bearish AB = CD pattern, such a pattern needs to have the same indices as specified above.
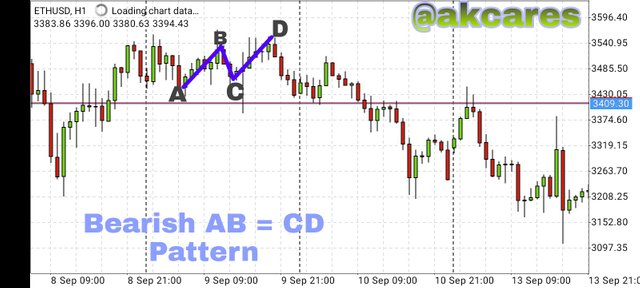
A bearish AB = CD harmonic patterns is formed on the market price chart when the price moves up and then shows signs of reversal.
The AB =CD pattern will indicate when the market price will reverse when point "D" is formed on the chart. Point "D" is formed above the three other points in the pattern.
Equal time of duration for AB and CD which could be easily judged using the number of candlesticks formed along the lines.
Question Three: Clearly Describe the Entry and Exit Criteria for both Buying and Selling Using the AB = CD Pattern?
When using the AB = CD pattern as a trading strategy, the point to enter a buy trade or order is when the last leg lands on a lower price and shows potential to reverse. When the price moves up again close to a reversal point, you can exit the buy trade.
That is buy order is best placed when the "CD" line has gone beyond point "B" on the pattern at point "D" and reverses. Then the order is closed when the line comes up close to point "C" and shows signs of ending. As shown below.
A sell trade is best when the last leg "CD" coming from down to up reaches a high point and shows sign of reversing. At this point you can take a sell trade which you close once the price has gone way down and also begins to reverse.
That is, a sell trade is ok placed at the point "D" when the "CD" line is has gone up past point "B" and begins to reverse. The trade closed when movement has gone close to point "C" and starts retracing as shown below.

For this AB = CD trading strategy, it is always advised to enter the trade only after point "D" has been reached. Also, a reversal candlestick patter should be used at this point to mark the market entry.
Question Four (Practical): Make 2 Wntries (Up and Down) on any Cryptocurrency Pair Using the AB = CD Pattern Confirming it with Fibonacci
I will taking a short and long trade.
The first trade I want to enter below is a sell trade on the Steem/TetherUS currency pair.
Having spotted a harmonic pattern, in this case a bearish one. I was able to find the two legs "AB* and "CD".
At point"D", which is the point of interest at which the trend usually reverses, I checked for potential reversal signals and cues to enter a trade.
In this particular case, I was able to find and inverter hammer which indicated serious opposition to buyers and a tally by sellers to control the market. At the same time, there was a long bearish engulfing candlestick.
These two reasons gave me the idea to take a sell trade with a loss to profit ratio of 1:1 as shown below.

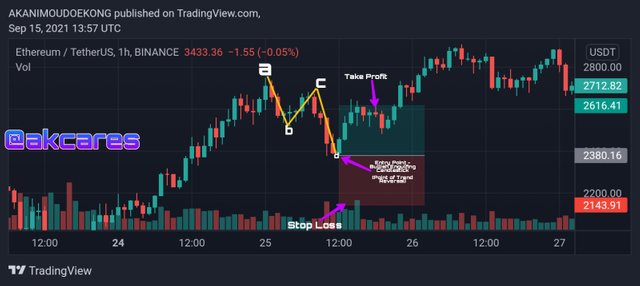
This is my second entry into the market. Here, the pair Ethereum/TetherUS. It was a buy trade.
The AB = CD pattern was spotted in a bullish orientation.
The "AB" and "CD" legs going in the same direction from top to bottom with later being a little below the former.
I looked out for signals to take the trade at point"D" where I anticipated a possible trend reversal.
Thus, at point "D", I got a bullish signal. In this case, a bullish engulfing candlestick stick was formed.
This served as my entry signal. I took the trade at the loss to profit ratio of 1:1 as shown in the screenshot below.
The major point about trading this pattern is first being able to accurately identify the pattern. From here, one need to pay close attention to point "D" so as to detect and reversal and a viable entry signal.
The discovery of harmonic patterns which harald the surge in other chart patterns has been a real blessing to cryptocurrency traders. Interestingly, traders are now using this patterns to enhance their chances of making success.
Instead of having to aimlessly comb through numerous rows of cryptocurrency price charts, one can easily look out for these harmonic patterns which could serve as guide for making good trading decisions.
Adopting harmonic trading strategy offers more confidence and better prospects compared to entering the market blindly. One popular harmonic pattern is the AB = CD pattern which is like the progenitor of all other harmonic patterns. The cryptocurrency market tends to obey some principles and respect some patterns.
Though these patterns have high probabilities, they do not always follow through on all occasions. In some instances, these patterns have been altered or totally broken. Thus, a trader needs to trade with some high risk management strategies like setting protective stop losses and also seek confirmation from other sources.
Once a pattern obeys most of the conditions, then such a trade can be conveniently entered with some level of certainty. However, one need to be mindful and careful in identification these harmonic patterns because wrong identification may lead to catastrophic losses.
It is really interesting getting to learn about this crucial concept in cryptocurrency trading. Great job Prof. @lenonmc21