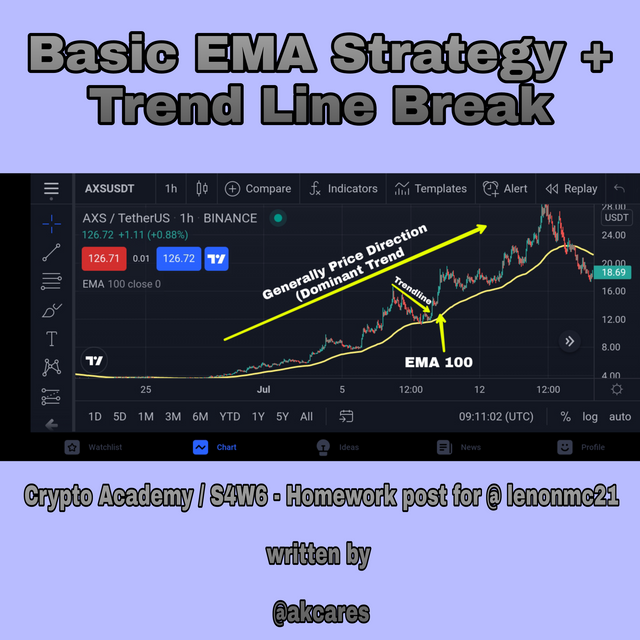
Basic EMA Strategy + Trend Line Break - Crypto Academy / S4W6 - Homework post for @ lenonmc21
I am delighted to be taking this lesson by Prof. @lenonmc21 this week. As it is, we are moving into real practical trading strategies. I believe with these kind of lessons, soon most of us beginners will be better equipped to take on real time trading. I will now proceed to respond to the assignment questions below.

Question One: Define and Explain in Detail in your Own Words, What is the Strategy of the EMA + Breakout of the Trend line?
The strategy of the EMA + Break of the Trend line is an interesting strategy which has some basic and less complex procedures. As the name shows, it is a combination of the technical indicator exponential moving average and the price action anaysis technique of trendline. In this case, a situation where the trend line is broken, in agreement with the EMA indicator is used as a signal to take a trade.
Here the EMA at 100 period, is inserted into the chart to show the overall direction of the market. When the price bars are climbing above the EMA line, this shows increasing price and an upward trending market. This bullish trend supports buying opportunities
When price bars are falling below the EMA line, this shows decreasing prices and a downward moving trend. The bearish situation suggest that selling trades will be more favourable and profitable.
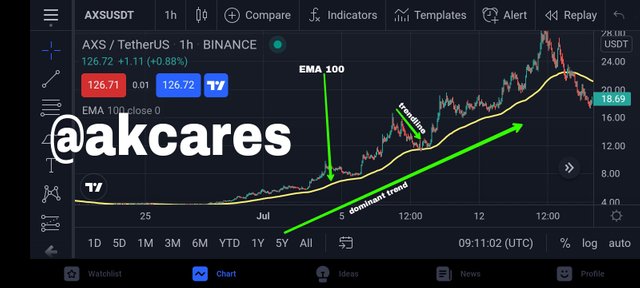
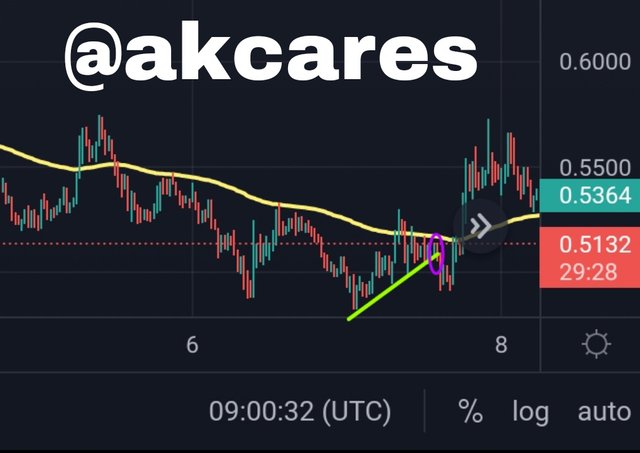
An illustration of the EMA + trendline breakout point technique.
Trendlines are also introduced into the chart. Trendlines refer to diagonal lines either moving from top to bottom connecting maximum and minimum points in the case of a bearish trend or climbing from bottom to top connecting minimum and maximum points in the case of a bullish trend. Along these major trends, short trendlines are introduced to indicate correction or retracements in the major trend and this is used to detect trading positions depending on the overall indication of the exponential moving average. The shorter trendlines show breaks.
The strategy uses these short trendlines which are drawn against the overall trendlines to pick entry points. This is done once these trendlines are broken by the price.
This strategy is used to first assessed what the dominant trend is then using the information from the EMA and the retracement trendlines to enter trades. Once the retracement trendlines are broken the price starts moving in the direction of the overall trend, a buy or sell trade can then be made depending on the market situation and if the price action is clear enough.
The strategy of the EMA + break of the trend line is used to execute trade and make market entry after a retracement has occured in the direction of the general trend.
Question Two: Explain in detail the role of the 100-period EMA in the EMA + Trendline Breakout Strategy?
The EMA is a technical indicator represented by a line which is kind of trajectory line showing the the direction of movement of the price. This information is gotten by the calculation of recent price action data and averages these data exponentially to indicate the most like motion of the price in relation to what it has been over a certain period as specified.
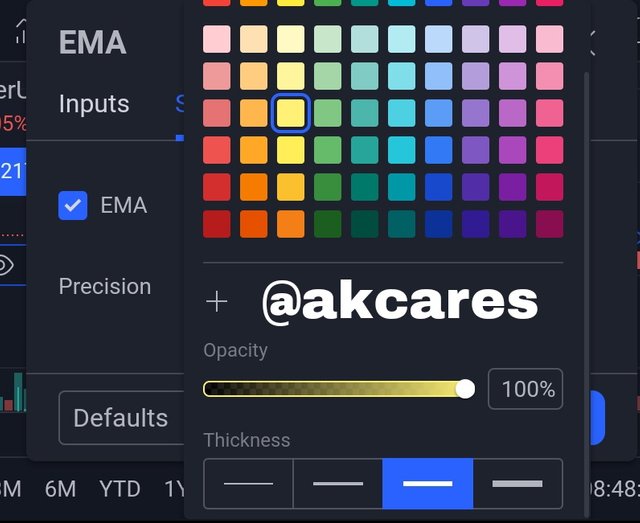
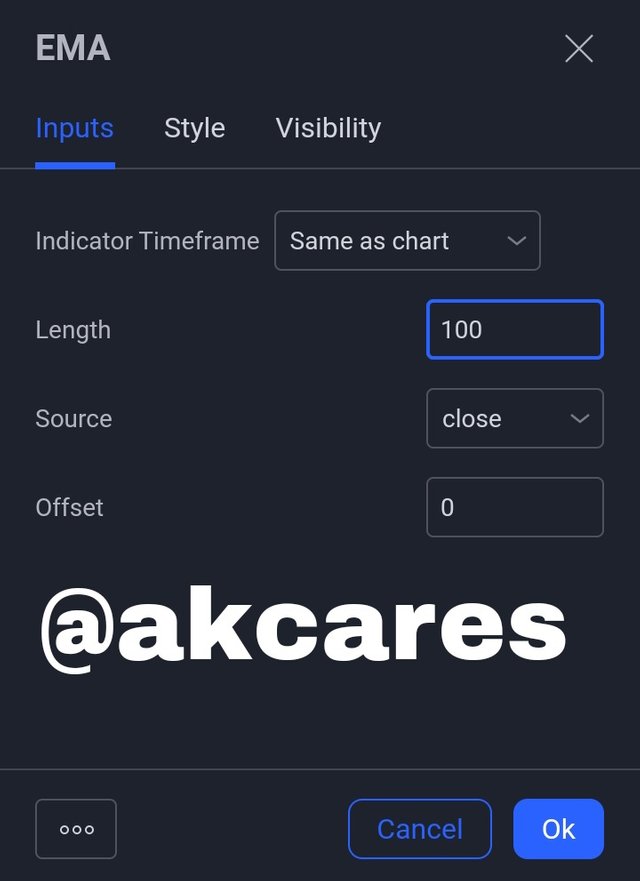
Setting up the EMA.
The function of this technical indicator is to show in what direction the price is moving. The role of the EMA is to indicate the behavior of the market price with regards to the trading activities of the most recent period. The EMA tells where the price is most likely to go. That is, it helps in determining the general price trend.
A basic rule in trading the cryptocurrency market is that trader should always trade in the direction of the trend. EMA is a useful tool in deciding what trend a market is on and this is very helpful in making trading decisions. Market moving in particular direction shows that there are more orders in that direction and that traders' sentiments and interest is more in that direction.
"the trend is your friend".
Question Three: Explain in detail the role of the "Trend Line" in the EMA + Breakout Trendline Breakout Strategy?
In the strategy of the EMA + breakout trendline, the function of the trendline is to signal point of entry of a trade. Trendlines are usually employed to show what patterns an asset's price is making and equally point to the direction of the price.
Trendlines have been employed over time in the cryptocurrency market. It serves a lot of purpose. In this strategy, the application of the trendline is to show a break or reversal of the retracement in respect is the dominant trend. Here, a break is simply a movement opposite the trend.
Trendline in a bullish market.
Trendline in a bearish market.
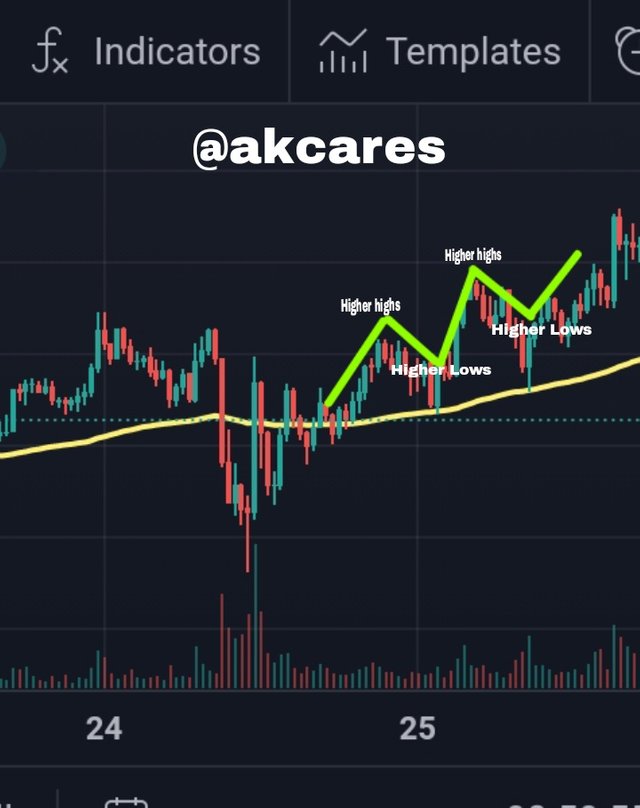
The trendlines which are usually drawn against the overall direction of the market are used to identify breakout points on these lines. When the overall market is in a bullish set up, the trendlines are drawn against this direction to be bearish by connecting the high levels in the retracement phase of the price movement.
Here, lower highs are joined together so that when price starts moving up again against this retracement trendlines, a buy trade can be placed.
Conversely, if the overall tren is a bearish trend, bullish retracement trendlines will be drawn. Here we are going to connect high low retracement points on the trendline. Once price breaks out and moves below this retracement trendlines, a trade can place a sell trade since the EMA has already signalled downward movement.
Therefore, the trendlines serve as a signal to enter a trade once price has broken the trendline.
Question Four: Explain the step by step of what needs to be taken into account to execute the EMA + Trendline Breakout strategy correctly?
If the aspirations of a trader is to be able to have the right information to conduct proper analysis and thus position himself in a better position to make profit, then such a trader needs a to be conscious in following certain steps in implementing a certain strategy.
EMA + Breakout with trend line strategy has some steps that aids its correct execution. These steps will be explained below..
Step One: Inserting EMA
The first steps involves a setting up the EMA inicator in the chat. For some specific trading platforms, a trader can decide what color the line is going to be and as well set up the thickness of the line along with other things.
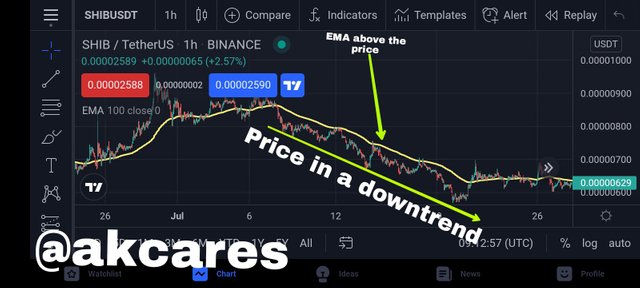
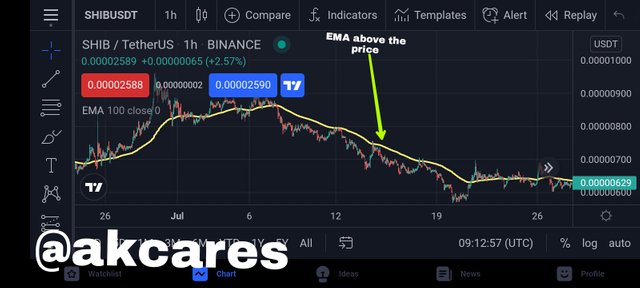
EMA above price, showing market situation for taking short trades.
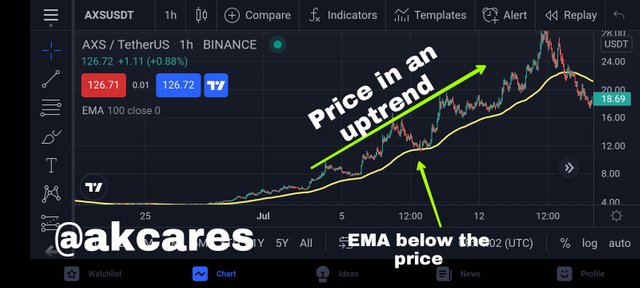
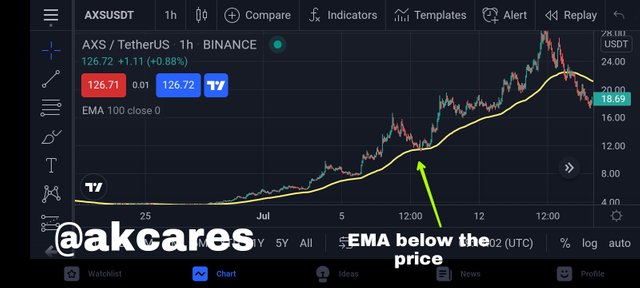
EMA below price, showing market situation for taking long trades.
The EMA is very necessary here because it is what will inform the trader what type of trading operation should be carried out. If the price is below the EMA, then a trader will have to be on the look out for selling opportunities. If the line is under the price chart, then a trader is to find signals to take a long position.
Step Two: Analysing Market Structures and Cycles
Moving on from setting up the EMA, the trader will have to make observation to understand the market phase in which the price is operating in at the current moment. The crytopcurrency market does not remain in one state for too long. The trend in s market will keep changing from time to time. This is done in what is called impulse, correction and consolidation.
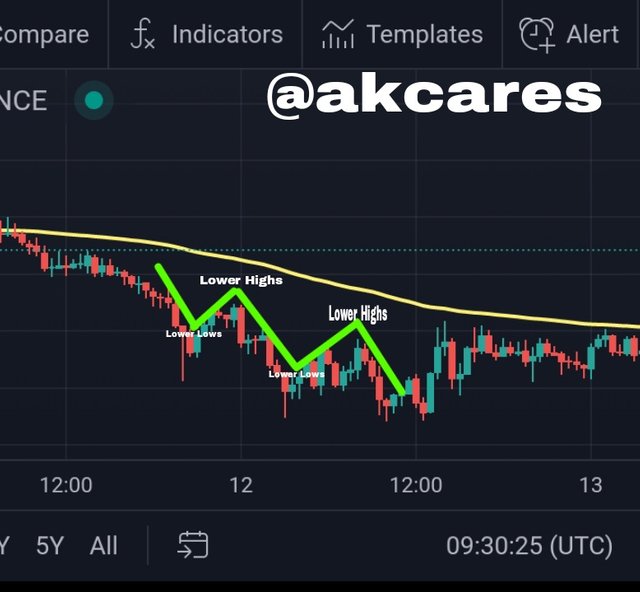
Bearish Market Structure
Bullish Market Structure
The market makes a move in one direction either upwards or downwards (impulse), reaches a certain level and reverses (correction) and the ranges or goes horizontal for a while (consolidation). These price phases are always present in the market. Accordingly, a trader will have to note what point the price is or what cycle of market is in operation.
Also, a trader needs to find a good formation in order to execute this strategy. If the EMA is above the price and in a downtrend, for this bearish market, a good configuration will be a clear pattern of lower highs and lower lows. With this present, the indication is good for a thr strategy to be executed.
Step Three: Drawing Trendlines
After the two steps above, a trader can move further to insert the trendline into the chart. In the strategy, the trendline is usually drawn in the retracement phase against the general market direction shown by the EMA.
This is to aid in spotting when the price breaks and recovers from the retracement and resumes movement again in agreement with the dominant trend.
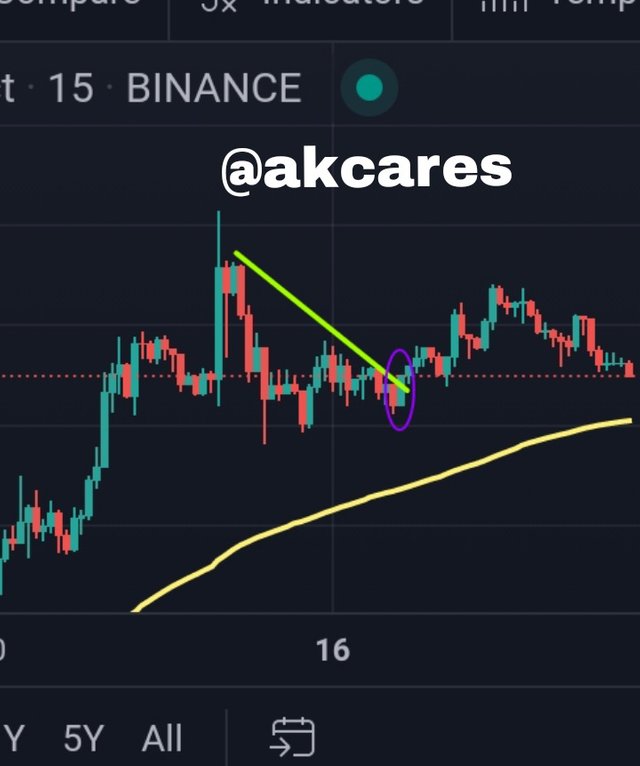
Trendline break in a bullish market.
Trendline break in a bearish market.
When the asset's price is going in a bullish orientation, the trendline here is going to be a bearish trendline connecting the maximum and minimum (lower high) points of the retracement so that when price stops retracing and goes bullish again, a buy trade can be taken.
When the asset's price is going in a bearish orientation, the trendline is placed in a bullish trend at the retracement cycle connecting minimum and maximum (higher lows) points so that when price crosses or breaks the trendline and proceeds in downward direction the trader can take a short trade.
It is necessary that a trader observes and follow these steps carefully. Without using the right steps, a trader may be at great risk of making wrong anaysis and may lose massively.
Question Five: What are the trade entry and exit criteria for the EMA + Trend Line Break strategy?
Life generally is about following rules. There are so many rules in existence, some explicitly stated, others not. Going against these rules will most times have consequences. Accordingly, there are certain rules and criteria that needs to be met in trading cryptocurrencies and in implementing certain strategies such as this one of EMA + trend line break.
The criteria to observe in order to enter or exit a trade using the EMA + trend line break strategy are:
The asset's price has to be on one side of the EMA. Price should be hovering over the EMA line of staying under it, that is, price should have a bullish orientation or bearish orientation respectively.
Price has to make a proper harmonic pattern formation, that is obvious lower highs or higher lows depending on the prevailing trend.
A trader then will have to draw a trend line. The trendline is to be drawn against the dominant trend. A bullish market will mean a bearish trendline and a bearish market will mean a bullish trendline.
Then a trader needs to then look out for a price candle that will break this trendline and close above it. This is a sign to enter a trade in the direction of the forming candle.
The direction of the price movement has to be deterministic either in an uptrend or in a downward and there has to be a well-formed pattern and market structure. A ranging market which moving in sidewards direction is not supportive of executing this strategy. Also, if a clear configuration is not gotten, it not ideal to proceed in this strategy. In these cases, a trader will have to suspend his analysis and wait for these criteria to be met.
Once the specified conditions are available, that is, there is a clear upward or downward market direction, the price is on one side of the EMA, there is an obvious market structure and there is a clear break of the retracement trendlines by the price, then an trade can be made. A market entry is made and stop loss and take profit is set appropriately either above or below depending on what direction the price is moving.
The stop loss and take profit is to be set in a ratio of 1:1 which is best for this strategy especially for beginners. Stop loss is set at the last highest or lowest point of the price and take profit is set at an equivalent position as the stop loss from the point of entry.
The above are the conditions and consideration that need to be followed and observed when applying the EMA + trendline break strategy.
They are further illustrated in the two screenshots below, one for a bearish market and the other for a bullish market
So here, the price is on a specific side of the EMA. That is, price above the EMA for the bullish market and price below the EMA for the bearish market.
There is an obvious market structure formation for both markets respectively.
The appropriate trendlines have been drawn and broken by the price.
Question Six: Make 2 entries (One Bullish and one Bearish) in any pair of "Cryptocurrencies" using the "EMA Strategy + Trend Line Break" (Use a Demo account, to be able to make your entry in real time at any timeframe of your choice, preferably low temporalities)
To answer this question, I will be using my trading view app where I have registered an paper trading account.
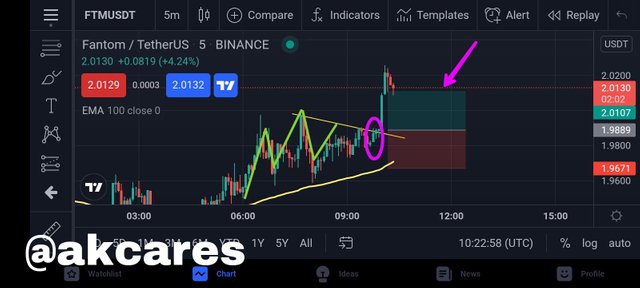
Buy Trade
I will first be taking a buy trade. The trade is in the pair of BNBUSDT ( Binance coin and Tether US). The time frame used for the trade is 5 minutes.
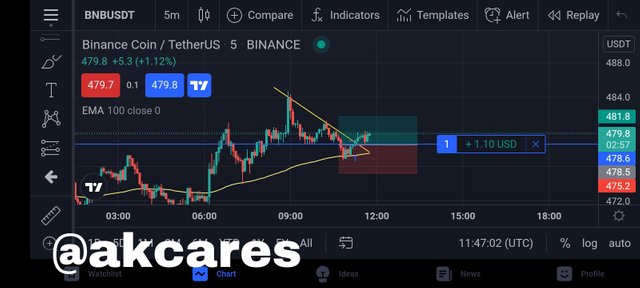
As seen above, I have observed the steps in placing the trade and I have followed the criteria.
The EMA line is under the price bars. This shows that the market is in a dominant uptrend and the there is more chances of favourable buying trades.
The market has formed a proper structure (higher lows and higher highs) and the trendline has been drawn against the general trend in the retracement.
Going further,a bullish price bar then breaks the trendline and closes above it and other bullish candlesticks are formed.
The order is placed at the point where the breakout candlestick closes and a new candlestick is formed. This is the entry point.
I then set my stop loss and take profit at the ration of 1:1. Stop loss is at some pips below the last bearish candlestick in the retracement phase while take profit if set above at the same percentage as the stop loss from the entry point.
From the screenshot, the trade is going quite well.
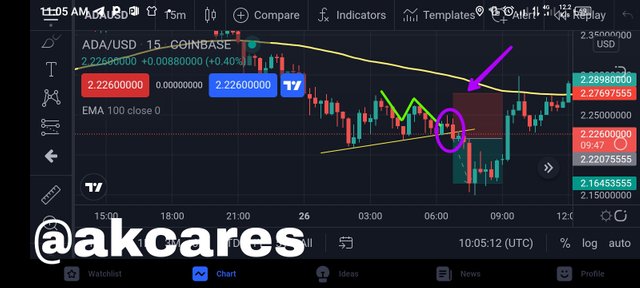
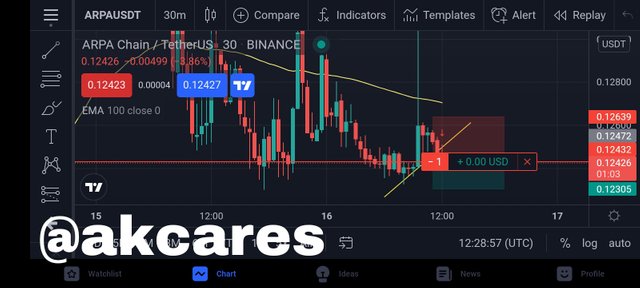
Sell Trade
I then went ahead to make a sell trade. This trade is in the pair of ARPAUSDT (ARPA chain and Tether US). The time frame used in the trade is 30 minutes.
Like the buy trade, I ensures that all the conditions in terms of the steps and the criteria were put in place.
Here, the 100 EMA is above the price. This implies that the price is in a decline and thus there better and favourable selling opportunities. Therefore, I am to take a short position.
The general market direction is in a bearish move.
There trendline, in the case a bullish trendline in the retracement phase has been drawn against the dominant trend.
Going forward, the price is able to break this trendline and bearish candlestick forms above the line and closes. This is my signal to enter the trade.
The trade is paced at the break out point, where the breakout candlestick closes and a new one opens.
The stop loss and take profit are set in a ratio of 1:1. The stop loss is at the some pips above the last bullish candlestick in the retracement phase and take profit is set down below at the same percentage as the stop loss from the point of entry.
The trade appears to have positive potentials.
Above is a description of how I took a long position and a short position in the market using the EMA + trendline breakout point strategy.
Once a trader has developed some expertise in carefully employing trading strategies, such a trader is more like to obtain maximum returns from his trades. As it is, there are multiple trading strategies available for adoption by cryptocurrency traders.
One such strategy is EMA strategy + trend line break. This is a great strategy for beginners to start from because it is not very complex. Like most other strategies, it has its steps for execution and also definite criteria that needs to be kept.
With a careful study of these requirements and understanding of how the strategy works and how it is implemented, a trader can have great success in his trades.
The lesson by Prof. @lenonmc21 is very educating. Great lesson!