Steemit Crypto Academy | Season 2: week 7 - The Swing trading style
Hello, everyone. I am glad to be a part of this class today and to be writing this assignment. It is no doubt that the academy has been a place for a lot of Steemit users over the last few months, each selecting a professor they want to participate in his/her class as well as write their assignment. For me today, I will be participating in the @yohan2on assignment about swing trading. This assignment is practical, so I will be going practical on it.
The Basics
A lot of us have heard about financial market trading (stocks, indexes, raw materials, metals, forex, and cryptocurrency), but for those who haven't heard and who will like to follow me through this post, I will do a little brushing up and will explain a few terms in case you are not up to speed with them.
Trading is referred to the buying and selling of goods and services but since we are dealing with the financial market, you should know that it is the buying and selling of financial instruments. While trading is something that a lot of people want to do for the sake of freedom, you need to understand that in other to trade successfully, there are two analyses; technical analysis and fundamental analysis. While the fundamental deals with news, geopolitical statements, financial statements, management team, micro, and macro trends, and so on, technical analysis studies the previous and supposed future chart of an instrument by observing price, volume, and trends.
A trading chart for a novice is a set of sticks and bars which moves up to form a mountain and down to form a valley but this is where a technical analyst gets the predicted/possible future movement of the instrument. Technical analysis doesn't care about news and fundamentals, it only deals with charts.
Swing trading is the trading of instruments by traders over a medium period of time. This period can be days or weeks as it is usually medium-time trading. This is unlike day trading where traders trade in a short period of time. This trading could be in minutes, or hours but the trade usually ends in a day.
Trading Plan
Before I discuss my trading plan, I will like to explain what a trading plan is. A trading plan is a complete summary of a trader's strategy which includes; trading system, risk management, time management, and trading rules.
| Trading type | swing trading |
|---|---|
| Trading Pair | ETH USDT pair |
| Risk management | SL at Three percent (3%) |
| Take Profit | $3398 |
| Entry | $2740 |
| Target Exit percentage | Lot 1: 60% |
| . | Lot 2: 20% |
| . | Lot 3: 20% |
| Exit | Target 1: $2944 |
| . | Target 2: $3195 |
| . | Target 3: $3398 |
| Stop Loss | $2673 |
Trading ETH|USDT
To analyze the trading pair, I will be using https://www.tradingview.com and the analysis will be done on multiple time frames, candlestick analysis, chart patterns, and technical indicators.
Multiple time frame analysis
To analyze this trade, I will be making use of the weekly, daily, and the 4 hours trading time difference.
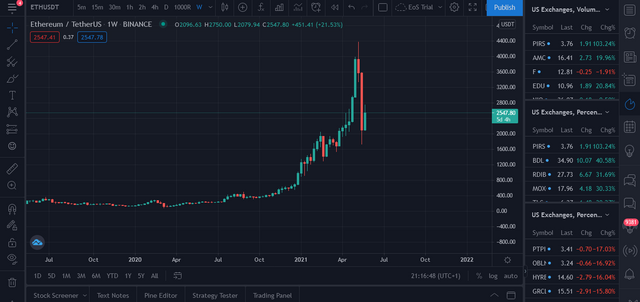
In this trading chart, each candlestick represents 1 week and it allows for an easy look into the trading pair and the history of the coin. In the past three weeks or two candlesticks from the present candlestick, ETH has been down to USDT but this week (current candlestick), the market has been improving.
.png)
The daily explains the price movement of ETH on a daily basis which means 1 candlestick represents 1 day. It will be used to identify the trend of the market over a period of time and it would be compared with the 4 hours chart for similarities.
.png)
The chart will be used to analyze the market and predict trade expectations. The 4 hours timeframe is very important for swing traders just as the 5 minutes, 15 minutes, and 1-hour timeframe is very important for day-trading.
Candlestick analysis and use of other relevant supporting indicators for your trade decision
The first thing to identify before trading is the chart pattern. You need to understand the trend of the market and any other pattern in the market. These are the basics of technical analysis. You need to understand if the trend is a downtrend, uptrend, sloping trend, peaks, bottoms, supports, and resistance.
I will utilize the weekly chart to identify the all-time high and low within the period of analysis since it gives a broader view of the market.
.png)
According to the chart, Ether (ETH) within the period of analysis (14th Aug 2017 - 25th May 2021) had an all-time low of $62.12 and an all-time high of $4365.74. With this, I will move to the daily chart where I will check for peaks and bottoms on the chart.
.png)
Using the 4 hours chart, I will be able to identify the trends, support and resistance, chart patterns, and use indicators as well as analyze entry and exit points.
- I identified a regression trend as the previous trend which shows that the previous trend was a downtrend.
.png)
- After identifying a downtrend, I checked to see that the trendline formed a falling wedge which could be a confirmation of the uptrend that followed.
.png)
After identifying the previous trend, I realized that there is an uptrend followed by a significant pause, forming a flag, also it can form an ascending triangle from its root. Both patterns are continuous patterns that show that the price should go up.
.png)
But then, there is a need to confirm with indicators and volume to confirm the action.
.png)
The volume isn't high currently which shows that the buying volume isn't large. To confirm the trade, I will be using Relative strength index (RSI) and currently, the RSI is at 56.17 is moderately overbought, and should see a little sell before going up
.png)
Trade management ( Setting stop loss, trailing stop and take profit)
.png)
I will be patient to let the market play into my hands and not the other way round, which means I will allow for the market to go past the triangle at $2740 which will be my entry point. and my first take profit will be $2944, the second will be $3195 while the final exit point will be $3398, and stop-loss at $2673. These points are very strong resistance points in the past and the stop loss is at a valid support point and less than 3% of the price of the entry price.
Conclusion
Something should be noted by traders which is "not trading is trading" because you still have your money intact and not lost over a failed analysis. If the market does not play to my hands, I will not initiate the trade, instead, I will re-analyze the trade. You cannot be smarter than the market but you must play along with the market.
Hi @ajewa
Thanks for participating in the Steemit Crypto Academy
Feedback
This is excellent work. Well done! thanks for demonstrating your understanding of Swing trading.
Homework task
10