Crypto Academy / Season 3 / Week 7 - Homework Post for Professor @yousafharoonkhan / Submitted By @aizeeck
INTRODUCTION.
It’s a thing of joy to join once again in this week 7 class of great learning. Even though the learning process causes some headache, the benefits outweighs the negative stuffs that is associated with it.
Learning is becoming interesting and rewarding through this loving arrangement of Cryptoacademy and the tireless effort of the professors.
I was wondering how this week’s classes will be. Since morning, I have been reading different lectures presented by various professors. I have to read through several times to understand what is presented by the professor before looking at the questions. Most of this week’s classes are not easy but when the going gets tough, only the tough will keep going.
Having gone through the presentation of professor @yousafharoonkhan on Trading View, I thereby present my homework task for the week.

TradingView.
We're a social network of 30 million traders and investors using the world's best charts and analysis tools to spot opportunity in global markets. Use us to follow your favorite assets, find trading ideas, chat with others, spot trends, and place trades directly on our charts. Source
From the above quotation; TradingView is a social network site with an app, that serve as a platform for millions of both traders and investors. The team of developers responsible for tradingview provides charts and analysis tools that help traders and investors to monitor the trend of markets and then decide on what to do. There are other services that aid users of tradingview in the global market as shown in the picture below.
From the above picture, tradingview developers offers the following:
Products; Chart, Pine Script, Stock Screener, Forex Screener, Crypto Screener, Economic Calendar, Earnings Calendar, TradingView Desktop.
Company; Pricing, Wall of Love, Blog, etc.
Community; Refer a friend, Ideas, Scripts, Streams, House rules, Moderators, Pine Wizards, Chat.
Business; Widgets, Advertising, Website & broker solutions, Charting solutions, Lightweight Charting Library, Brokerage integration, Partner program, Content streams & RSS.
How to register an account 0n tradingview.
To open an account in tradingview is quite easy due to many options that is available. The following steps are needed:
Get to the site. This can be done by using google to search for tradingview, click on the first option and select the browser of your choice to load the site or open a browser and type tradingview,com, and load it. Either of these steps will take you to the site home page.
I typed in tradingview.com straight into a browser (arrow 1) and load it as shown in the left side picture. Once the page load, the second step is to open the sign in page. Click on the avatar icon found on the top right hand side of the homepage (arrow 2), it will open the page for the next step as shown in the right hand side picture.
On this page, two things are worthy of note. The first is for those that already have an account. Once you click sign in as pointed by arrow 1, it opens where to sign in with various sign in options. The second is for those that do not have account, those that want to create a new account which is the focus of this section. To see the various plans for registration, click on Start free trial as shown by arrow 2.
There are four (4) various registration plans that the site offers. Three (3) out of the four (4) plans required monthly payment and the benefits differs depending on the amount paid.

From the above picture we can see the different plans:
- 1 Pro 14.95 USD/Month
- 2 Pro+ 29.95 USD/Month
- 3 Premium 59.95 USD/Month
- 4 Free basic do not require any payment and that’s the one I clicked.
It opened the page for sign up. Here too have various sign up options, about seven (7) as shown in the picture below, in which one can sign up with. I signed up with email which is the last option (7) on the page.
It then open for where to key in data to create the account, like username, email and password.

After that I ticked the boxes for agreeing the Terms of Use and I’m not a robot but I didn’t tick the middle one (5) because I want to be getting marketing emails. Once I fill in the columns, I clicked create account.
The account was created but was not yet active until I verify the email I used for the account. An email was sent that contains a link for the verification. I opened up my email and locate the one that is for verification. Then I opened the mail and click Activate account. After that, a page for me to put my picture, first and last name, came up which was the final stage of creating an account.

Once the account is activated, a mail will be sent to the email address, as shown in the next picture.
What are the different registration plans?

From the above picture we can see the different plans:
- Pro: This is the first registration plan that required $14.95 USD/Month. There are some benefits associated with this plan which varies from other plans like 5 indicators per chart, 2 charts in one window, 20 server-side alerts etc
- Pro+: This is the second plan with $29.95 USD/Month. The benefits of this plan differs with that of the former in some areas like; indicators per chart 10, charts in one window 4, server-side alerts 100, 2 devices at the same time etc
- Premium: This is the third registration plan that is open with $59.95 USD/Month. This plan offers complete package with other benefits that differed from the previous ones like; 25 indicators per chart, 8 charts in one window, 400 server-side alerts, 5 devices at the same time etc
- Free basic: This is the simpler registration plan that do not require any payment.

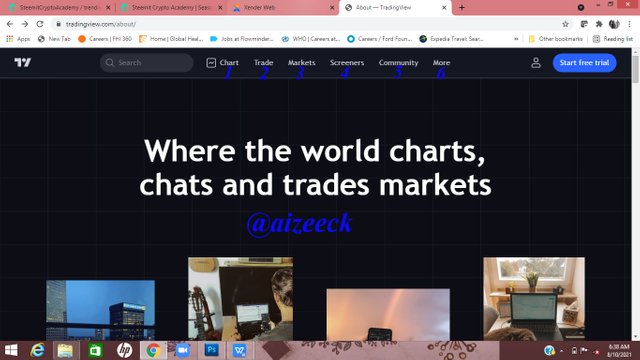
The different features of tradingview: There are about six (6) main different features of tradingview. Some of these main features have sub features as well. Below contain a brief presentation of the main features and by extension, some of the sub-features.
- Chart: This is the number one of the different features of tradingview. This section of the site contains the chart description both the bullish and the bearish trend of any selected asset. It also have tools that are used to modify the chart to suite ones need.
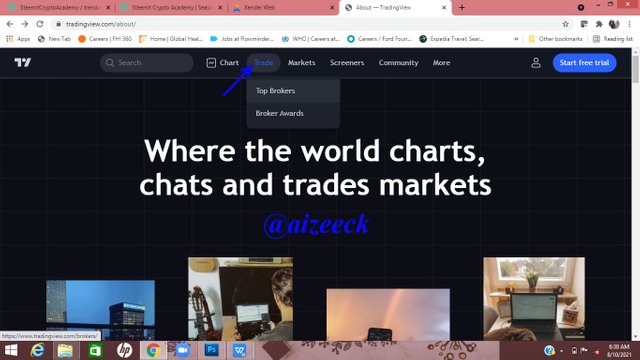
- Trade: This is the second feature found on tradingview. It is made up of Top Brokers and Broker Awards.
Top Brokers are the relevant brokers whon can open an account with for trading. Among the list is Capital.com, Currency.com etc. On other hand, Broker Award featured the “world’s best” broker in tradingview. The best broker gets an award and the name published in tradingview broker award.
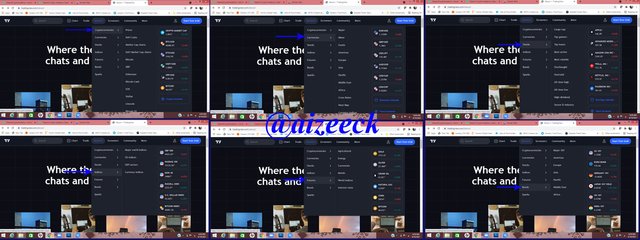
- Markets: This is the third main feature with seven (7) sub features which are Cryptocurrencies…, Currencies, Stocks, Indices, Futures, Bond, Sparks. Six (6) out these seven (7) sub features have there own mini sub features.
For example under;
Cryptocurrencies: are prices, DeFi Coins, Market Cap chart, DeFi Market Cap chart, and a list of some cryptocurrencies.
Currencies: are Major, Minor, Exotic, a list of six (6) regions of the world, Cross Rate, Heat Map, Currency indices.
There are many other examples as shown in the picture above.
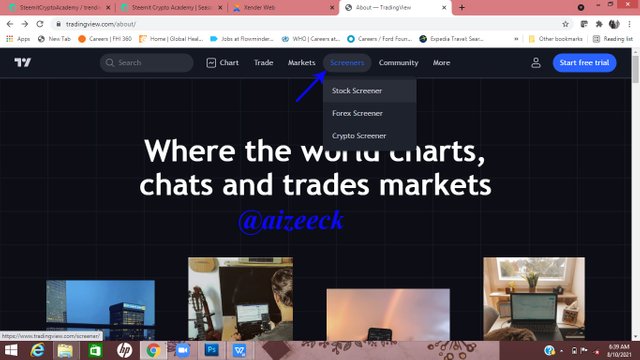
- Screeners: This is the fourth main feature and it has three (3) different sub features as shown in the picture below.
The three (3) sub features are Stock Screener, Forex Screener, and Crypto Screener
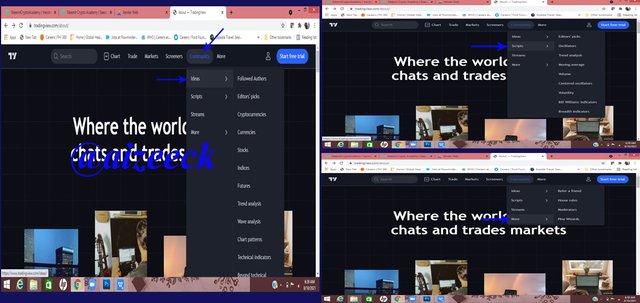
- Community: This is second to the last main feature of tradingview with four (4) different sub features which are Ideas, Scripts, Streams and More.
Three (3) out of the four (4) sub features have there own mini sub features. For instance, Ideas as a sub feature has about twelve (12) different mini sub features. The same applied with scripts which has nine (9) different mini sub features as well.
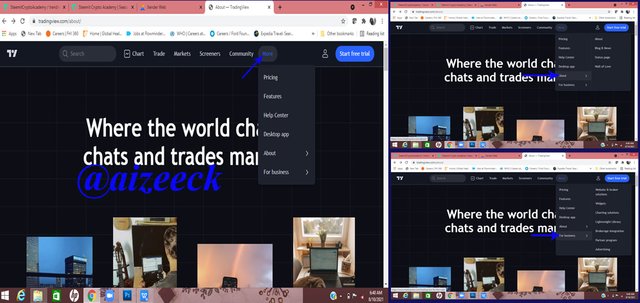
- More: This is the last of the Six (6) main features, with four (4) sub features as shown in the picture below.
The four (4) sub features are Refer a friend, House rules, Moderators and Pine Wizards
My favorite feature and why.
My favorite feature among the six (6) main features of tradingview, is Community, second to the last.
My reason for choosing this as my favorite is because of its content. It is a great field of learning! Let me present the following as an example where the sub features:
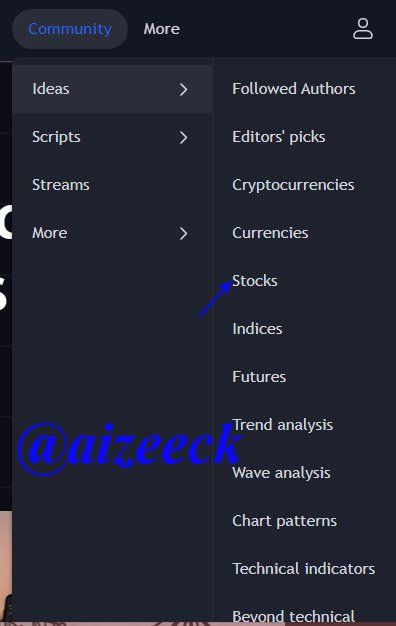
- Ideas: In this sub feature, there are twelve (12) mini sub features. Its an interesting thing to know that some of these mini sub features contains many information. For example, one of the mini sub feature stock, contains stock market information for more than forty (40) different countries. In each country’s stock market, the information was presented in Overview, Ideas and Market Movers. I learned some valuable lessons from the little I read in the course of this homework task.
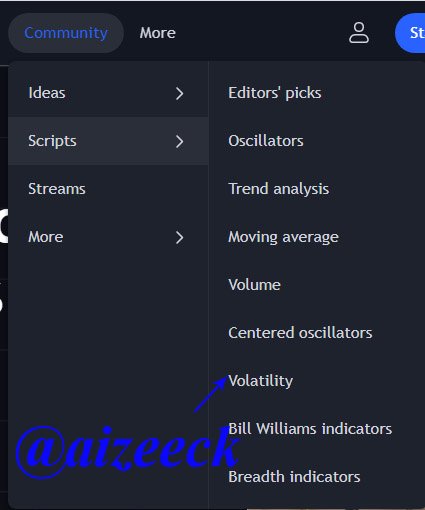
- Scripts: This sub feature has nine (9) different mini sub features too. Just like the one above, the content of each mini sub feature is presented under different headings. An example of this is Volatility. There are about ten (10) different headings like Standard Deviation, Bollinger Bands (BB), Average True Range (ATR) etc.
- Streams: These are videos about stock market, cryptocurrencies, currencies forex trading etc. Some of the videos are live trading.
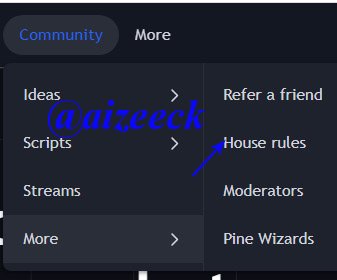
- More: This too have four (4) different mini sub features. I just looked into the House rules, and discovered some of the headings that are covered under house rule. Such headings are Make ideas understandable, All content should be ad-free, Publish in the same language as the site you’re on, Don’t plagiarize, Be nice, ….Don’t be an asshole, Post thoughtfully, Don’t fight the mods, Don’t create duplicate accounts, Don’t try to game the ranking system, Follow the correct advertising procedure, etc
How to set up a chart in TradingView
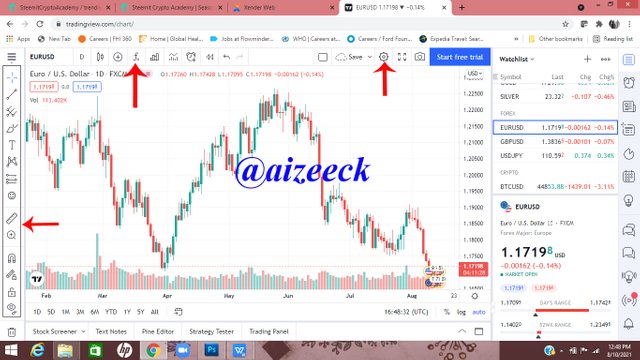
Setting up a chart in tradingview is the easiest thing to do. Just a click on the chart feature, opens up the chart. There in the chart, there are many things that can be used to edit or modify/beautify the chart visibility.
From the above picture, we see setting at the right hand side while the bar at the left hand side contains various tools that can be used to modify the chart.
In the chart setting section, there are some options which I selected the symbol and change the color of the graph chart as shown in the picture below.
Use two tools to edit it.
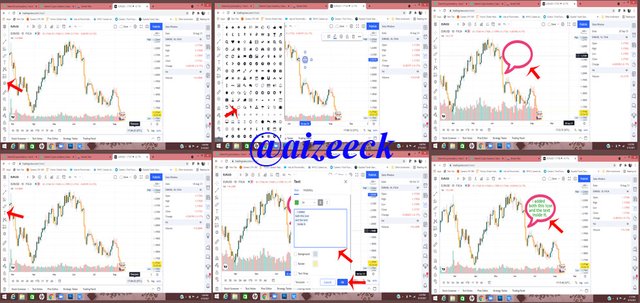
The little editing I made was that of changing the color of the chart as shown in the above picture. Another editing I made as seen in the picture below is adding an icon and writing a text right inside the icon on the chart.
For the icon: I clicked on the icon tool and it opened up many icons which I selected the one I want to add in the chart. I went to the chart and draw the icon, I dragged it to the size I desired.
For the text: I clicked the text tool and the click on the chart. It opened up a text box where I typed in the text I want to insert. I selected the color I desired for it and then click ok. The text appeared on the chart but not exactly where I wanted it to be. I dragged it inside the icon that is already on the chart
Explain how to add indicator in chart.
An indicator is anything, be it line, gauge, meter etc that shows the state or trend of something or movement. Indicator help its users to understand or figure out something in relation to what they want to achieve.
In trading, indicators are used by traders to analyse technically the market pattern or trend. With the help of an indicator, a trader can predict with a relative accuracy the market pattern which will aid him or her in making decision of either to trader or not. Indicator is very very important in trading and its importance can never be over emphasized.
To add an indicator in a chart required just few steps.
- first is to locate the indicator icon (fx) at the top left hand side of the screen. Once you click on it, it drops down , giving you an opportunity to type the indicator of your choice. There are various types of indicator like Moving Averages (MA), Relative Strength Index (RSI), MYC Trading Indicator, etc depending on what one want to do.
- After typing the indicator or its initial like ma for moving average, in the search column, it will show a list of more precise indicators. Click on the appropriate one and it will be added on the chart. Note that the number of time you click on it, is the number of indicators that will be added on the chart.
From the above screenshot picture, A is the indicator icon which I clicked and it opens up. B is where I typed in the of the indicator I want to add in the chart. C is the specified appropriate indicator I want to add. I just clicked on it once and it was added to the chart. D is the setting of the indicator where I adjust the figures, I clicked on it and opens E. In E, I set the perimeters of what I want. After setting it by adjusting the figures to my choice, I clicked ok
What is your your favorite indicator and why?
I cannot actually say any particular indicator as my favorite. Some of the once I tried to test in tradingview comes on and off when I clicked on them and I guess such ones are not allowed to be used in the free trial account plan.
I was not able to use much only the MA, RSI and V but in using these ones, I don’t know much of their importance or role as at when doing this homework. I saw the indicators on the chart but I don’t know how to interpret its presence on the chart. Although I planned to read more on it since it has much to do with knowing the market pattern.
The reason why I cannot specifically mention one indicator as my favorite is because of the reason stated above.
Is TradingView useful in predicting the market for cryptocurrency?
From the little knowledge I have been able to glean from this week’s class about tradingview, I will say a resounding yes! In my opinion, tradingview is a very useful site along with it tool, indicators and strategies. In predicting cryptocurrency market, tradingview indicators will be useful since it aids in knowing market trend. The usefulness of tradingview in predicting the market for cryptocurrency will be maximize when one purchase the premium plan which has the complete package, unlike the free trial account where some indicators were not allowed.
The diversity of tradingview makes it more valuable. Apart from the indicators, it has provision for published articles or news alerts, chat rooms where one will interact with more experienced traders. The importance of tradingview in predicting market for cryptocurrency is enormous and without doubt it’s useful both for beginners and experts alike.
CONCLUSION.
Tradingview being the main focus for this week’s class by professor @yousafharoonkhan has been an interesting one indeed. It has given me the opportunity to learn about the site, its various available plans, the features of the site, the tools as well as the indicators and strategies. Honestly speaking, without this class, I don’t know when I will have the opportunity to learn what I have learned within this few days I did the homework task.
It actually has been a great opportunity of learning to read through the lecture for the week and carry out the homework task to the best of mt ability.
My appreciative words here will never fully convey my deepest gratitude for this wonderful and loving arrangement to teach people like me, the knowledge of cryptocurrency. A knowledge that when fully utilize will change my whole financial life.
Written By: @aizeeck




Respected first thank you very much for taking interest in SteemitCryptoAcademy
Season 3 | intermediate course class week 7
you said that you have no much experience about indicator use, but when i read your homework ,you expalined very well, and you learnt from this class, it is really nice to know
thank you very much for taking interest in this class
I am determined to do as you have said. Thank you very much for going through my work.