Trading strategy with median indicator- Steemit Crypto Academy [S6W4] homework post for [email protected]
Median Indicator
Median price indicator gives a vast conceptual sketch and code on how to add these indicators. This is a very easy-to-use indicator with maximum output. By definition, it is defined as the intermediacy point between a higher point value and a lower point value respectively. In order to furnish information, it provides pricing details on the daily basis. The average price is visible on the chart given in the median indicator panel.
There are major two trends in the median indicator. Uptrend and the downtrend are shown by two different colors (i.e. Purple and Green). The Bearish trend is visible with a purple while the bullish trend is represented by greenish color.
Parameters and Calculations of Median Indicator (Screenshot Required)
There are certain parameters that need to be set before putting an indicator on the respective chart. The given input options are:
- Time Frame
- Median Source
- Median Length
- ATR Length
- ATR Multiplier
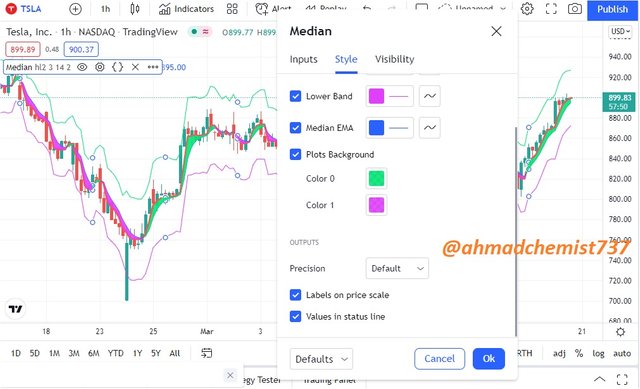
The time range or the visibility of the median indicator can also be selected in the provided options. One basic thing is how we are able to differentiate different points on the graph. This can be done by varying colors in the graph. By default, the median is represented by orange color. Upper band with the green, lower band with pink while median EMA is represented by a blue line.
The Median Indicator value can be easily known. The formula to calculate the median indicator is given as below:
Median Indicator Value = Highest Shown Price + Lowest Shown Price / 2
Uptrend from Median indicator (Screenshot Required)
Uptrend simply means an increase in any Cryptocurrency value that is well observed on the graph. When we use Median Indicator, it is quite easy to find an uptrend. This can be observed in the below given graph as well:
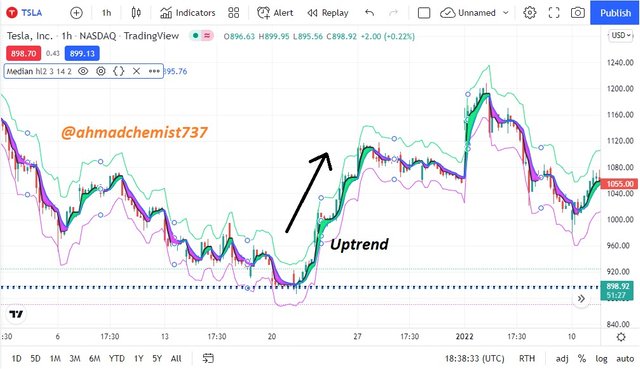
This graph shows that when the uptrend starts, the green line will start moving upward. This indicates a bullish signal. The market will see an increase in the price.
Downtrend from Median Indicator (screenshot required)
In a downtrend, sellers will sell their investments. This can be illustrated by the formulation of lower lows and higher highs. This is also referred as bearish movement. This can be illustrated as follows:
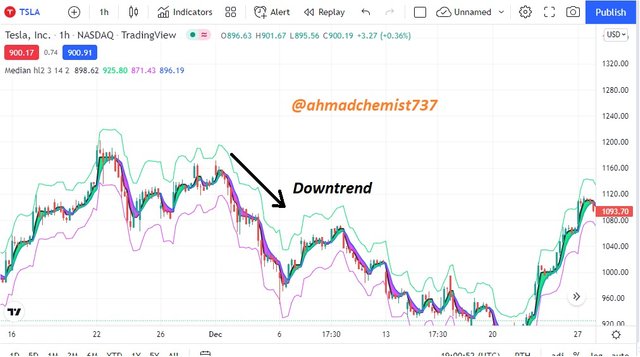
The black arrow suggest that the downtrend will start and bearish movement takes place. This indicator is just an indication of what should be done. It also depends on the saturation of orders in the market.
Identifying Fake Signals with Median Indicator
(Screenshot Required)
An indicator is just for the convenience of the future aspects of every signal. Sometimes, the reversal cannot occur at the right time but an indicator like median will tell you to continue. This indicator is not 100 percent true all the time.
It can be monitored by using an RSI indicator. It will provide you with a graph between two specific points which are 70 and 30. When the median line moves up or down these 70 and 30 points, the reversal should occur. If not, then it will be a false signal.
One thing should also be kept in mind that divergence should not be mixed with this fake signal process. Following graph shows how we can locate a false signal:
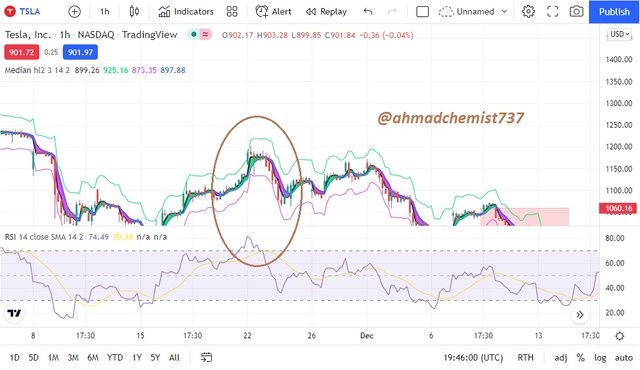
By looking into the chart, we can clearly observe that the indicator should give a sell signal as the median line is crossing under the median EMA line. But this reversal doesn’t happen at the right time and it becomes a false signal. A trader should not confuse this with other correct signals at the right time.
Opening two demo trades, long and short, with the help of a median indicator or combination that includes a median indicator (screenshot required)
To do demo trading, trading view paper trading was chosen. A Median indicator was used to buy and sell the orders according to the possible situations.
Long Trading (Buy NASDAQ: TSLA)
For the long trading, I choose the NASDAQ : TSLA pair and put a median indicator on the chart. I choose this as the chart was showing a green color increase and candles were giving the right hint to purchase at that time.
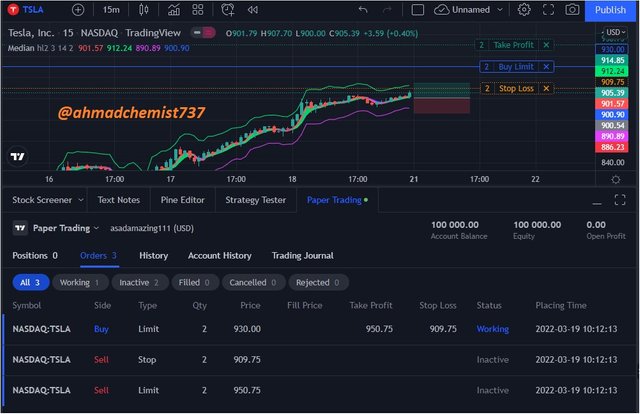
I placed the order and the ratio of taking profit and stop loss was set at 1:1. It was a long shot but according to the candle’s information and the trend, it was likely that the price would increase at a certain rate. It was observed later that the indicator gives correct information of making a margin from the trade.
Short Trading (Sell BITSTAMP:ETHUSD)
In order to perform a sell trading, I choose the BITSTAMP:ETHUSD Cryptocurrency pair from the trading view site. Paper trading was performed from a demo account and results were analyzed. Candles indicate that there will be a decline in the amount and purple line formation also confirms that.
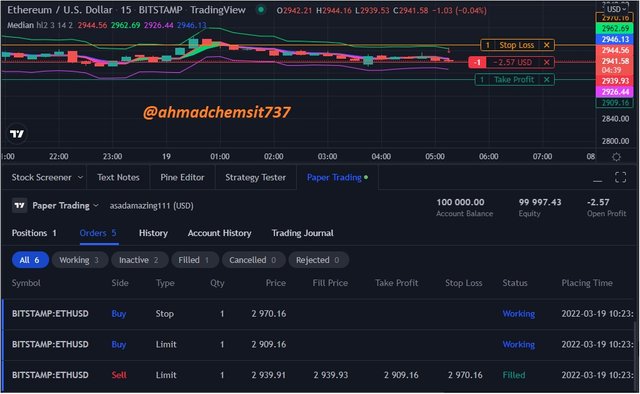
I placed the order with a 1:1 order. Fill price was $2939.93. The take profit and stop loss prices were set according to the above mentioned ratio.
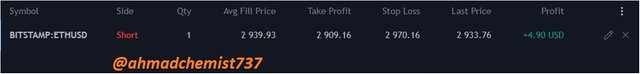
After a while, it was observed that our buy trade was giving a profit of around $4.90 USD. This shows that it was a correct step in buying a trading signal as given below.
Conclusion
By using the median indicator we learn that an indicator is very beneficial in deciding any trade in the market. The Median indicator will give you sufficient information on bearish or bullish trends happening in the market. One should also keep in mind the risk factors of using any indicator for a specific trade. False signals should be recognized by the trader at the right time. It is also elaborated in the assignment that by using the median indicators, buy and sell orders can be performed effectively.
Cc ; @abdu.navi03