CRYPTO ACADEMY / SEASON 4/ WEEK 2 - HOMEWORK POST FOR @REMINISCENCE01 : TECHNICAL INDICATORS

Hello Professor @reminiscence01. Thank you for the class. Below is my solution to the homework task for this week.
1. (a) In your own words, explain Technical indicators and why it is a good technical analysis tool. (b) Are technical indicators good for cryptocurrency analysis? Explain your answer. (c) Illustrate how to add indicators on the chart and also how to configure them. (Screenshot needed).
TECHNICAL INDICATORS
Indicators are a set of technical analysis tools that may be used to a trading chart to help clarify the market. They can tell if the market is trending or ranging at any one time. Indicators can also tell you when an item is overbought or oversold in a range and is due for a reversal.
It's worth noting that combining indicators to predict future market behavior yields a better result in trading. This means that two or three indicators can be employed simultaneously, and that an indicator can be used in conjunction with other technical analysis methodologies.
By way of identification, technical indicators are either displayed in the body of crypto charts (e.g bollinger bands, moving averages and parabolic sar) or they are found below the charts (e.g MACD, KDJ and RSI).
Technical indicators offers a wide range of opportunities for traders stocks, commodity, crypto, etc to make the best of decisions in trade. The many indicators used today offers different periods and time frame with which one can take decisions according to the market situation. As no one stays in the market all day, one can choose a time frame within which he or she is going to be available to monitor the market with the most suitable technical indicator for that period.
Also, technical indicators gives information about the current trend in a market. They present the most active traders in the market and with this, the best decisions are made my active traders
These makes technical indicators a good technical analysis tool.
WHY TECHNICAL INDICATORS ARE GOOD FOR FOR CRYPTOCURRENCY ANALYSIS
As mentioned earlier, cryptocurrency price analysis is one of the market covered by technical indicators and believes you me, they are very good fort trading cryptocurrency.
Cryptocurrency assets are volatile assets that can change in price at anytime. And uptrending market can suddenly change direction and go in a downtrend. This kind of sharp change in the price action can only be easily detected with technical indicators before information on the market situation of an asset reaches a crypto trader.
Also, technical indicators tells the dominant members of the market of cryptocurrencies at every given point in time. They also tell when the market is at equilibrium making it easy for traders to make decisions.
Because of the different time frames technical indicators work with, trading cryptocurrency with them is a bit easier as no one trade all day as decisions are taken on trade within the chosen time frame. This gives every trader what to make decisions with using the time he would be available to trade.
HOW TO ADD AND CONFIGURE TECHNICAL INDICATORS TO CHART.
There different exchanges from which crypto trading and investment are made.
Every trader uses the indicator/s that is most easily understood by him and best suitable for him. These indicators are added and some times configured to a chart to have a firsthand sight for the best trading opportunity and result.
Indicators are available on exchanges according to the standard of each exchange. This is to say that exchanges do not have all the indicators. They were selected and put in exchanges according to what the developers wanted. Also, most exchanges only offers the opportunity to add indicators but no opportunity to configure them in the way one needs them to function. Most exchanges comes with a default indicator that has been added upon sign up. This can be changed.
On the Binance exchange, to add an indicator, simply locate the chart of a crypto asset from the market by clicking on the crypto pair. Once the chart shows, check below the page, all the indicators available are presented, click on any of them to add it to the chart.
In the same vain, on the Huobi trading platform, click on the crypto pair from the market. This will display the chart.
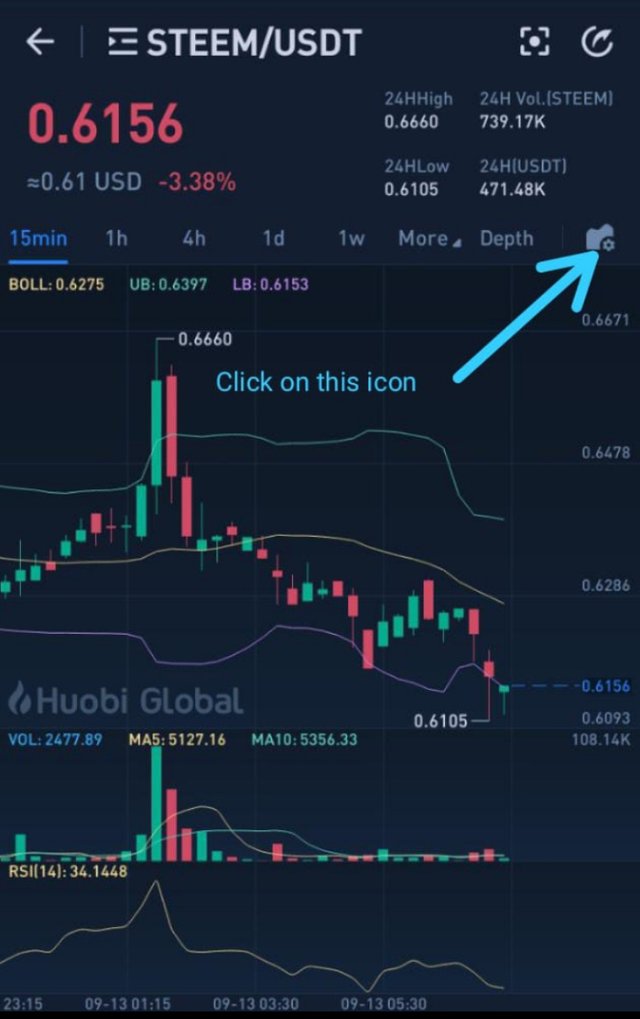
Click on the icon indicated in the screenshot. You would find the available indicators.
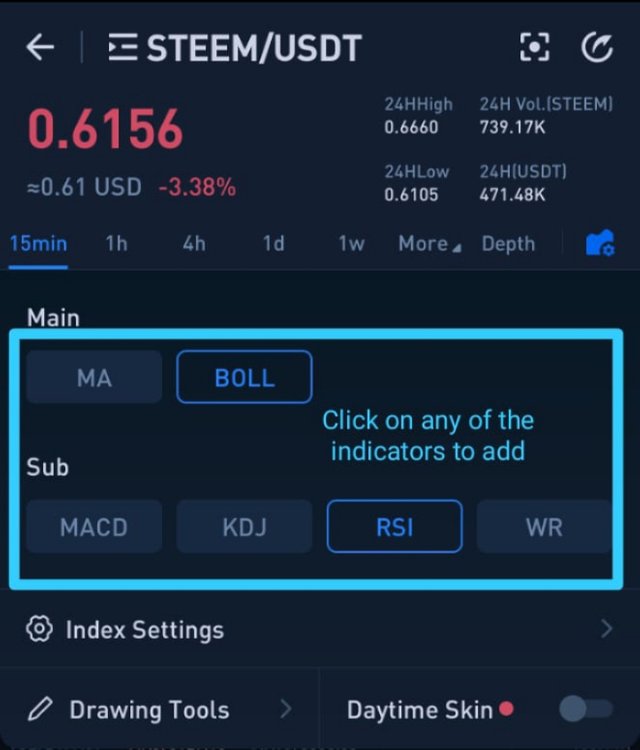
Click on any one of your choice to add it to the chart
For binance and huobi, some indicators appear on the bodies of the charts, the addition of one of its types result in the removal of the other that was previously added to the body of that chart.
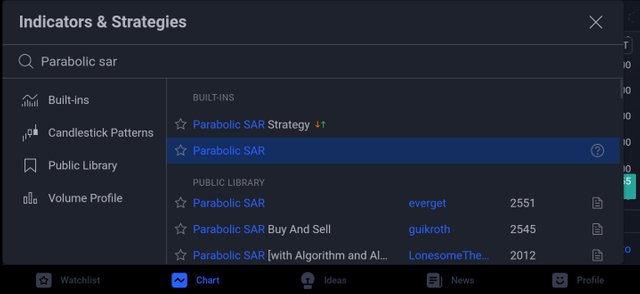
It is only on the tradingview application that one can add and also configure these indicators.
To add an indicator to a chart, simply go to the chart of the preferred crypto asset.
Look for indicators on the menu bar and click on it.
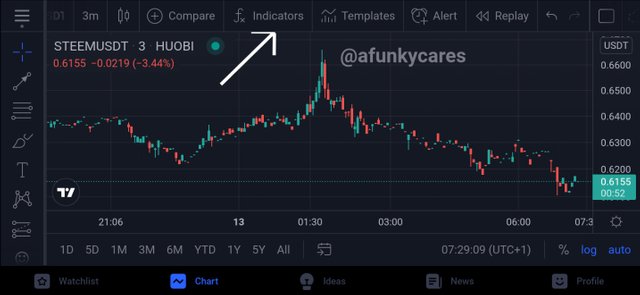
STEEM/USDT Chart
Search for the indicator of your choice and click on it. It will appear on the chart.
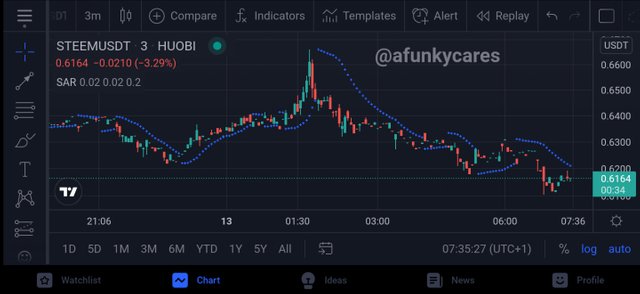
Parabolic Sar added to the Chart of STEEM/USDT
To configure an indicator to your taste, you just have to click on settings on the indicator that has been added and then change the default configuration. This will entail the colours, periods and some other features.
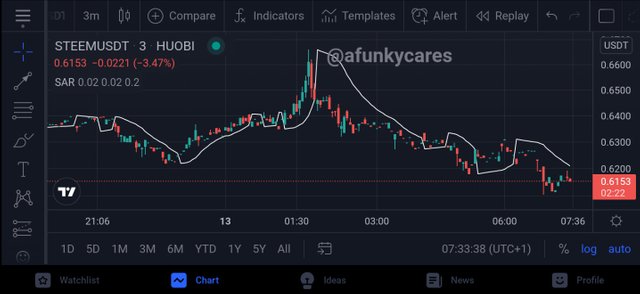
The configuration of the indicator has been changed as shown in this screenshot
On the [tradingview](tradingview.com], more than one indicator can be added on the body of a chart and both can be configured differently.
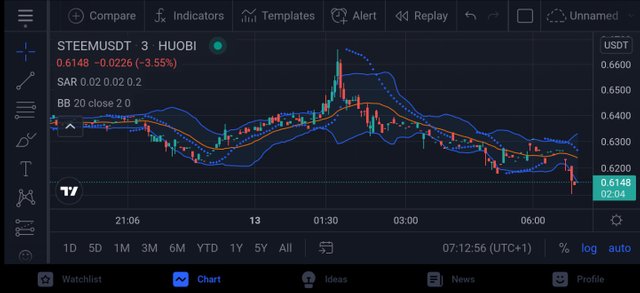
Bollinger Bands and Parabolic Sar in the one chart
2. (a) Explain the different categories of Technical indicators and give an example of each category. Also, show the indicators used as an example on your chart. (Screenshot needed). (b) Briefly explain the reason why indicators are not advisable to be used as a standalone tool for technical analysis.(c) Explain how an investor can increase the success rate of a technical indicator signal.
CATEGORIES OF TECHNICAL INDICATORS
Technical Indicators generate trading signals in a variety of ways, depending on how the indicator evaluates the price action to generate the signal. The different categories of indicators are discussed below.
- TREND BASED INDICATORS
The strength of a trend on a chart is not always visible, and a trending indicator can help to clarify this. The nature of trending indicators is that they are lagging.
They help a trader in three different ways.
a. Identify a trending market.
b. Ascertain how strong or weak a trend is.
c. Helps to determine the entry and exit points in a market.
One common example is the Average Directional Index (ADX)
See the screenshot below.
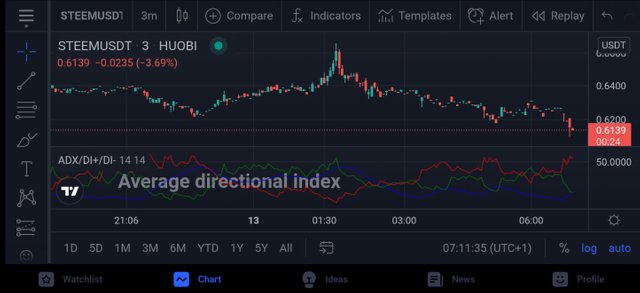
Average Directional Index(ADX): STEEM/USDT Chart
- VOLATILITY BASED INDICATOR
Volatility is the sudden change in the direction of price action. Crypto assets experience a sudden sharp fall or rise at some point. This results in swings being formed in the process of returning to its formal price. Higher highs, lower highs, lower lows, higher lows are formed. Volatility based indicators helps measure this fluctuations to determine how far a price has fallen or risen.
Example of this category of indicator is Bollinger Bands. See the screenshot below.
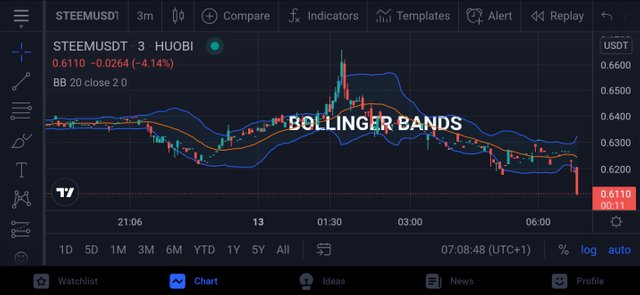
Bollinger Bands: STEEM/USDT Chart***
- MOMENTUM BASED INDICATORS
In crypto, momentum is the strength or force with which the price of an asset moves. The momentum of price can either be weak or strong depending on how active buyers and sellers are. For a market in an uptrend with strong momentum, after a while, the strength with which it moves up would be reduced as buyers begins to bid with high prices. This will make the price weak until the direction of the price changes. This category of indicators can be used to determine the level of their momentum to take appropriate decisions promptly.
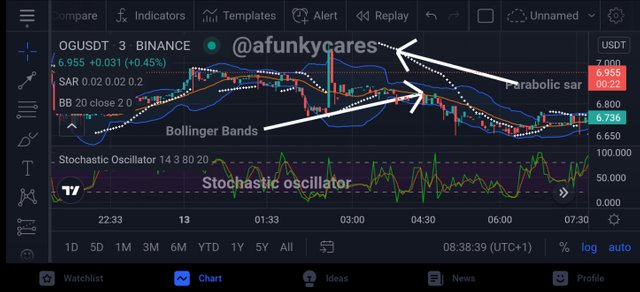
An example is Stochastic Oscillator The screenshot is given below.
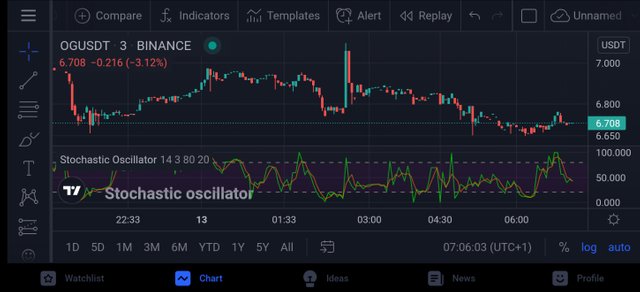
Stochastic Oscillator: OG/USDT Chart
WHY INDICATORS ARE NOT GOOD AS STANDALONE TOOL FOR TECHNICAL ANALYSIS.
Indicators are not good as standalone tools because the crypto space is big and the activities of buyers and sellers are not the only factors that influence the price of crypto assets. I say this because most of this indicators make their calculations from the behaviour of traders in the market.
Another reason why they are not good as standalone tools is that they give wrong signals therefore are not sufficient to make successful trade every time.
HOW an INVESTOR CAN INCREASE THE SUCCESS RATE OF A TECHNICAL INDICATOR SIGNAL.
An investor can increase the success rate of an indicator by combining two or more indicators to confirm signals which is to be used in trading decisions. This can be done by using two indicators that look alike or two indicators of different categories. For example, if an indicator is signaling downtrend and two other indicators gives same signal, a person in the market waiting to sell should sell and a person who has been watching to see if he could buy, should wait the more.
He or she can combine two or more indicators with other methods of technical analysis to take the best decisions on trade and increase the profit.
CONCLUSION
Technical indicators are very important technical analysis tools which are readily available in exchanges for predictions of the future price of assets and it's direction at any point in the market. They are easy to add, configure and use in making decisions. Even though many of them give wrong signals at certain times, these signals can be filtered by combining them or using other technical analysis tools.