[Heikin-Ashi Trading Strategy]- Steemit Cryptoacademy /S4W2/ Homework Post for @reddileep

Hello Professor @reddileep. Thank you for the insightful lecture. Here is my homework submission.
QUESTION 1- Define Heikin-Ashi Technique in your own words.
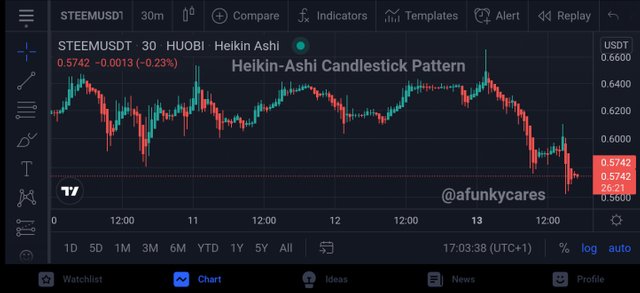
Screenshot from tradingview.com
The Heikin-Ashi technique is a candlestick pattern pattern developed in Japan by Munehisa Homma in the 16th century.
Heikin-Ashi itself is means average bars. It is a trading tool that uses candlestick charts to stand for and envisage market price data. It is used to single out market trend signals and predict price movements. The Heikin-Ashi technique makes use of average price data that that is useful to smoothen the noise in the market.
The lack of market noise allows for a clear depiction of market patterns and direction, which aids in predicting possible price moves. The trading approach aids traders in determining when to hold on to a transaction, pause a trade, or determine if a reversal is imminent. Traders can modify their positions as a result, avoiding losses or locking in profits on the chosen position.
Heikin-Ashi as a pattern of candle arrangement shows a connection between former and later candles. It doesn't only show volatility but points the trend and possible reversal of trends by changing colour. This pattern of candle stick conceals gaps present in Japanese candlestick which usually give bad signals.
It differs from the Japanese Candlestick in that it uses a formula remodified based on two period moving averages of high, low, open and close prices generating a clearer chart that makes it easier to identify trends and the imminent reversals.
QUESTION 2- Make your own research and differentiate between the traditional candlestick chart and the Heikin-Ashi chart. (Screenshots required from both chart patterns)
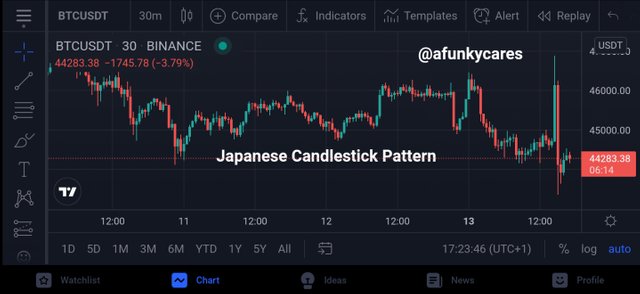
Screenshot from tradingview.com
| Heikin-Ashi Candlestick Pattern | Japanese Candlestick Pattern |
|---|---|
| 1. It does not have gaps between candles therefore it not confusion for traders | It have gaps between candles and this creates confusion for traders. |
| 2. The open and close price of the previous candle is used in calculating the new one | The previous candle doesn't have connection with the new one. |
| 3. The candlestick pattern presents a smooth chart | The candlestick pattern presents a rough chart. |
| 4. It is shows volatility, trend and signals trend reversals | It only shows volatility and trend. |
| 5. It is used to predict future price of asset | It can only shows the current price, it cannot be used for prediction. |
| 6. It removed the noise in the market which makes it clearer for prediction | It cannot remove noise in the market. |
| 7. It presents joined bars | It presents disjointed bars. |
| 8. It is easier to identify and interpret market trends and movements using Heikin-Ashi candlesticks because of the noise it eliminates with its smooth chart. | It is very difficult to identify and interpret market trends and movement with Japanese candlesticks because of the noise due to its rough chart. |
QUESTION 3- Explain the Heikin-Ashi Formula. (In addition to simply stating the formula, you should provide a clear explanation about the calculation)
CALCULATION OF HEIKIN-ASHI CANDLESTICK.
The open and close prices of the previous candle and the open, close high and low of the current candle are used in calculations of this pattern of candlestick.
By computation, we have
HA Close = [OPP + CPP+HPC+ LPC] /4
HA Open = [OPP+ CPP] /2
HA High = Max (VCH + VCO + VCC)
HA low= Min (VCL + VCO +VCC)
Where:
- HA - Heikin-Ashi
- OPP - Open Price of Previous candle
- CPP - Close Price of precious candle
- HPC - High Price of Current candle
- LPC - Low Price of Current candle
- VCH - Maximum Value of Current High
- VCO - Maximum Value of Current Open
- VCC -Maximum Value of Current Close
- VCL - Maximum Value of Current Low
Different time frame can be used for the Heikin-Ashi Candlestick. Heikin-Ashi Open is fixed at the middle of the previous candle and the HA close is computed as the half of price of the current bar. VCH is the highest price among the current highs which are the VCH and HPC. VCL is the lowest price among the current low which are the VCL and LPC.
QUESTION 4- Graphically explain trends and buying opportunities through Heikin-Ashi Candles. (Screenshots required)
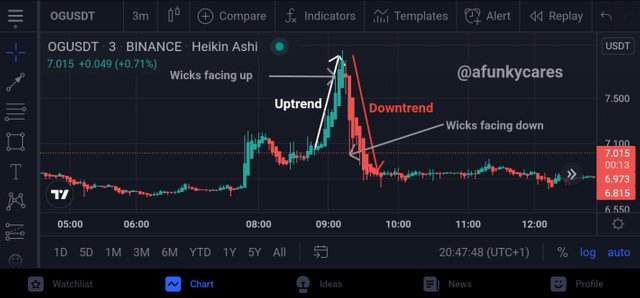
Screenshot from tradingview.com
Heikin-Ashi Candlesticks can be used to identify trends in the market of cryptocurrency assets. In a trending market where the candles have wicks t the top, it is an uptrend while in a trending market where the wicks of the candle are down, it's a downtrend.
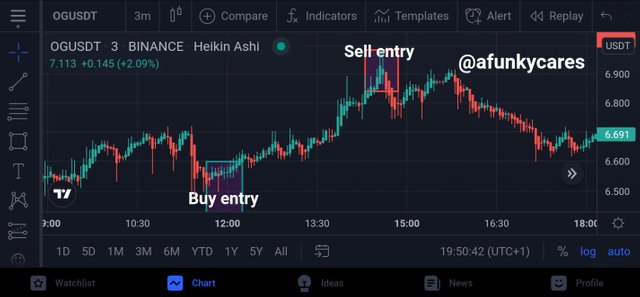
Screenshot from tradingview.com
Heikin-Ashi Candlesticks can be used to take buy positions or make buy entry when a downtrending market becomes indecisive. The market becomes indecisive when a the current candle forms a plus sign (+). I trader then have to look out for the next candle. If it comes out bullish, one can now make a buy entry.
Once the market moves up and until it reaches another indecisive point and the next candle that forms is bearish, a sell entry can be made.
In the screenshot above, I have marked all those points. One name make buy and sell entry at the points I marked in the above chart.
QUESTION 5- Is it possible to transact only with signals received using the Heikin-Ashi Technique? Explain the reasons for your answer.
Just like every other indicator or strategy, the Heikin-Ashi trading strategy ìṣ not sufficient of itself to transact with only the signals it presents. The Heikin-Ashi strategy is not 100% accurate, therefore there is a need to combine it with other trading strategies or technical indicators if more profits is to be made.
Even though one can combine the Heikin-Ashi strategy with other with any other strategy or indicators, it is necessary to note that the strategy is most effectively combined and used with averages (simple moving average and exponential moving average). This gives a stronger signals and better accuracy with Heikin-Ashi trading stategy, hence, more opportunities to make huge profits.
QUESTION 6- By using a Demo account, perform both Buy and Sell orders using Heikin-Ashi+ 55 EMA+21 EMA.
Sell Order: I made a sell order from binance in a live chat. I had been waiting for an opportunity to sell using the Heikin-Ashi strategy.
I waited until the asset is in a bullish run. At the point when the market became indecisive, I made the sell entry so I would not lose part of the profit I have made.
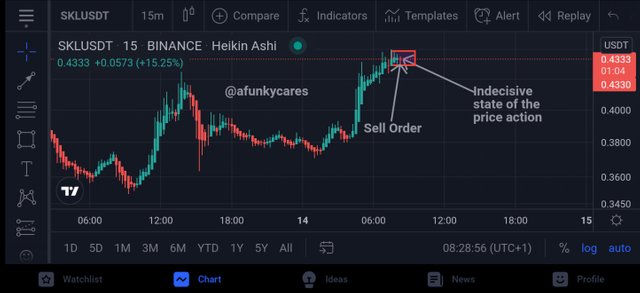
Screenshot from tradingview.com
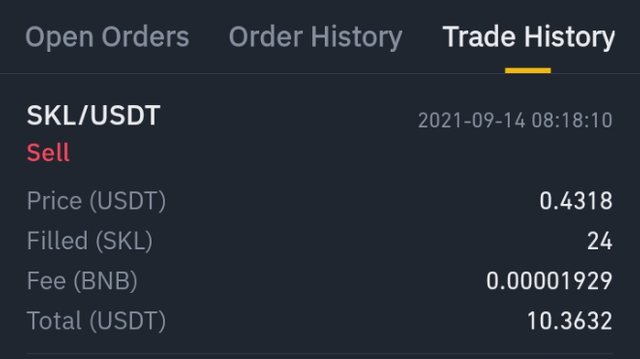
SKL/USDT pair Screenshot from binance
Buy Order: I looked for an opportunity to buy using the Heikin-Ashi strategy combined with Exponential Moving average. I used the former to get the signal while I confirmed with the later. At the point the coin became indecisive, I waited for the next candle which was bullish, so I made a buy order.
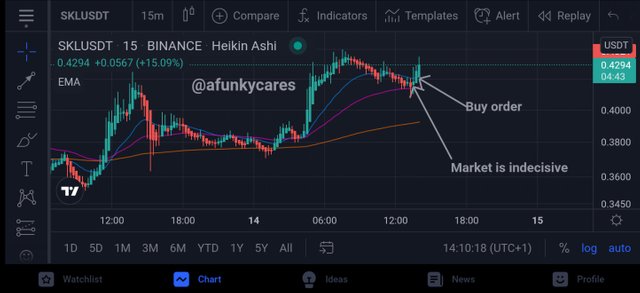
Screenshot from tradingview.com
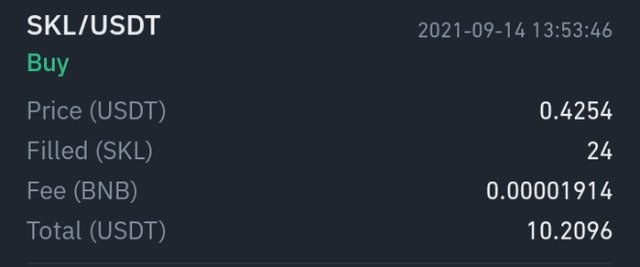
SKL/USDT pair Screenshot from binance
I have had SKL which I bought some days ago. So I used them to perform this task as I do not want to bother myself with demo trade. So I sold before I had to buy later when the signals were given by the Heikin-Ashi strategy and confirmed with the EMA.
CONCLUSION.
Heikin-Ashi is a new strategy to me that I would use to make my trading decisions. It's signals are reliable to a great extent but this doesn't make it 100% accurate. For this reason, it is also combined with other indicators and strategies for making decisions on trade.
Special Mentions:
@reddileep